8/14: Watch Resistance at 3352–3358, Support at 3332–3323Good afternoon, everyone!
After entering the 3372–3378 resistance zone, gold attempted two breakouts but failed, forming a double-top pattern and breaking below the 3366 support. It then found temporary support at 3358–3352, but the rebound failed to reclaim 3366, leading to a further drop to test the 3343–3337 area. This is a textbook support-to-resistance shift, worth studying for those interested in technical analysis.
Currently, the structure favors the bears. In the coming moves, watch closely to see if the 3352–3358 area turns from support into resistance again. If selling pressure persists, 3332–3323 will be the next battleground. Should bulls fail to defend it, the 3300 level could be retested.
For the rest of the week, trading should remain focused on these key support and resistance zones. With data coming in during the US session today, risk management is crucial — favor short positions on rebounds, with long trades as a secondary option. If caught in a losing position, and your account is safe, consider averaging down or hedging. If you need assistance, feel free to message me.
Xauusd4h

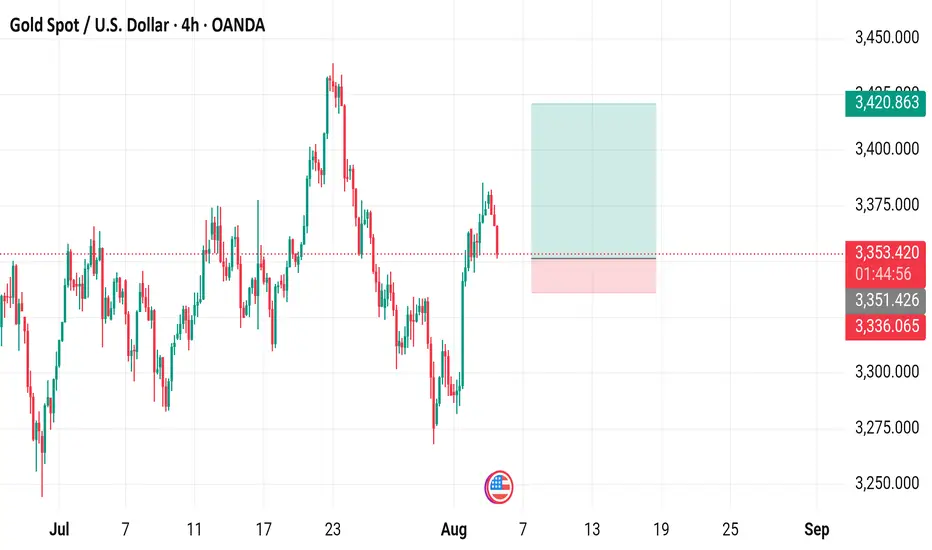
Gold Spot / U.S. Dollar (XAU/USD) 4-Hour Chart - OANDA4-hour chart from OANDA displays the price movement of Gold Spot (XAU/USD) from late July to mid-September 2025. The current price is $3,335.985, reflecting a decrease of $6.670 (-0.20%). Key levels include a sell price of $3,335.720 and a buy price of $3,336.270. The chart highlights recent price fluctuations, with a notable drop and a shaded support/resistance zone between approximately $3,340.000 and $3,360.000

Gold Spot / U.S. Dollar (XAUUSD) 4-Hour Chart - OANDA4-hour price movement of Gold Spot (XAUUSD) against the U.S. Dollar, sourced from OANDA. The current price is $3,349.050, reflecting a decrease of $48.715 (-1.43%) as of 01:11:40. Key levels include a sell price of $3,348.830 and a buy price of $3,349.380, with a highlighted support zone around $3,348.849 and a resistance zone near $3,370.815. The chart covers the period from early August to mid-September 2025.

GOLD Touches the Order blocks and does a little retracement.Gold is stuck in some range bond and is still not able to break 3500. Watch the DXY and be very careful when it breaks the supports or resistances. Can be fake-outs. Check your support and resistances and open positions accordingly. Wait for Price Again and strong solid breakouts to enter the market.
Disclaimer:
The content presented in this IMAGE is intended solely for educational and informational purposes. It does not constitute financial, investment, or trading advice.
Trading foreign exchange (Forex) on margin involves a high level of risk and may not be suitable for all investors. The use of leverage can work both for and against you. Before deciding to participate in the Forex market, you should carefully consider your investment objectives, level of experience, and risk tolerance.
There is a possibility that you may incur a loss of some or all of your initial investment, and therefore, you should not invest money that you cannot afford to lose. Be fully aware of all the risks associated with foreign exchange trading, and seek advice from a licensed and independent financial advisor if you have any doubts.
Past performance is not indicative of future results. Always trade responsibly.
8/11: Sell High and Buy Low in the 3416–3372 RangeGood morning, everyone!
This week’s major data releases and news events are concentrated between Tuesday and Friday. Monday is relatively calm, so today’s strategy will mainly rely on technical analysis.
Technically, after a pullback to the MA20, last week’s weekly candle closed as a small bullish candle, and price has re-entered the strong resistance zone at 3400–3450. On the daily chart, bullish momentum hasn’t been fully released yet, but the 4H chart is showing early signs of bearish pressure. For today, keep an eye on the 3400–3420 resistance area, with primary support at 3386–3378 and secondary support at 3372–3366. Unless the bulls completely give up, a break below secondary support seems unlikely.
The main trading range for today is 3372–3416. If the market turns into a one-way move, consider a “contrarian” approach — just avoid buying high and selling low. If you find yourself in a trapped position, don’t panic. As long as risks are controlled, you can use scale-in entries or hedging to recover. If your trade rhythm is off, even holding onto positions (“sitting it out”) can reduce losses or turn a profit. Of course, if risk gets out of control, cut losses decisively — better to retreat than to blow up the account.
Account safety always comes first. Keep your capital intact, and you’ll find plenty of profitable opportunities this week — so many, you might start wondering if someone added extra days to the calendar.
If you need assistance, feel free to leave me a message.

XAUUSD - General structure and basic dynamicsBrief technical analysis
1. General structure and main dynamics
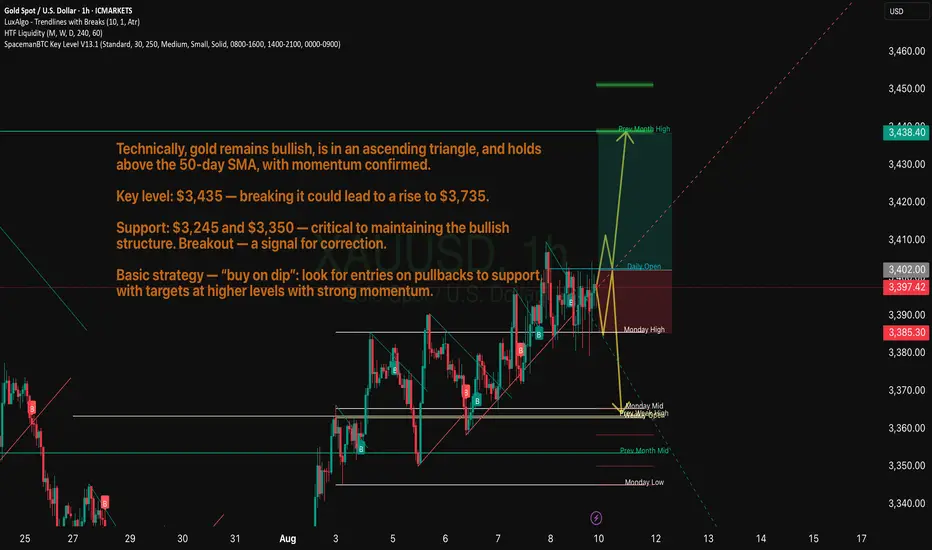
Gold is trading in an ascending triangle, a bullish pattern indicating potential for further gains. The price has consolidated above the 50-day moving average, and the RSI is reinforcing the bullish sentiment.
The MACD and RSI (≈ 54.7) are signaling growing positive momentum, especially after the rebound from the lower Bollinger band and the formation of EMA-8/EMA-21 crosses.
Citi has raised its forecast to $3,300-3,600 over the next three months, given the weak US economy and the weakening dollar.
Yesterday, gold prices were close to a multi-year high near $3,400. A break of resistance around $3,435 could bring gains to the target of $3,735 (according to the “measured move” pattern).
However, an HSBC analyst warns of weakness in momentum; a pullback after growth is possible, especially with an improving global background and a delayed tightening by the Fed.
2. Key levels
Resistance:
~$3,435 — the top of the ascending triangle
If broken — potential target $3,735
Investopedia
Support:
~$3,245 — the lower boundary of the structure and the zone of a possible pullback
Next — ~$3,150 with further sales
50-day SMA: ~$3,350 — a critical level for maintaining the bullish scenario
Gold Spot / U.S. Dollar (XAU/USD) - 4 Hour Chart (OANDA)4-hour chart from OANDA shows the recent price movement of Gold Spot (XAU/USD), currently at $3,353.240, down $20.395 (-0.60%). The chart highlights a sell price of $3,353.010 and a buy price of $3,353.450, with a shaded area indicating a support/resistance zone around $3,351.426 to $3,353.240. The data reflects trading activity from July to early September 2025.
XAUUSD Ascending Channel Run to Supply Trade IdeaGold (XAUUSD) remains in a bullish trend 📈, forming higher highs and higher lows within a well-defined ascending channel ↗️. Price is approaching a recent swing high near resistance 🧱, and I’m watching for a short-term pullback into channel support 🔄 before a potential continuation higher toward the supply zone above 🎯.
This structure aligns with Wyckoff’s markup phase ⚡, where pullbacks serve as tests (LPS) before further upside. As long as price holds above the channel’s lower boundary 🛡️, the bullish bias remains intact — a break below would invalidate the setup ⚠️. Not financial advice.

8/6: Watch for a Potential Double Top FormationGood morning, everyone!
Yesterday, gold experienced its first significant supply pressure around the 3386 level, but with support near 3350—helped by positive data—prices rebounded and climbed back toward 3390, resulting in solid overall gains.
From the 1-day chart (1D) perspective, the technical structure remains bullish, with MA20 providing firm support. Although short-term moving averages are currently converging, the overall bias remains towards a bullish divergence, suggesting further upside potential. There's a possibility for price to test the 3400–3420 zone in today’s session.
That said, the 3386–3398 region may still pose minor selling pressure, although it is not expected to be particularly strong. Key intraday support is seen in the 3378/3372–3362 range. If the market encounters another wave of heavy selling that damages the daily bullish setup, then the 3343–3348 area will become a critical battleground between bulls and bears.
📌 Trading Strategy for Today:
Maintain a sell-on-strength approach, especially if prices approach the 3418–3438 resistance area, where short opportunities become more attractive;
If a pullback occurs, monitor the aforementioned support zones for potential buy-on-dip opportunities, contingent on stability.
⚠️ Market Risk Reminder:
There will be key economic speeches during the US session, which could trigger heightened volatility. Ensure proper risk management and stop-loss settings are in place.

8/5: Watch for Short Opportunities Near 3400Good morning, everyone!
On Wednesday, gold held above the key support area at 3343–3337, and subsequently broke through the 3372–3378 resistance zone, leading to a strong bullish move and solid long-side gains.
Today, attention should shift to the major resistance around 3400. If bullish momentum continues, price may approach the secondary resistance near 3420. However, from a technical perspective, signs of bearish divergence have begun to emerge. Should price continue rising while momentum weakens, the risk of a short-term correction increases accordingly.
Key levels to monitor:
Primary resistance zone: 3404–3416
Intermediate supply area: around 3398
Crucial support zone: 3372–3363 (a hold here could support further upside)
⚠️ Cautionary Note:
The US PMI data release during the New York session could introduce volatility. Be sure to maintain strict risk management and stop-loss discipline during periods of increased uncertainty.
🔁 Trading Bias for Today:
Prefer selling into strength near resistance, while cautiously considering buying on dips near support.
The 3343–3337 area continues to serve as the primary support zone, and price action around this level will be critical in determining the next directional move

XAUUSD Thursday Chart Market Structure & Context
Timeframe: 15-Minute (M15)
Overall Trend: Bearish after a confirmed Break of Structure (BOS) to the downside
Current Price Action: In a retracement phase toward a premium supply zone
Bias: Expecting a liquidity sweep upward, followed by a strong sell-off
🧱 Key Structure Zones
NYL.H & NYL.L: High and Low of the previous New York session
ASIA.H & ASIA.L: High and Low of the Asia session
NYPM.H & NYPM.L: High and Low of the New York PM session
🔍 Critical Levels & POIs
Breaker Block (Dark Gray Box)
Formed after price swept buy-side liquidity and then broke structure upward
Expected to act as a support zone for a temporary buy or a reaction point
BSL POI (Buy-Side Liquidity - Point of Interest)
A manipulated breakout area targeted by smart money
Expected to entice FOMO buyers before a sharp reversal downward
Sell-Side Liquidity (SSL)
Located below the current breaker block
This is the final liquidity target for a continuation sell move
📈 Expected Price Behavior
Price is currently retracing upward
Projected Scenario:
Price moves up to tap into the BSL POI zone (around 3,303–3,305)
Price rejects the POI, forming a potential distribution range
Breakdown from the range initiates a sell-off
Targeting final support / liquidity sweep around 3,268.04
🎯 Trade Setup & Plan
Bias: Sell after a liquidity sweep above key highs
Entry Trigger: Upon clear rejection from the BSL POI zone
Stop Loss: Above BSL POI (~3,307–3,309)
Take Profit: 3,268.04, yielding a Risk-to-Reward Ratio ~4.67
⏰ Killzone Timing (SMC Timing Model)
NY AM Killzone (14:00–19:00 GMT+7)
→ Ideal for entries; likely where liquidity manipulation occurs
NY Lunch & PM
→ Potential for distribution phase completion and sell-off
📌 Additional Notes
Price action reveals a clean FVG (Fair Value Gap) and a completed BSL sweep
Final downside target aims for the NYPM Low, identified as a weak low
Rejection from the breaker block is crucial; confirmation via BOS/CHoCH on lower TF is preferred

Gold Spot / U.S. Dollar (XAUUSD) - 4 Hour Chart (OANDA)4-hour chart from OANDA displays the price movement of Gold Spot (XAUUSD) from late July to early August 2025. The current price is $3,332.775, reflecting a decrease of $35.935 (-1.07%) as of 07:54 PM PKT on July 25, 2025. Key levels include a sell price of $3,332.480 and a buy price of $3,333.050. The chart shows recent volatility with a shaded support zone around $3,312.314 to $3,367.326, indicating potential price stabilization or reversal areas.

7/25: Key Levels to Watch Closely for Next Week's TradingGood evening, everyone!
Due to health reasons, I had to take a short break from updates — thank you all for your understanding and support.
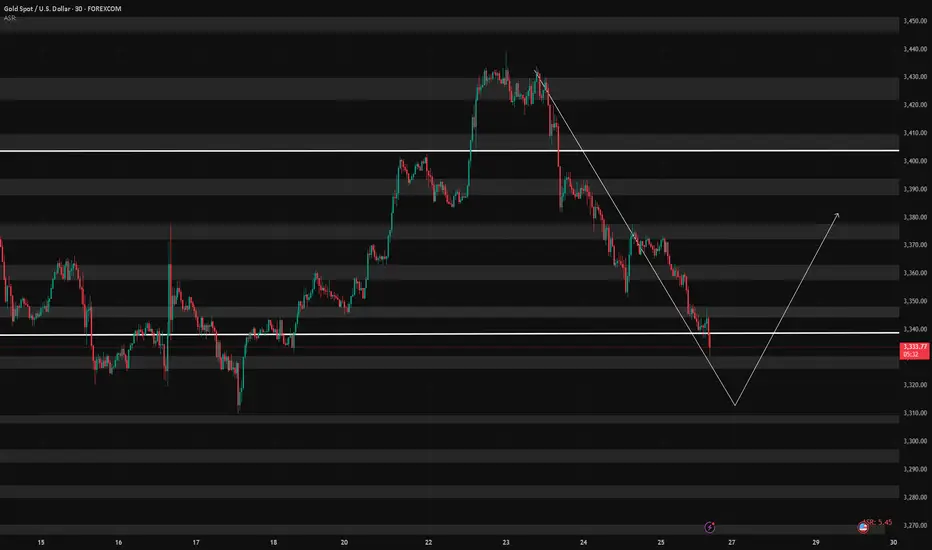
This week, gold rallied to the 3440 level, forming a double-top pattern, and has since entered a phase of consolidation with a downward bias, currently retracing back to the key 3337-332 support area.
While a short-term rebound is possible from the 30-minute chart perspective, the weekly structure is not favorable to the bulls. On the daily chart, price has once again reached the MA60 support, and is currently forming three consecutive bearish candles, which suggests that bearish momentum may continue.
Unless there is significant bullish news next week, the market may remain under pressure. Key levels to monitor:
Upside resistance zones: 3343, 3352, 3358, 3366, 3372, 3378, and 3386–3392
Downside support zones: 3337, 3332, 3323, 3312
If the weekly chart breaks down, watch for: 3300 psychological level and 3260 (weekly MA20)
Additionally, during this week's decline, a price gap has been left between 3395–3398. If the market starts to rebound on the 2-hour chart, there is a chance this gap will be filled. However, this area also serves as strong resistance, and any approach toward it could result in heavy selling pressure. Caution is advised in the event of a sharp rally.
I'm still recovering and unable to monitor the markets for extended periods. Once my health improves, I’ll resume regular updates. In the meantime, feel free to leave any questions, and I’ll do my best to respond. Thanks again for your continued support, and I wish everyone success and strong profits in the market!
Deep Pullback on XAUUSD Gold: What I'm Watching Now🚨 Gold Update & Trade Plan 🚨
Taking a look at Gold (XAUUSD) right now — it's been trending strongly in an uptrend 📈, showing impressive momentum over the past sessions. However, we've recently seen a deep pullback 🔻 that has tapped into a key liquidity pool 💧.
From this level, I'm anticipating a bullish reaction 🔁, and I’m eyeing a potential scalping or intraday opportunity. In the video, we break down:
🔹 Market structure
🔹 Price action analysis
🔹 Trend context
🔹 A complete trade plan
🎯 Entry, stop-loss, and targets are all discussed based on technicals — with precision and discipline.
This is my personal trading plan based on how I read the markets — not financial advice. Trade safe and stay sharp! ⚔️💹

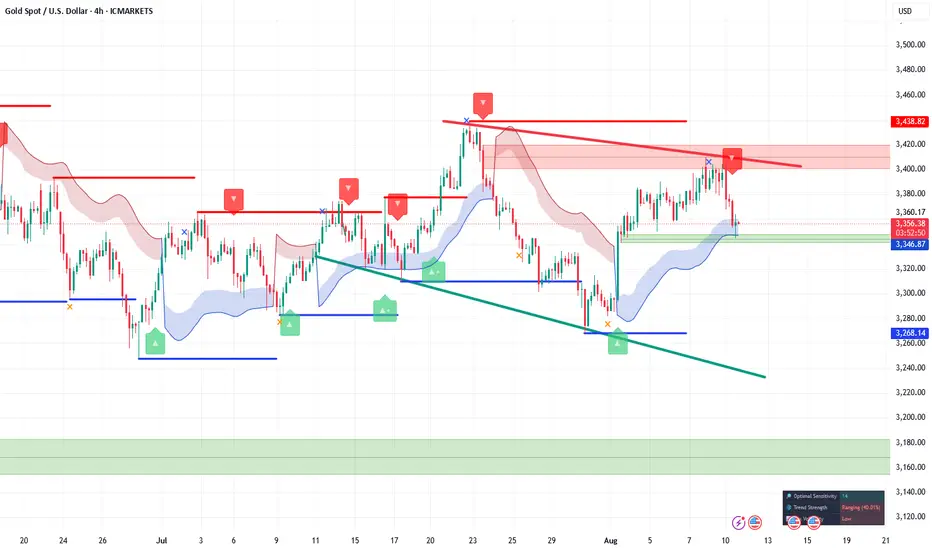
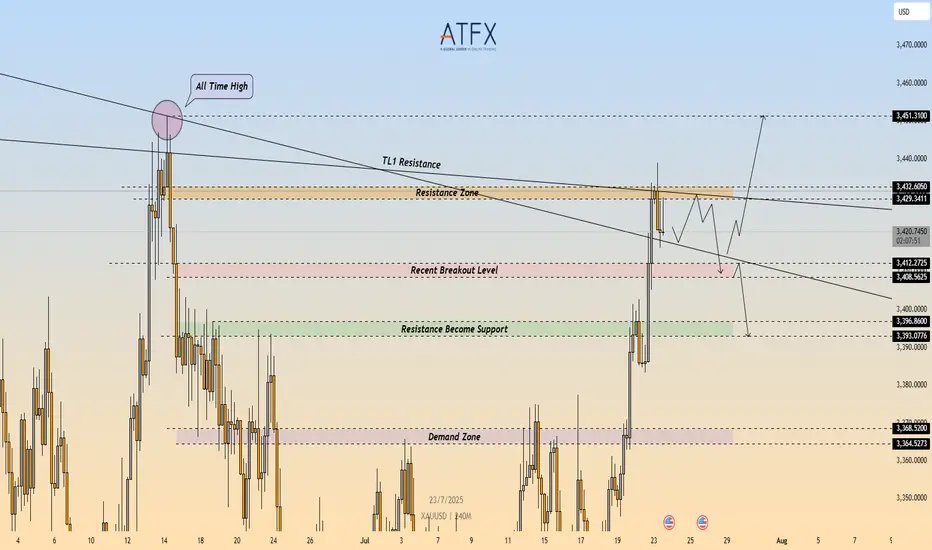
XAU/USD: Bearish Rejection at $3,432 – Short Setup in Play🔴 XAU/USD – Bearish Rejection at Key Resistance Zone ($3,432)
🔍 Technical Outlook
Gold (XAU/USD) failed to break through the $3,429–$3,432 resistance zone, which aligns with a descending trendline (TL1) and prior swing high. The rejection from this confluence zone is reinforcing bearish pressure, with price now carving out lower highs on the 4H timeframe.
A clean break below $3,412 would confirm bearish continuation and open the door toward the $3,400 area, followed by the demand zone at $3,368–$3,365.
🔻 Short Setup
Entry: 3,432
Stop Loss: 3,436
Take Profit 1: 3,412
Take Profit 2: 3,396
R\:R Ratio: ≈ 1 : 6.95
Invalidation: Close above 3,436
📌 Key Levels
Resistance: 3,429 – 3,432
Support 1: 3,412
Support 2: 3,368 – 3,365
Trendline: Long-term descending resistance acting as ceiling
📘 Summary
Gold remains capped beneath a critical resistance cluster. The rejection around $3,432 could trigger a deeper pullback toward $3,396, especially if sellers push price below $3,412. Bearish bias remains valid while price holds under the trendline.
📉 Bias: Bearish
📈 Confirmation Trigger: Break below $3,412
⚠️ Invalidation Level: Above $3,436
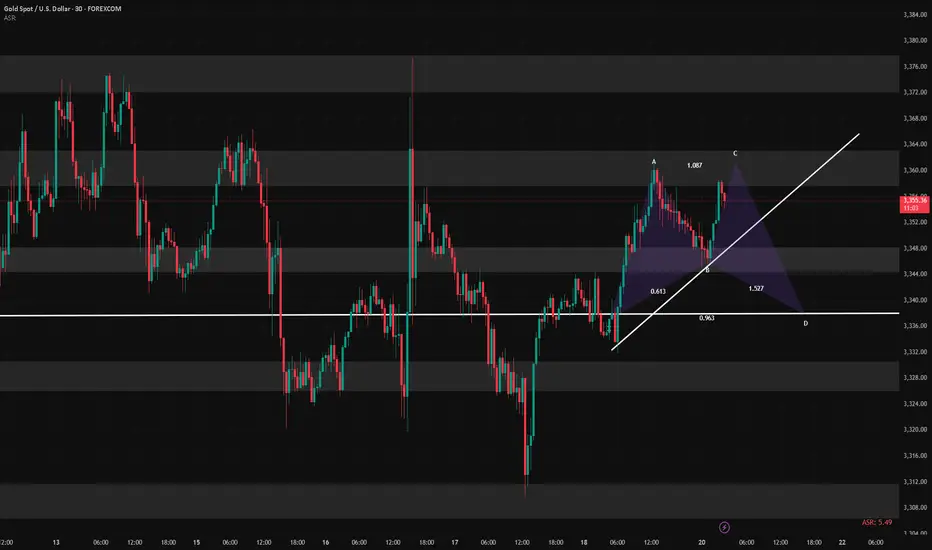
XAUUSD SEEMS TO ESTABLISH NEW BULLISH IMPULSEXAUUSD SEEMS TO ESTABLISH NEW BULLISH IMPULSE
The recovery of the gold market appears to have gained momentum in recent days. This has resulted in the precious metal surpassing what appears to be a triangular pattern.
What is a triangle pattern?
A triangle pattern is a chart pattern with converging trendlines, signaling consolidation before a breakout. Types: Ascending (bullish, flat top, rising bottom), Descending (bearish, flat bottom, declining top), Symmetrical (neutral, both trendlines converge). To trade: Identify the pattern (two touches per trendline), wait for a breakout with volume, enter after confirmation, set stop loss below (long) or above (short) breakout, and target the triangle’s height projected from the breakout.
From here, a break above the June high of 3,450.00 would increase the probability of a further rise toward the record high near 3,500.00. But before that slight decline towards upper border of the symmetrical triangle with further rebound is expected.

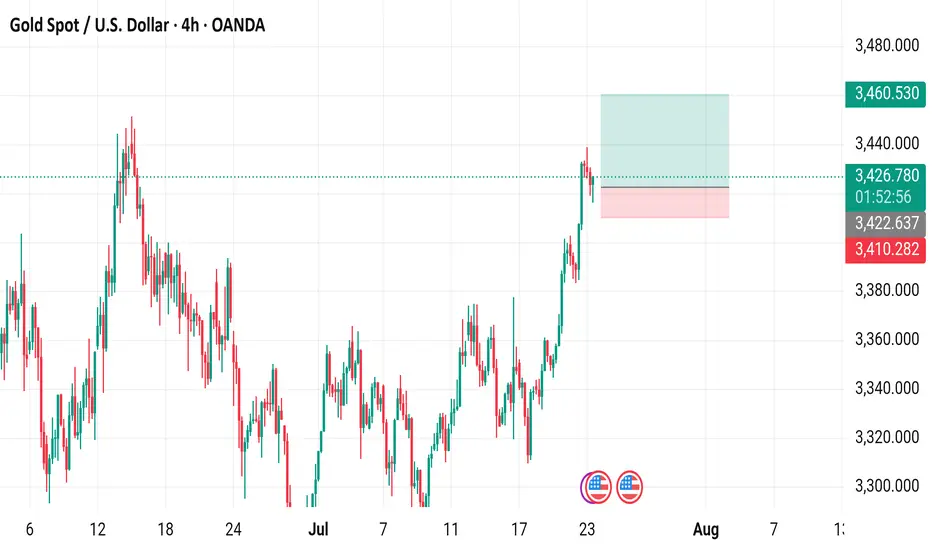
Gold Spot / U.S. Dollar (XAUUSD) - 4 Hour Chart (OANDA)4-hour chart from OANDA displays the price movement of Gold Spot (XAUUSD) from late July to early August 2025. The current price is 3,426.260, with a recent decrease of 5.185 (-0.15%). The chart shows a buy price of 3,426.580 and a sell price of 3,425.950, with a resistance level around 3,460.530 and support near 3,410.282. The data reflects trading activity as of 01:54:22 on July 23, 2025.
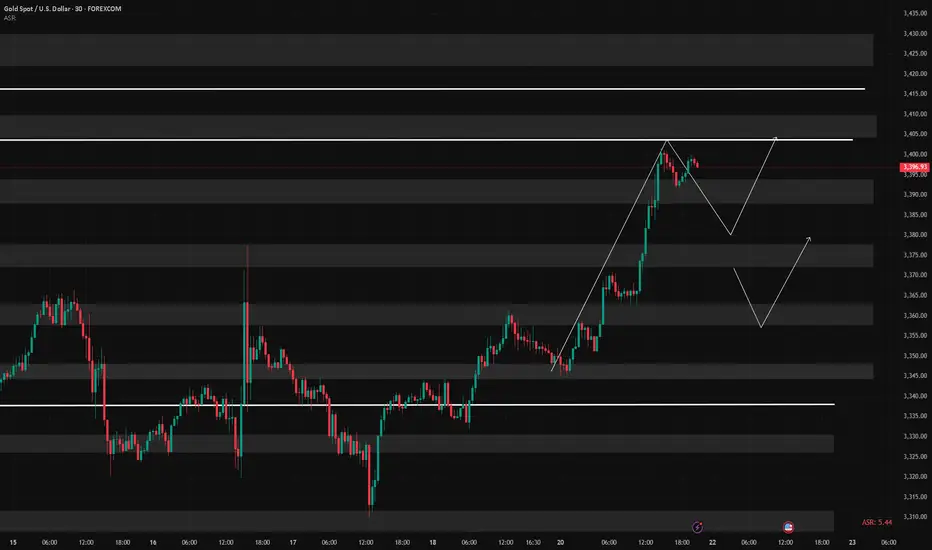
XAUUSD Breakout Structure | Smart Money Bullish Roadmap 🚨 XAUUSD 2H | Smart Money Concept Setup
Price perfectly tapped into demand zone and showed a strong bullish reaction — now forming a clear BOS (Break of Structure).
📍 Key Liquidity Zones:
• Price swept previous lows and is now targeting major liquidity levels marked as “Target Points.”
• Bullish momentum is expected to push price towards 3410 – 3425 range 📈
🔁 Expect possible consolidation before a continuation to upper targets.
💡 Strategy:
Wait for a minor pullback near the 3380–3390 level for confirmation, then ride the momentum to higher targets.
🎯 Target Levels:
1. 3398 ✅
2. 3410 🚀
3. 3425+ (Final Target)
📌 Like, Follow & Save if you caught this early 📊
#XAUUSD #SMC #LiquidityGrab #GoldSetup #TradingViewIdea #SmartMoney #Breakout

July 21: Key Resistance at 3358–3366, Breakout Targets 3378–3388Good morning, everyone!
Last Friday, gold tested the support around 3332 but did not break below it. The price then rebounded to the 3358 zone, where it encountered selling pressure and pulled back. At today's open, the price retraced to the 3343 level, where support held well, prompting another rally back toward 3358.
It’s important to note that since the 3358 resistance was already tested on Friday, some of the selling pressure has likely been absorbed. As a result, there is a higher probability of a breakout today. If a breakout occurs, the next key resistance lies at 3366/3372–3378. In the case of strong bullish momentum, the price may extend further toward the 3386–3392 resistance zone.
However, if the price continues to be capped below 3358–3366, we may see a consolidation or short-term pullback. In this case, watch support at 3348–3343. Should the price successfully break above 3378, then support on pullbacks will shift higher to 3363 and 3358–3352.
🔺 Key Warning: The 3358 resistance zone is technically crucial. If the price repeatedly fails to break through, watch out for a potential double-top pattern on the 30-minute chart, which could signal a near-term bearish reversal.
7/ 22: Focus on Selling at Highs, Key Support at 3378–3372Good morning, everyone!
I’ve unfortunately injured my lower back and will need to rest in bed for a while, so I’ll keep today’s market commentary brief.
Yesterday, gold rallied to test the 3400 level, a key psychological and technical resistance area that naturally triggered notable selling pressure. Given this, chasing long positions at current levels is not recommended.
On the downside, support is seen near 3378. If this level holds, the price may attempt another rebound. On the upside, key resistance levels to watch are:
3407 as the initial resistance
3416–3423 as the stronger resistance zone
For today’s trading strategy, consider focusing on selling into strength near resistance levels. Once the selling pressure is absorbed, there may be an opportunity to re-enter on the long side at lower levels, allowing for better risk management and entry conditions.
Gold (XAU/USD) Technical Outlook — 21 July 20251. Market Overview & Live Price Confirmation
Gold is currently trading around $3,354, with a daily range of approximately $3,345–$3,359. This places it firmly within its broader uptrend, showing resilience amid recent macro uncertainties and consolidating its position above key support zones.
2. Four-Hour Technical Breakdown
Trend & Structure
The 4-hour chart reveals a strong bullish structure, marked by consistent higher highs and lows. A recent Break of Structure occurred near $3,324, reinforcing the upward bias. A minor Change of Character around $3,360–$3,358 reflects a healthy retracement, but the bigger picture remains strong.
Key SMC & ICT Zones
Supply Zone: $3,360–$3,362 — recent peak area likely to attract sellers and sweep above liquidity.
Demand Zone: $3,340–$3,344 — aligns perfectly with the 38.2% Fib from the $3,308–$3,362 swing, forming a prime area to buy from.
Order Block / FVG Zone: $3,336–$3,342 — open imbalance suggesting price may revisit for efficient entry.
Liquidity Context: Order flow patterns indicate stop hunts around established zones — part of classic Smart Money Concepts.
Fibonacci Levels
38.2% retrace at $3,340, offering medium-term confluence support.
Upside projections via Fibonacci:
1.272 extension: $3,378
1.618 extension: $3,389
3. One-Hour Intraday Trading Setups
Aligned with the 4-hour bullish bias, these setups offer scalable, structured entry opportunities.
Strategy Entry Zone Stop-Loss Take-Profit Risk:Reward
Aggressive Long $3,344 $3,338 $3,358 → $3,362 ~2:1
Conservative Long $3,340 $3,330 $3,362 → $3,378 ~2.5:1
Short Opportunity Rejection @ $3,362 $3,368 $3,344 ~2:1
🌟 The Golden Setup
Buy within $3,340–$3,344 (4H demand + Fib zone + FVG)
Stop-Loss: $3,330
Take-Profit 1: $3,362 (range high)
Take-Profit 2: $3,378 (Fib 1.272)
Why It Works: A confluence of structural support, liquidity zones, and retracement levels gives this setup high predictive quality.
4. Analyst Consensus Snapshot
Market commentary from professional analysts shows alignment with dip-buy strategies. Most recognize the $3,340 region as key support and express caution entering $3,360–$3,375 resistance. Weekly forecasts describe tight trading with potential for breakouts or retracements depending on economic data and Fed commentary, but the medium-term trend remains bullish.
5. Summary & Trading Blueprint
Price Range: $3,345–$3,359 (daily); $3,338–$3,378 (targets)
4-Hour Bias: Bullish, with defined demand and supply zones
Golden Trade: Buy $3,340–3,344 → SL $3,330 → TP1 $3,362 / TP2 $3,378
Catalysts to Watch: Federal Reserve speech, tariff developments, USD movements.
6. Final Thoughts
Gold continues to demonstrate bullish resilience, supported by both technical structure and macro tailwinds. The $3,340–3,344 zone offers a clear, high-probability entry confluence, while stop placement and profit targets are well-defined. Profit management around $3,360 ensures disciplined scaling or early exits if risk factors emerge.
By blending price action, Smart Money frameworks, ICT concepts, and Fibonacci confluence—all structured into actionable trade setups—you have a professional-grade playbook ready for deployment.

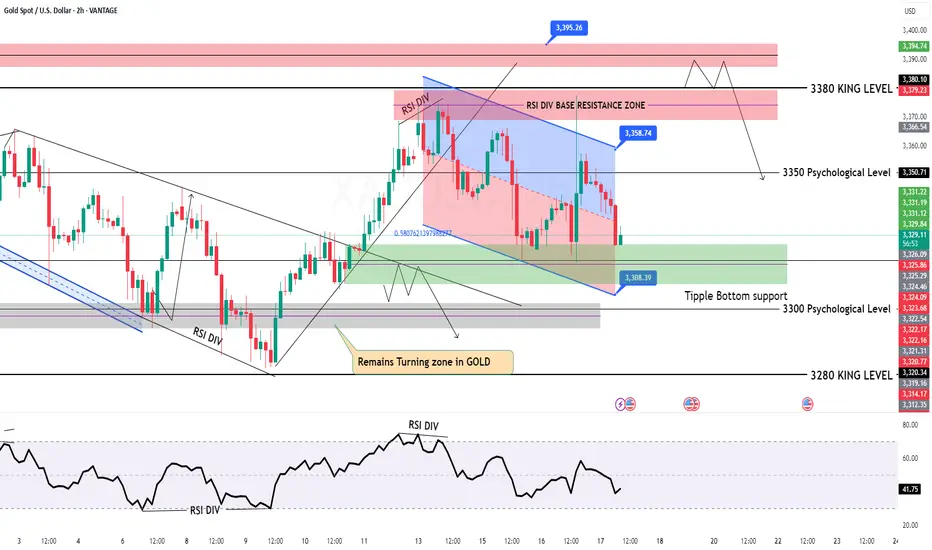
GOLD Intraday Chart Update For 17 July 2025Hello Traders, welcome to new Trading day
Today we have some high impact news of USD, Currently market is still in tight range and we still need breakout of 3300 Psychological for downside clearly
For upside market must need to close above 3380-90 zone for further upwards continuation
currently we are also keep an eyes on WAR Fundamental news
Disclaimer: Forex is Risky
Gold (XAU/USD) Technical Outlook: July 17, 2025🔷 Market Context and Current Price
As of July 17, 2025, gold (XAU/USD) is trading near $3,341, slightly above the week’s midpoint. The metal remains range-bound but shows signs of bullish resilience as it tests key structural support zones. Today’s analysis integrates advanced technical methodologies — including Price Action, Fibonacci tools, ICT and Smart Money Concepts — to present a clear directional bias and actionable trade ideas.
📊 4‑Hour Chart Analysis
1️⃣ Price Structure & Trend
Gold has maintained a sideways-to-upward bias, consolidating between $3,320 (support base) and $3,377 (range resistance). Higher lows since early July reinforce the short-term bullish narrative, though price remains capped by supply in the upper 3,370s.
No decisive Break of Structure (BOS) has yet occurred, keeping price within this range. However, minor bullish BOS signals have appeared near $3,332–$3,334, with a confirmed Change of Character (CHOCH) around $3,320–$3,324, as buyers repeatedly defended this level.
2️⃣ Smart Money Concepts & ICT Insights
Demand Zone / Order Block (OB): $3,332–$3,334. This zone aligns with a recent fair value gap and bullish order block.
Supply Zone / OB: $3,355–$3,359, corresponding to prior inefficiencies and institutional selling.
Liquidity Levels: Sell-side liquidity was swept near $3,320 earlier this week, suggesting smart money accumulation below prior lows.
Fair Value Gap (Imbalance): Present at $3,332–$3,333, partially filled and offering a strong risk-reward for long setups.
3️⃣ Fibonacci Levels
Using the recent swing low ($3,320) and swing high ($3,377), Fibonacci retracements show:
38.2%: ~$3,342 — currently being tested.
50%: ~$3,348 — an interim bullish target.
Fibonacci extensions project potential upside toward $3,401 if momentum strengthens beyond the range top.
4️⃣ Key Levels Summary (4H)
Zone Level
Demand / Buy Zone $3,332–$3,334
Structural Support $3,320
Interim Pivot $3,340–$3,342
Supply / Sell Zone $3,355–$3,359
Range Ceiling $3,375–$3,377
🔷 Directional Bias and Strategy
The 4-hour structure remains neutral-to-bullish, favoring upside so long as the $3,332–$3,334 demand zone holds. A confirmed BOS above $3,342–$3,344 could accelerate bullish momentum toward $3,355–$3,360 and even $3,375. Conversely, a breakdown below $3,332 risks revisiting $3,320 and potentially $3,300.
⏳ 1‑Hour Chart – Intraday Trade Setups
The 1-hour timeframe reveals tactical opportunities aligned with the broader bias:
Setup Direction Entry Stop Loss Take Profit
Setup A – Smart Money Long Long $3,334 $3,329 $3,348 / $3,355
Setup B – Breakout Long Long $3,344 (after breakout) $3,340 $3,355 / $3,375
Setup C – Range Short Short $3,355–$3,359 $3,362 $3,340 / $3,332
🏆 The Golden Setup
Setup A – Smart Money Long offers the highest statistical edge:
Entry: $3,334 (at demand OB / FVG)
Stop Loss: $3,329 (below structure)
Take Profits:
TP1: $3,348 (pivot)
TP2: $3,355 (supply zone)
R:R Ratio: ~2.8:1
This setup benefits from multi-timeframe confluences: demand zone, fair value gap, bullish CHOCH, and proximity to BOS, making it a high‑conviction trade.
🔷 External Consensus Check
An alignment scan of professional analyst views shows strong consensus:
Buy interest remains concentrated around $3,332–$3,335.
Profit-taking and caution advised as price approaches $3,355–$3,377.
No notable divergence in professional outlook — most remain cautiously bullish above $3,332.
📜 Summary Report
✅ Bias: Neutral-to-bullish above $3,332; downside risk below.
✅ Key Levels: $3,332–$3,334 (buy zone), $3,355–$3,359 (sell zone), $3,375–$3,377 (range ceiling).
✅ Top Trade: Long from $3,334 with stops under $3,329 and targets at $3,348/$3,355.
✅ Alternate Trades: Breakout long above $3,344 or short from supply near $3,355.
✅ Confidence Zones: Buyers dominate above $3,332; sellers reappear above $3,355.
Conclusion
Gold remains in a well‑defined range, with smart money likely accumulating near the lower boundary at $3,332. With structural supports intact and demand zones respected, the path of least resistance favors cautious upside toward $3,355 and possibly $3,375. Intraday traders are advised to focus on precise execution within the outlined confidence zones, maintaining discipline around stops and targets.
The current market structure rewards patience and alignment with institutional footprints — positioning ahead of breakout confirmation, while respecting range extremes.
