Here's a weekly buy-side analysis🟢 Bias: Bullish (Buy)
Gold remains in a long-term uptrend, with fundamental and technical factors supporting continued upside.
50 & 100 EMA: Price is well above both EMAs, confirming bullish momentum.
RSI: Around 60–70 on the weekly; no bearish divergence yet.
MACD: Histogram ticking upward with bullish crossover in play.⚠️ Risk Factors
Sudden USD strength due to surprise Fed hawkishness.
Strong U.S. labor or inflation data that pushes bond yields higher.
Gold profit-taking near ATH could cause sharp but temporary pullbacks.
Xauusd4h

5/30 Gold Analysis and Trading SignalsGood morning everyone!
Yesterday, we successfully executed short at 3290 and long at 3250, and also entered the 3316–3328 short zone near the close. All signals were hit, and profits were solid ✅.
📉 Technical Outlook:
The 1-hour chart remains in a clear bearish trend, indicating that this pullback is not yet complete.
Initial support at 3296 is very likely to break
Focus shifts to 3278 support, though it appears technically weak
If price hits 3278, a minor bounce is expected, but it's likely just a retracement, not a reversal
🗞 Fundamental Watch:
The U.S. Consumer Confidence Index will be released during the U.S. session today.
Market reaction is expected to be similar to yesterday’s initial jobless claims — possibly triggering short-term moves, but not changing the broader trend.
📈 Trade Plan for Today:
📉 Sell in the 3316–3328 zone (key resistance)
📈 Buy in the 3238–3221 zone (key support area)
🔁 Scalp/flexible trading zones:
3303 / 3288 / 3276 / 3265 / 3252 / 3238
Stick to proper risk management, and stay alert during U.S. data releases.
Trade with the trend and close the week strong!
Additionally, on the 30-minute chart, gold appears to be forming a potential inverse head and shoulders pattern. If this pattern completes and breaks the neckline successfully, the price may surge toward the 3336–3352 area, or even up to 3360.
For those considering short positions, it’s crucial to control position size and avoid entering too early. Try to wait for price action to reach higher resistance levels before making a move. Don’t worry about missing a perfect entry — even if one trade is missed, it won’t affect your overall profitability for the week.
The market always offers opportunities. Stay calm, stick to your strategy, and remember: consistency and patience lead to long-term success.

Gold Price Action Update – Smart Dip Buy Pays Off!Yesterday, gold dipped to around 3290, followed by a minor rebound.
Today, as expected, it broke down through the 3280 level decisively—just as we discussed:
🔻 A break below 3280 likely means a gap fill toward 3259.
✅ For those who followed the plan and went long below 3266, the trade worked beautifully—
Gold dropped to a low of 3245, effectively filling the gap, and has since rebounded back to the 3280 area.
📈 What’s next?
Now that the gap is filled, gold is likely to retest the $3300 zone in the short term.
With price currently around 3280, there is still room to the upside.
➡️ If you're holding long positions, you can consider holding a bit longer for potential further gains.
🚨 BUT—this was only a single bottom test.
That means there's still a chance of a second dip before the trend fully reverses. So:
🛡 Risk management remains crucial.
If you're okay with some profit pullback, it's fine to stay in.
If not, consider securing partial profits and setting trailing stops.
🎯 Key levels to watch:
🔼 3300 – Main resistance zone; focus on whether it breaks or rejects;
🔽 3276–3263 – Support range on any pullback; good zones to watch for fresh entries if support holds.
📌 Trading Strategy Outlook:
For now, continue to buy on dips as long as support holds, and monitor 3300 resistance closely.
If price fails to break above, we may see a pullback—but as always, with proper planning, we stay profitable.

Gold drops to support then rebounds; 3325-3330 key bull-bear levAnalysis of Today's Gold Volatility 🔥
The ruling on Trump's tariff overreach and the Fed's cautious stance on rate cuts have delivered a double blow 💥, instantly "freezing" market risk aversion 🧊! Gold prices plunged to a low of 3245 intraday, with the 3245-3250 zone acting as a "safety air cushion" 🛡️ that firmly halted the decline. The price is now rebounding to test resistance near yesterday's high, where the 3325-3330 level has become a "life-or-death line" ⚔️ for bulls and bears, with a showdown imminent!
Trading Strategies (Emoji Signal Guide 📌)
1. Short on Rebound 🚀➡️📉
Entry: Lightly short in the 3325-3330 range (Bearish "sniper zone" 🎯)
Stop Loss: 3335 (Break above resistance? Run 🏃♂️!)
Targets:
First target: 3280 (Bearish "first charging station" 🔋)
Second target: 3250 (Test support validity 🔍)
2. Long at Support 📉➡️📈
Entry: Lightly long after stabilizing above 3250 (Bullish "rally call" 📢)
Stop Loss: 3240 (Break below support? Retreat fast 🚑!)
Targets:
First target: 3280 (Rebound "mini-peak" ⛰️)
Second target: 3300 (Challenge "mid-fortress" 🏰)
Risk Warning ⚠️: Beware of volatile swings from Fed speeches! Exit immediately if prices break above 3330 or below 3240. Control positions and avoid emotional trading 🚗💨!
Professional trading strategies are pushed daily 📊
Lock in precise signals amid market fluctuations 🚀
Confused about market trends? Stuck in strategy bottlenecks?
Real-time strategies serve as your "trading compass" 🌐
From trend analysis to entry/exit points, dissect market logic comprehensively
Refer now 📲
Help you move steadily forward in investments ✨
👇👇👇

5/29 Gold Analysis and Trading SignalsGood morning everyone!
Yesterday, gold rose first and then declined. Our long positions targeting 3318–3326 were completed successfully, and we timely shifted to short positions, resulting in another round of solid profits.
📉 Technical Outlook:
Gold remains in a bearish trend, and is now very close to the 3275 support level. Based on the current price structure, a break below this level is highly probable.
If $3275 is breached, focus on key support at 3258–3238
Resistance levels to watch: 3298–3318
The daily (1D) chart is currently in an indicator correction phase, so today's trading bias is selling from higher levels
🗞 News Focus:
Watch for U.S. initial jobless claims data today. It may offer short-term support for gold, but is unlikely to reverse the broader bearish trend.
📈 Today’s Trade Plan:
📉 Sell in the 3316–3328 zone (resistance zone)
📈 Buy in the 3245–3232 zone (key support area)
🔁 Scalp/flexible trading levels:
3303 / 3288 / 3276 / 3258 / 3247
Stay adaptive and combine news with price action at key levels for best results.
Wishing everyone a successful and profitable trading day!

XAUUSD Idea: Structure, Fibonacci Setup & S&P 500 Correlation📉 XAUUSD Trade Outlook 🧠🔍
Currently analyzing Gold (XAUUSD), and things are getting interesting. On the daily timeframe, we’ve seen a clear bearish break of market structure, and this shift is also evident on the 4-hour chart. 🕰️📉
I’m watching closely for a bullish retracement into my key Fibonacci 61.8% level, where I’ll be looking for confirmation of a bearish structural break to initiate a short position. 🎯🔽
When we compare this setup to the US500 (S&P 500), it becomes even more compelling. The indices have rallied hard and appear overextended — a correction seems likely. 📊🧾
If we do get that pullback in the indices, gold may rally temporarily, but my overall bias remains bearish. If the indices resume their uptrend after a pullback, I expect gold to weaken further, aligning with my current short-side outlook. ⚠️📉
🛑 This is not financial advice. Always do your own analysis and manage risk according to your trading plan.
💬 What are your thoughts on gold right now? Are you leaning bullish or bearish? Let me know in the comments! 👇

Gold Bull vs. Bear Battle: Trading Guide Between Support at 32804-hour chart bullish trend, support at 3280-3285, resistance at 3360 ⭐️.
Long Positions:
Go long on pullback to 3280-3290 📊🎯.
Stop loss: 3270
Targets: 3320 → 3330
Add positions if price holds above 3330 🌟.
Targets: 3350 → 3360
Short Positions:
Short on rally to 3350-3360 ⚠️📉.
Stop loss: 3370
Targets: 3330 → 3320
Risk Control:
Always use stop loss and take profits in batches ✨.
Professional trading strategies are pushed daily 📊
Lock in precise signals amid market fluctuations 🚀
Confused about market trends? Stuck in strategy bottlenecks?
Real-time strategies serve as your "trading compass" 🌐
From trend analysis to entry/exit points, dissect market logic comprehensively
Refer now 📲
Help you move steadily forward in investments ✨
👇👇👇

Gold Bull vs. Bear Battle: Trading Guide Between Support at 3280Bullish on the 4-hour chart, support at 3280-3285, resistance at 3365 ⭐️.
Long Positions:
Go long on pullback to 3280-3290 📊🎯.
Stop loss: 3270
Targets: 3320 → 3330
Add positions if price holds above 3320 🌟.
Targets: 3355 → 3365
Short Positions:
Short on rally to 3350-3360 ⚠️📉
Stop loss: 3370
Targets: 3320 → 3330
Risk Control:
Always use stop loss and take profits in batches ✨.
Gold Trading Strategies
buy@3280-3290
tp:3320-3330
sell@3350-3360
tp:3320-3330
Professional trading strategies are pushed daily 📊
Lock in precise signals amid market fluctuations 🚀
Confused about market trends? Stuck in strategy bottlenecks?
Real-time strategies serve as your "trading compass" 🌐
From trend analysis to entry/exit points, dissect market logic comprehensively
Refer now 📲
Help you move steadily forward in investments ✨
👇👇👇

Gold Trading Strategy for the 27thOn the 4-hour chart today, the bullish trend of gold remains intact ⭐️✨📈 ⚠️📉
The current price is facing resistance at 3365 near the previous high. Due to the excessive release of early bullish momentum, a period of adjustment is usually required 📉
However, with further news-driven stimuli this week, gold may still surge sharply 🚀
The key lies in the morning session's trend, so timing is crucial when judging the strength of bulls and bears ⏰
It is expected that gold will continue the pattern of oscillating upward movement, and pullback opportunities can be captured 📈
Resistance is at 3365, and support is at the 3320 level 🔍
Long Position Strategy:
If the gold price retracts to the 3320-3325 range, consider opening a long position 📊 Set the stop-loss at 3317, with targets at 3340-3350 🎯
If the price holds above 3320, try opening a long position 🌟 The initial target is 3345, and if 3345 is successfully broken through, further targets will be 3350-3360 ⚡️
Short Position Strategy:
When the price rises to the 3360-3365 range, try opening a short position ⚠️ Set the stop-loss at 3370, with targets at 3340-3330 📉
Gold Trading Strategies
sell@3360-3365
tp:3330-3340
buy@3320-3325
tp:3350-3360
Professional trading strategies are pushed daily 📊
Lock in precise signals amid market fluctuations 🚀
Confused about market trends? Stuck in strategy bottlenecks?
Real-time strategies serve as your "trading compass" 🌐
From trend analysis to entry/exit points, dissect market logic comprehensively
Refer now 📲
Help you move steadily forward in investments ✨
👇👇👇

5/26 Gold Trading SignalsGood afternoon everyone!
I just returned from a weekend trip and apologize for the late update today — thank you all for your patience and continued support!
Gold has shown mild downward movement in a one-sided consolidation pattern today. This is a technical pullback after reaching a key resistance zone, reflecting selling pressure at higher levels. Today is Memorial Day in the U.S., which explains the low volatility and reduced trading volume.
🔎 Technical Outlook:
Once gold reached around 3360, it entered a significant resistance zone. If bulls intend to maintain the current uptrend, then the support around 3272 will be a critical level during this pullback. Before that, we should also keep an eye on 3322, 3318, and 3298.
On the 2-hour chart, a bearish divergence has formed, which needs to be resolved, possibly through sideways consolidation or a further pullback.
🗞 Fundamental Outlook:
The news is relatively quiet today, but important economic data and speeches will begin tomorrow, which may trigger larger market moves.
📈 Today’s Trading Plan:
📉 Sell in the 3352–3368 zone (resistance area)
📈 Buy in the 3292–3272 zone (support zone)
🔁 Flexible intraday levels to watch:
3348 / 3332 / 3323 / 3312 / 3305 / 3296
Stay flexible and manage risk accordingly. If you have any questions or want to discuss your trading strategy, feel free to reach out. Wishing everyone a smooth and profitable session!

#XAUUSD: +2000 Pips Correction US-China Trade Deal ConfirmedGold has experienced a significant decline in recent days, primarily due to fundamental market factors that have caused its price to fall from 3430 to 3209, resulting in a loss of approximately 2210 pips. Consequently, we recommend that you consider selling Gold if it aligns with your analysis and assessment. It is imperative that you implement strict risk management measures while trading Gold.
It is important to note that this analysis does not guarantee a price decline or that the market will behave as described. Therefore, we strongly advise you to conduct thorough trade planning before making any trading decisions.
We extend our sincere gratitude for your unwavering support over the years.
Our primary objective is to assist you in making well-informed decisions. Therefore, we encourage you to contact us if you have any inquiries or require further information.
Additionally, we would be delighted to receive your insights on which cryptocurrency pair you would like to explore next. Please do not hesitate to share your preferences.
Best regards,
Team Setupsfx_

Gold prices remain strong as tariffs heat up again
Hey everyone, let's comment on the gold price next week from May 26, 2025 to May 30, 2025,
📌 Driving Events
Gold prices resumed their upward momentum on Friday, surging nearly 2% on the day and up more than 5% for the week as the dollar weakened amid renewed trade tensions. Gold prices rebounded from an intraday low of $3,287 to $3,359 as escalating rhetoric from Washington fueled investor demand for safe-haven assets.
U.S. President Donald Trump has intensified the trade standoff with the European Union, declaring that negotiations are "going nowhere" and threatening to impose a 50% tariff on EU imports from June 1. For months, Fed policymakers have made it clear that they want more clarity on the response from fiscal and trade policies and the economy before taking further action on interest rates. Over the past month, this cautious stance has prompted traders to withdraw their bets on a rate cut in the June meeting, and the market now expects the policy pause to continue until the July meeting. However, futures market positions show that the probability of a rate cut before the end of September is still slightly above 50%. This is essentially a bet that the situation will become clearer in the next four months: either slowing inflation paves the way for policy easing, or the economic deterioration forces the Fed to increase stimulus.
📊Comment Analysis
Tariff news has begun to heat up again, and the United States and the rest of the world have not yet reached a consensus on negotiations, and gold prices have benefited from this rise. The big time frame shows that the price is breaking out and continuing the upward trend
Technical:
Based on the resistance and support levels of gold on the 4-hour chart, Labaron has identified the following important key areas:
Resistance: $3412, $3436
Support: $3315, $3280, $3245
⭐️ Note: Labaron hopes that traders can properly manage their funds
- Choose a lot size that matches your funds
- Profit is 4-7% of the capital account
- Stop loss is 1-3% of the capital account

XAUUSD Market OutlookMy current bias on XAUUSD remains bullish, as we are targeting the lower high (LH) around the 3,438 level. However, the market is currently in a pullback phase within the LH & LL. Price has entered an OTA level within a Daily Fair Value Gap (FVG), ranging between 3,370 and 3,333. This presents a potential opportunity for short setups as we move towards the 3,251 level.
On the 4-hour timeframe, there's a valid FVG Breaker near our Fibonacci-based OTA level, aligning closely with the 3,251 support zone. This is a key area to watch for bullish confirmations. Any long positions should ideally be considered from this zone.
Important Note:
When trading gold, patience and discipline are essential. Only act on clear, confirmed setups that align with your strategy. Quality over quantity always wins in the long run.

Gold breaks upward, space opens up
📌 Driving events
Internationally, US media reported that US intelligence agencies found that Israel was preparing to attack Iran's nuclear facilities, and gold and crude oil both soared in the short term.
Recently, the Iran nuclear talks and the Russia-Ukraine talks were carried out simultaneously, and the market risk aversion sentiment fluctuated greatly
📊Comment analysis
While the medium and long-term outlook continues to be bullish on gold's performance this year, short-term operations are mainly based on news. Pay attention to light positions and maintain flexibility in short-term operations.
💰Strategy Package
🔥Buy Gold Zone: 3310-3315 SL 3307 Scalping
TP1: $3318
TP2: $3325
TP3: $3330
🔥Sell Gold Zone: 3354-3356 SL 3361
TP1: $3345
TP2: $3332
TP3: $3320
🔥Buy Gold Zone: $3252 - $3250 SL $3245
TP1: $3260
TP2: $3270
TP3: $3280
⭐️ Note: Labaron hopes that traders can properly manage their funds
- Choose the number of lots that matches your funds
- Profit is 4-7% of the fund account
- Stop loss is 1-3% of the fund account

Will gold continue to rise to 3280-3330 today?Hello everyone. Let's discuss the trend of gold this week. Today, Moody's downgraded the US sovereign credit rating from AAA to Aa1 on the grounds of "debt surge and fiscal out of control", ending the US's last "top credit" title among the three major rating agencies.
Due to this influence, gold opened sharply higher today, Monday, and the highest so far is around 3250.
Here is the 1-hour chart:
If gold can continue to rush above 3250 in the short term, then we will see 3280-3300 later.
The high point of 3250 may be broken at any time.
For now, I think that as long as gold is above 3200 today, gold will continue to rise.
So, if you do it in the short term, you can buy in the 3200-3220 range, with 3200 below as defense, and as long as the upper target stands firm at 3250, you can continue to see the 3280-3300-3330 range.

5/20 Gold Trading SignalsGood afternoon, everyone!
Last Friday and yesterday, gold did not reach our primary buy or sell zones, instead moving within a narrow range. We captured two trades, gaining about $32 in total movement, resulting in moderate but stable profits.
After opening today, the price pulled back toward the 3200 area, which holds technical support. However, resistance remains dense above, especially between 3226 and 3243. For bulls to break through, stronger momentum and volume will be required.
On the news front, there are no major economic events or key speeches scheduled today, so technical trading will dominate.
Currently, gold continues to consolidate. If intraday volatility remains limited, traders can look to buy low and sell high within the 3243–3189 range. Watch for resistance around 3226 and support at 3198 as key technical levels.
📌 Trading Strategy for Today:
🟢 Buy Zone: 3189 – 3168 (Near support, suitable for bottom fishing)
🔴 Sell Zone: 3267 – 3288 (Close to resistance, good for shorting)
🔄 Scalping/Flexible Zones:
▫️3198-3218-3226-3238-3247-3255
📌 Note: Maintain proper position sizing, set clear take-profit/stop-loss levels, and stay flexible. If there's unexpected news or a breakout during the U.S. session, strategies will be adjusted accordingly.

Gold fell below 3,200 today?
📌 Driving Events
In early Asian trading on Tuesday, gold prices (XAU/USD) fell slightly to around $3,230, affected by a slight rebound in the US dollar (USD). However, continued concerns about the health of the US economy - especially after Moody's recent credit rating downgrade - may help limit further downside for precious metals. The rebound in the US dollar has curbed the upward momentum of dollar-denominated assets such as gold. Nevertheless, heightened economic uncertainty is still supporting safe-haven demand. Moody's downgraded the US sovereign rating from "Aaa" to "Aa1" on Friday, citing its rising debt levels and interest payments that have exceeded other similarly rated countries. These developments have kept risk sentiment fragile and provided potential support for gold prices.
📊Comment Analysis
Accumulating along the upper and lower trend lines, the gold price will break out and require more liquidity than the downward trend
💰Strategy Package
🔥Sell Gold Zone: 3224-3226 SL 3230 Scalping
TP1: $3215
TP2: $3208
TP3: $3200
🔥Sell Gold Zone: 3276-3278 SL 3283 Scalping
TP1: $3260
TP2: $3250
TP3: $3240
🔥Buy Gold Zone: $3152 - $3150 SL $3145
TP1: $3165
TP2: $3180
TP3: $3195
⭐️ Note: Labaron hopes that traders can properly manage their funds
- Choose the number of lots that matches your funds
- Profit is 4-7% of the capital account
- Stop loss is 1-3% of the capital account

Will gold fall to 3180-3158?Hello everyone. Let's discuss the trend of gold this week. If you have a different opinion, you can express your different opinions in the comment area. Yesterday, Monday, retail traders made a record bottom-fishing in US stocks, reversing the 1% drop in the S&P 500 index caused by Moody's downgrading the US credit rating last weekend.
Yesterday, Monday, gold opened at a high point near 3250, but after the US stock market opened, it basically maintained a downward trend.
From the current 1-hour chart, gold has been fluctuating above the 1-hour chart range yesterday, Monday, but there has been a change today. It has continuously fallen below the hourly chart range support position at the opening.
Therefore, from the current point of view, gold is likely to retreat downward today, and the 3200 mark is currently difficult to hold.
Therefore, we must be alert to the possibility of a retracement today. As for the operation, you can rely on the 3220-3225 range to sell, and look at the target to 3180-3158.

The market trend is highly consistent with the chart analysisGold opened with a gap up today, returning to the decline starting point near 3,252 last Friday before falling again. The short-term trend has entered a repeated oscillation, but the key level of 3,200 has not been broken.👉👉👉
On Monday, the international gold price rebounded by more than 1%, boosted by a weaker U.S. dollar and increased safe-haven demand. Gold first fell to the 3,206 level before recovering to the 3,250 level, reversing the early session decline. Gold has been under pressure in recent weeks as markets gradually digest stagflation expectations and reprice rate-cut expectations. The market now expects the Federal Reserve to cut rates by about 58 basis points by the end of the year, compared with the peak expectation of 120 basis points during the panic in April.
From the analysis of the 4-hour chart, the lower support continues to focus on the vicinity of 3170-75. The primary support level is the 3150 threshold, and the important resistance to pay attention to is 3270-3280. Overall, within this range, the main tone of participating in a cycle of selling at high levels and buying at low levels remains unchanged. At intermediate positions, it is advisable to observe more, act less, and be cautious about chasing orders. Be patient and wait for entry at key points.
XAUUSD trading strategy
buy @ 3215-3220
sl 3195
tp 3235-3240
If you think the analysis helpful, you can give a thumbs-up to show your support. If you have different opinions, you can leave your thoughts in the comments. Thank you for reading!👉👉👉

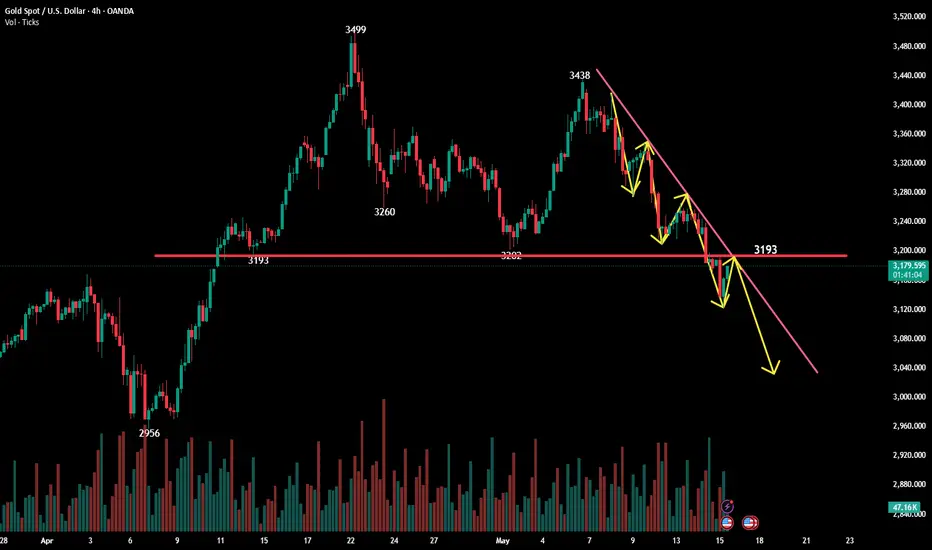
Gold fell sharply and rebounded to continue shorting!Technical analysis of gold: After stabilizing at 3222 yesterday, the rebound was weak and stopped at 3244. After the European session fluctuated, it fell below the 3200 integer mark and a diving market appeared. The lowest intraday price fell to 3168 US dollars. This means that the support of 3200 has failed, and the price of the disk has increased its retracement. The saturated and sinister closing of the daily line means that there is still room for continuation during the day! After gold fell below 3200 this week, the current trend is as shown in the figure. The end of this wave is tentatively set at around 2950. There may be a rebound during the period, but it is only a rebound. After the news fades, it is a rebound in the analysis after the 9th of this month. It emphasizes that the gold price of 3500 is a top to look at the retracement, and also gives a short-selling strategy and a staged support position below. Now that the support level has been broken one after another, we can continue to look at the target according to the trend.
Now let's make a brief analysis of the hourly chart. Gold prices must be repaired after a sharp drop. One is to adjust and repair by shocks, and the other is to rebound and repair. Under this extreme downward trend, gold does not have the conditions to rebound, so I think the rebound here at 3120 is just caused by some short orders choosing to sell at a profit, so the market will continue to fall. Now the upper side mainly focuses on two positions. The first is the previous low point of 3168 during the decline, and the other is the starting point of the early trading wave near 3192. If the rebound does not exceed these two positions, we can continue to see gold testing or even breaking the just low point of 3120. The lower ladder support focuses on 3088. On the whole, today's short-term operation strategy for gold is to short on rebounds and to buy on pullbacks. The upper short-term focus is on the 3170-3192 line of resistance, and the lower short-term focus is on the 3120-3100 line of support. Friends must keep up with the rhythm.
Short position strategy:
Strategy 1: Short 20% of the position in batches near 3168-3172 in the early trading of gold, stop loss 10 points, target near 3140-3120, and look at 3100 line if it breaks;
Long position strategy:
Strategy 2: Buy 20% of the position in batches near 3100-3105 when gold falls back, stop loss 10 points, target near 3130-3150, and look at 3170 line if it breaks;
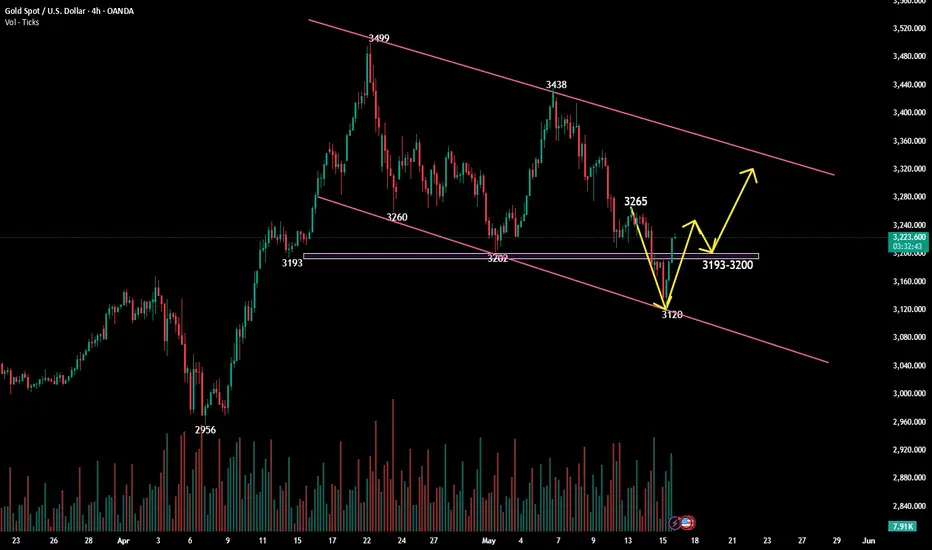
Gold's V-shaped reversal restarts its upward trend!Technical analysis of gold: Gold has a perfect V-shaped reversal today. It opened at 3177 and fell unilaterally in the Asian session. After touching 3120, it rose slowly. As of the time of writing, it has completely recovered its decline and is currently trading around 3220. I have analyzed the European session. After the gold price broke through the extreme drop of 3200, it needs to be repaired, but it has taken another rebound correction. The analysis also gave attention to 3198 to 3202 to continue to be bearish. With the slow rise and break, the bearish view is invalid. Now make a new analysis.
From a technical point of view, gold is now back above 3200, and the daily line is a big positive. It is undoubtedly absolutely strong. The key point is the gains and losses of 3200. If the retracement does not exceed 3200, then gold is extremely strong. On Friday, we will continue to see the daily line closing positive rise, but if the retracement is below 3200, the daily line cycle may close again, and there will be a continuous rebound to 3235 and 3260. Therefore, the key point today is to pay attention to the gains and losses of 3200.
The performance of the 4-hour cycle may now bottom out in the medium term. After the decline and rebound, the 4-hour mid-term Bollinger opening is temporarily strong, but if the US market rebounds continuously and stands firm at 3200, there will be a continuous positive pattern at the bottom, breaking the 5-day and 10-day moving averages, then there is a great possibility that it will go to 3235. Therefore, gold in the late trading should not be inertially bearish because of the decline on Wednesday. Even if it is bearish, it is necessary to observe the gains and losses of 3200. As for trading, first pay attention to 3200 below and try to buy, and see if 3230 breaks and 3250 breaks.
On the whole, today's short-term operation of gold suggests that callbacks should be the main focus, and rebound shorts should be supplemented. The top short-term focus is on the first-line resistance of 3250-365, and the bottom short-term focus is on the first-line support of 3193-3200. All friends must keep up with the rhythm.
Gold intraday trading strategyFrom the 4-hour line analysis, today's lower support continues to focus on around 3170-75, strong support is at the 3150 mark, and upper pressure is around 3253-60. Relying on this range as a whole, the main tone of high-altitude and low-multiple cycles remains unchanged. In the middle position, watch more and do less, be cautious in chasing orders, and wait patiently for key points to enter the market.
Gold operation strategy:
1. If gold falls back to 3170-75 and does not break, hold a light long position; if it falls back to 3150-55, add a long position; stop loss at 3144; target at 3226-3230; continue to hold if it breaks;
2. If gold rebounds to 3240-45 and does not break, hold a light short position; if it rebounds to 3253-60, add a short position; stop loss at 3266; target at 3275-80; continue to hold if it breaks;

Gold Market Analysis for Next WeekLast Friday's chart analysis was highly consistent with the market trend, and satisfactory results were achieved in trading.👉👉👉
Based on the 4-hour trend analysis, for the opening of gold on Monday, we will first focus on the short-term resistance at the 3,224-3,230 level, and the key resistance at the 3,253-3,260 level. Below, we will pay attention to the short-term support at the 3,170-3,175 level. The operational suggestion is to focus on shorting on rebounds.
XAUUSD trading strategy
sell @ 3230 - 3240
sl 3260
tp 3215 - 3220
If you think the analysis helpful, you can give a thumbs-up to show your support. If you have different opinions, you can leave your thoughts in the comments. Thank you for reading!👉👉👉
