ElDoradoFx – GOLD ANALYSIS (12/11/2025, ASIA SESSION)Gold opens the Asia session trading around $4,125–$4,127, after a measured pullback from the $4,148 resistance seen during the US session. Price action remains inside a controlled consolidation phase, respecting both trendline support and EMA structure. The broader bullish bias remains valid as long as the market holds above $4,115–$4,098.
⸻
1️⃣ Market Overview
Gold continues its overall uptrend from last week’s low near $4,000, building a firm bullish structure through higher highs and higher lows. The short-term pullback is corrective and part of a healthy retracement within the broader rally. Market participants are positioning ahead of US CPI, with volatility expected to remain contained during the early Asia hours.
⸻
2️⃣ Technical Breakdown (D1, H1, 15M–5M)
• D1: Structure remains bullish above the 50EMA, confirming buyers’ dominance after multiple rejections from $4,013. RSI stabilizing near 60 suggests momentum preservation.
• H1: Price is forming a local range between $4,115 (support) and $4,148 (resistance). 20EMA > 50EMA alignment continues to signal short-term bullish control.
• 15M–5M: Intraday retracement channels are visible with BOS → CHoCH → BOS sequence forming. Expect a possible liquidity sweep near $4,117 before continuation. MACD histogram shows light selling pressure, but no trend reversal signal yet.
⸻
3️⃣ Fibonacci Analysis (Swing $4,097 → $4,148)
• 38.2% – $4,129
• 50.0% – $4,123
• 61.8% – $4,117
🎯 Golden Zone: $4,129 – $4,117 → Ideal reaction area for potential bullish continuation toward $4,165–$4,180.
⸻
4️⃣ High-Probability Trade Scenarios
📈 BUY SCENARIO (Primary Bias)
• Entry Zone: $4,125 – $4,115
• Targets: $4,138 → $4,148 → $4,165 → $4,180
• Stop Loss: Below $4,098
• Confirmation: Bullish CHoCH / engulfing candle from Golden Zone or RSI recovery from 45–50 area.
📉 SELL SCENARIO (Countertrend)
• Entry Zone: $4,138 – $4,148 (supply zone + trendline resistance)
• Targets: $4,125 → $4,115 → $4,098
• Stop Loss: Above $4,152
• Confirmation: Strong rejection candle or divergence on lower timeframes.
💥 Breakout Play:
• Bullish: Break & close above $4,150 → Targets $4,165 → $4,180
• Bearish: Break below $4,098 → Continuation toward $4,085 → $4,075
⸻
5️⃣ Fundamental Watch
• Asia session expected to stay quiet ahead of key US CPI release tomorrow.
• USD Index (DXY) remains below 106.00, maintaining bullish sentiment for gold.
• Watch for remarks from Fed speakers later today for potential dollar volatility.
• Geopolitical risk remains neutral; risk-on sentiment could cap upside momentum until CPI confirmation.
⸻
6️⃣ Key Technical Levels
Resistance: 4,138 / 4,148 / 4,165 / 4,180
Support: 4,115 / 4,098 / 4,085 / 4,075
Golden Zone: 4,129 – 4,117
Trendline Support: Extends from 4,072 through 4,115
EMA Structure: 20EMA above 50EMA; 100EMA aligning near 4,118 for confluence
⸻
7️⃣ Analyst Summary
Gold maintains a controlled bullish environment while consolidating below short-term supply. The retracement toward $4,117–$4,115 offers a potential reload zone for continuation, provided the market holds above $4,098. Sellers remain weak unless a confirmed break below the Golden Zone occurs.
⸻
8️⃣ Final Bias Summary
📊 Bias: Bullish-to-neutral above $4,115; bearish only below $4,098
🎯 Buy Interest Zone: $4,129–$4,117 (Golden Zone)
🛑 Invalidation: Below $4,098 (loss of bullish structure)
💡 Focus: Watch for CHoCH confirmation on 15M–5M before entering buys.
⸻
🥇 ElDoradoFx PREMIUM 3.0 – PERFORMANCE 11/11/2025 🥇
📊 Another strong day combining precision entries, live scalps & long-term swings.
━━━━━━━━━━━━━━━
🪙 XAU/USD (GOLD)
🟢 BUY +110 PIPS
🟢 BUY +90 PIPS
🟢 BUY LIMIT +40 PIPS
🟢 BUY +40 PIPS
🟢 BUY +60 PIPS
❌ BUY -50 PIPS (SL)
🟢 BUY +280 PIPS
🟢 BUY +240 PIPS
---
🎯 LIVE SESSION RESULTS
❌ BUY -40 PIPS (SL)
🟢 BUY +120 PIPS
🟢 BUY +60 PIPS
🟢 BUY +30 PIPS
---
📈 SWING TRADE UPDATE (From 05/11)
🟩 Running Profit: +1,900 PIPS
━━━━━━━━━━━━━━━
💰 TOTAL DAILY GAIN: +980 PIPS
📊 12 Trades → 10 Wins | 2 SL
🎯 Accuracy: 83%
━━━━━━━━━━━━━━━
🔥 Excellent performance with continued swing strength and live session precision.
👏 Congratulations if you profited! ✅✅✅🚀🚀🚀
— ElDoradoFx PREMIUM 3.0 Team 💼📈
Xauusdanalysis

Gold Trade OpportunityOANDA:XAUUSD
Gold started this week with an impulsive move from the demand zone (3869.29) and is currently at the resistance level (unmitigated H4 supply) at 4145 to 4130.
We could see price sell off to the levels of 4058 for a liquidity sweep and
alternatively Gold could perform a counter trend then continue its bullish run to towards 4360
Waiting for confirmation at the marked key level to make a clear and informed trading decision

XAU/USD – Gold Reaches Supply Zone Prepare for a Pullback to FVg📊 Market Structure
Gold continues to maintain its bullish structure after breaking the structure high (BoS) at the 4,000 USD zone and forming a steep bullish channel over the past 3 sessions.
Currently, the price is precisely hitting the Order Block 4,140 – 4,150 USD — a critical supply zone formed from the previous distribution.
The H1 candle is showing slight technical reaction signs , implying the potential for a short pullback to re-accumulate liquidity.
If a pullback occurs, the Premium Zone 4,080 – 4,085 USD and FVG 4,025 – 4,035 USD will be ideal areas to look for buy signals.
The bullish structure is only invalidated if the H1 candle closes below the Support 4,006 USD zone.
💎 Key Technical Zones
• Order Block: 4,140 – 4,150 USD → main supply zone, where profit-taking pressure appears
• Premium Zone: 4,080 – 4,085 USD → medium-term rebalancing zone
• FVG Zone: 4,025 – 4,035 USD → potential discounted price zone for BUY orders
• Support Zone: 4,000 – 4,006 USD → critical defense zone
🎯 Trading Plan
1️⃣ SELL Scalp – Reaction at OB 4,145 USD
If the price continues to react downwards at the 4,140 – 4,150 USD supply zone:
• Entry: 4,143 – 4,147
• SL: 4,155
• TP1: 4,085
• TP2: 4,035
→ Short-term setup, targeting the rebalancing zone before buying back in line with the trend.
2️⃣ BUY Setup – Continuation from FVG Zone
When the price pulls back to the FVG / Premium Zone and creates a confirmed bullish signal:
• Entry: 4,030 – 4,035
• SL: 4,006
• TP1: 4,090
• TP2: 4,145
• TP3: 4,170
→ Trend-following setup, preferred when the price re-accumulates and a clear rejection appears.
🧠 Vincent’s View
Buyers still control the market, but the current OB touch may trigger a short pullback before the bullish wave continues.
The ideal scenario is “tap OB → pullback FVG → continuation,” maintaining a stable bullish structure towards the 4,170 USD target.
“Buy the dip where fear replaces greed — that’s where the next impulse begins.” ⚜️
⏰ Timeframe: 1H
📅 Updated: 11/11/2025
✍️ Analysis by: Captain Vincent

#XAUUSD: Will There Be Major Price Correction On Gold? Dear Traders,
Gold has been rallying with strong bullish momentum and has not experienced a major correction since the last few weeks. We have identified a key level from which the price can continue its bullish momentum if fundamentals do not change. Furthermore, we can target $4200 in a few weeks if the current momentum continues.
Best regards,
Team Setupsfx_

XAUUSD Breakout Rally Underway — Parallel Channel RetestGold (XAUUSD) is showcasing a classic parallel channel breakout retest pattern that could propel prices higher toward the 4225+ zone in the coming sessions.
Over the past several days, price action has been neatly contained within a parallel channel, bounded by an upward-sloping support line and a steady resistance band. Each swing high and low respected this range, forming a strong structural base for a potential breakout setup.
Recently, the price managed to break above the resistance zone, confirming bullish momentum. This breakout came after a strong impulse move from the channel's support, pushing above the resistance with increasing volume and strength.
Now, the price is revisiting the previous resistance — which is expected to act as a new support. This type of breakout retest is a healthy sign of a sustainable uptrend. If buyers defend this zone, it opens the door for the next bullish leg.
Key Observations:
Support Zone: Around 4100 (former resistance now acting as support)
Resistance Turned Support: Confirming strength in the breakout
Pattern Height Projection: The earlier swing height projected from the breakout point gives a bullish target above 4225
Confirmation Needed: A bounce from the retest zone with a strong candle will confirm the next leg up
Possible Trading Strategy:
Entry: On confirmation candle after retest (e.g., bullish engulfing on 1H or 4H)
Targets:
Target 1: 4165
Final Target: 4225+
Stop Loss: Below 4085 (just under the retest zone)
In summary, the structure favors bulls as long as price holds above the 4100 support. The clean breakout and retest setup, backed by prior channel compression, indicates that XAUUSD is preparing for a fresh upside wave. Keep an eye on the confirmation candle — this move could offer a low-risk, high-reward setup in gold.

XAUUSD Forming Bullish MomentumGold (XAUUSD) is currently trading around the 4,000 mark, showing strong bullish momentum after an extended breakout from a prolonged consolidation phase. The market has successfully cleared its previous resistance zone, which had acted as a ceiling for months, confirming a continuation of the broader uptrend. The pattern on the chart clearly reflects a breakout-retest-continuation structure, where gold has completed a healthy pullback phase and is now preparing for its next impulsive move to the upside. As long as price remains above the 3,900 support area, the bullish outlook stays intact, with buyers likely targeting the 4,300–4,500 region in the coming sessions.
Fundamentally, gold’s bullish tone is being supported by a combination of softer U.S. dollar sentiment and growing expectations that the Federal Reserve may adopt a more dovish stance heading into 2026. Inflation data has shown signs of moderating, and U.S. Treasury yields have started to ease, which typically benefits non-yielding assets like gold. Additionally, ongoing geopolitical tensions and central bank accumulation of gold reserves continue to add a strong layer of demand, keeping the metal well-supported even during short-term pullbacks.
Looking forward, XAUUSD’s trend remains positive as long as market conditions sustain this risk-hedging narrative. Any dips toward 3,950–3,900 could offer fresh buying opportunities for swing traders targeting the next leg higher. The technical picture complements the fundamentals, suggesting that gold may be entering a new expansion phase toward the 4,500–4,700 zone if momentum persists. A clean daily close above 4,100 would likely confirm this next bullish wave, keeping the overall sentiment firmly in favor of the bulls.

Title: Gold Faces Rejection at Resistance ZoneGold price faces resistance near the 4,140 level after a strong bullish move. The chart shows price rejecting from the trendline and resistance zone, signaling a possible pullback toward the 4,105 target area, with key support around 4,047.
Title: Gold Rejection at Resistance — Possible Pullback Toward 4105

Gold price analysis November 11Gold continued to move as expected in yesterday's session, bringing impressive profits to traders who followed the previous strategy.
Currently, the resistance zone of 4150 is acting as an important barrier as buying pressure starts to slow down. There is a high possibility that the market will see a short-term correction around this area.
Current strategy:
SELL GOLD (Scalping) around the resistance zone of 4145, expecting a short-term price reaction.
When the buyers return and create a confirmation signal around the 4076–4106 area, wait to BUY in line with the main trend, with a further target towards ATH 4375, where the liquidity zone above is still empty.
📈 The overall trend is still up – the correction is only temporary for the market to gain momentum for the next wave.

A reversal? No! Our bullish outlook remains unchanged!#XAUUSD OANDA:XAUUSD TVC:GOLD
Looking at the hourly and 4-hour charts, the technical indicators are diverging, indicating a need for a pullback correction. In the short term, it may test the 4115-4105 support level. Therefore, do not trade blindly in the short term, wait for the price to pull back to the support level before participating in long positions.

BUY GOLD (XAUUSD) - Amazing opportunity XAUUSD (Gold) has been stuck inside a sidewards channel and has struggled to break through it for a while. However, the price recently broke above the green trend line which acted as a medium resistance level (which means the price is very likely to head to the next major resistance zone which will is marked as the take profit level). XAUUSD is clearly bullish and will be heading upwards in the next few days. BUY!

XAUUSD Potential for Short-Term CorrectionThe short-term outlook for the gold price FOREXCOM:XAUUSD is considered positive (bullish). This sentiment is supported by two key fundamental factors:
The potential end of the US government shutdown.
Market expectations for further policy easing from the Federal Reserve (The Fed).
Price Movement Scenario (Pivot: 4130)
The 4130 level serves as a pivot point, or a determinant of the direction of gold's movement in the near term.
⬆️ Bullish Scenario
If the price moves above 4130, further upside is expected, with the following targets:
Target 1: 4155
Target 2: 4168
Target 3: 4207
⬇️ Bearish Scenario
If the price moves below 4130, a bearish correction is likely, with the following targets:
Target 1: 4105
Target 2: 4085
Target 3: 4055

Elliott Wave Analysis – XAUUSD | November 11, 2025
🔹 Momentum
• D1 timeframe:
Daily momentum has closed, showing that bullish strength is fading. We’ll wait for today’s daily candle to confirm whether a reversal is forming.
• H4 timeframe:
The two momentum lines are sticking together — this indicates that while upward pressure remains, it is weakening, suggesting a possible formation of wave X top.
• H1 timeframe:
H1 momentum is turning down from the overbought zone. With all three timeframes (D1, H4, H1) aligned, the current price area is likely marking a wave top.
________________________________________
🔹 Wave Structure
• D1 timeframe:
The corrective wave (4) is still developing. Once D1 momentum fully reverses and moves into the oversold zone, it may mark the final stage of the correction phase.
• H4 timeframe:
Price has reached the wave X target area around 4145.
With both D1 and H4 momentum in the overbought zone and starting to turn down, this level is likely the completion of wave X.
After that, price may begin a decline to complete wave Y.
The duration of wave Y is expected to correspond to the time it takes for D1 momentum to move from overbought to oversold.
• H1 timeframe:
The red 5-wave structure has completed, with price currently in wave (5).
The target area for wave (5) lies between 4145 and 4050, overlapping with the wave X target zone.
Therefore, the sell entry from yesterday around 4145 remains valid.
________________________________________
🔹 Trading Plan
• Sell Zone: 4145 – 4147
• Stop Loss: 4165
• Take Profit 1: 4075
• Take Profit 2: 4046
• Take Profit 3: 3932
⚠️ Note: If price closes below 4046, it will confirm that purple wave Y is in progress.
In that case, the target of wave Y could extend below 3855.

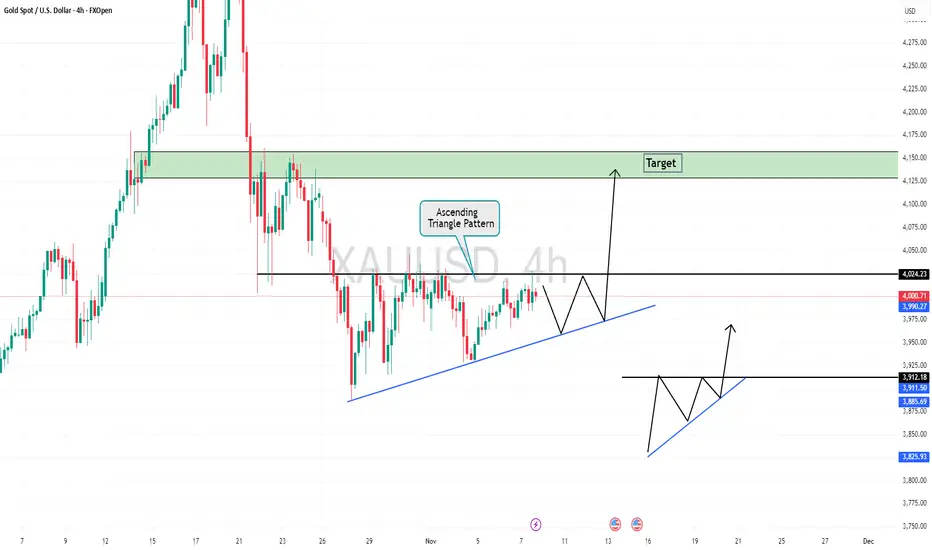
Gold is Ready For Bull From Triangle PatternHello Traders
In This Chart GOLD HOURLY Forex Forecast By FOREX PLANET
today Gold analysis 👆
🟢This Chart includes_ (GOLD market update)
🟢What is The Next Opportunity on GOLD Market
🟢how to Enter to the Valid Entry With Assurance Profit
This CHART is For Trader's that Want to Improve Their Technical Analysis Skills and Their Trading By Understanding How To Analyze The Market Using Multiple Timeframes and Understanding The Bigger Picture on the Charts
XAUUSD UPDATE: WHAT NEXTHi everyone,
Gold is currently testing the resistance level at 4149.78. A breakout above this level could push the price toward the 4203–4204 level. Conversely, if the price breaks below the 4124–4123 support, I’ll be watching for a potential pullback around 4098 or a rejection from the trendline
good luck all
**My trading strategy is not intended to be a signal. It's a process of learning about market structure and sharpening my trading my skills also for my trade journal**
Thanks a lot for your support

XAUUSD: Watch for a breakout during the U.S. sessionThe Gold is basically oscillating within a narrow range now, but the U.S. session is bound to break out of this range.
Gold has been consolidating for nearly a month, and finally, the consolidation ended at the end of October and the beginning of November. As the bullish momentum emerged, gold staged a bottoming rebound. As I’ve said before, in a strong upward trend, it’s unwise to call the top prematurely.
For trading strategies, I still recommend prioritizing buying on pullbacks, with support below held at the key integer level of 4100.
Trading Strategy:
Buy 4120 - 4130
SL 4110
TP 4140 - 4150 - 4160
Sell 4160 - 4155
SL 4170
TP 4145 - 4035 - 4025

The bull market has returned. Am I bullish at this price level?#XAUUSD TVC:GOLD OANDA:XAUUSD
Gold prices performed strongly yesterday, closing with a large bullish candle on the daily chart and stabilizing above the daily MA5, officially signaling the return of bulls to the market.
Gold strengthened further today, and from a technical perspective, the bullish trend remains intact. Therefore, continuing to go long on gold is clearly safer. The bullish signal given last night regarding a pullback to the 4075 support level remains valid. However, with the passage of time and the continued strength of gold, a direct pullback to this level in the short term is somewhat difficult. But as a point of multiple pullbacks on smaller timeframes and near the daily MA20, the 4075 support remains reliable. Therefore, we can consider it a defensive level for the short-term bulls. As long as gold prices remain above this level, the bullish momentum will not change.
Currently, looking at the hourly chart, the 4125-4110 range is the support zone for the short term. If the price retraces to this level during the European session, it would be a good entry point, and we can continue to go long on gold within this range.

Is gold about to return to a bullish trend?On Monday, the US dollar index remained below the 100 level as signs that the US government might resume operations boosted market risk sentiment.
Spot gold rebounded sharply, surging over $100 intraday and returning above $4100, reaching a new high in over two weeks.
So far, gold has reached a high near $4150.
Looking at the hourly chart:
The two most crucial support levels for gold are currently around 4120-4115 and the $4000 level.
The 4120-4115 level coincides with the hourly moving average (MA20), and 4115 is also the opening price today. Therefore, if it holds above this level, gold is likely to maintain a consolidation and upward trend today.
Secondly, there's the $4000 level, which is the hourly MA30. It's possible that the price might break through the MA20 and directly reach the MA30.
Therefore, I think it's best to wait until at least 4120-4115 before considering long positions.
If the price breaks through the morning high of 4150, it may continue to reach the high near 4180.

GOLD: Still prioritize buying on pullbacksIn terms of gold's current pattern, the strong momentum built up after a continuous upward move is likely to extend significantly. We remain bullish on the gold market for now. The short-term resistance above is around 4145, which will also be our primary target going forward. On the downside, support is held at the key integer level of 4100, a level that serves as one of the primary retracement points for short-term bullish corrections. Operationally, we prioritize buying on pullbacks.
From the 4-hour chart analysis, the support below will continue to lie around the 4090-4110 range, while the short-term resistance above is focused on 4145-4150. If gold stabilizes above 4150, it may surge toward 4180 today. In trading, we maintain the strategy of buying on pullbacks and should avoid blindly chasing the rally.
Trading Strategy:
Buy 4110 - 4120
SL 4100
TP 4140 - 4145 - 4150
Sell 4150 - 4145
SL 4160
TP 4125 - 4020 - 4015

Accurate prediction of an upward trend has arrived as expected.The protracted US government shutdown is finally coming to an end! The Senate has cleared procedural hurdles, and the temporary funding bill has passed a procedural vote, ensuring government funding until January. The shutdown is likely to end this weekend.
As soon as the news came out, the market went from cloudy to sunny – the previous shutdown had tightened liquidity, but now it seems to be easing, and the precious metals market is leading the rebound. Although the shutdown isn't completely resolved, the resumption of negotiations between the two parties has sent a positive signal, boosting risk appetite and relieving the anxiety of watching partisan infighting.
To put it simply, this "temporary extension" by the US government is like a reassurance to the market. Investors who were panicking before the shutdown can now breathe a sigh of relief. All that's left is to wait for the final decision so that the government can fully "reopen for business"!
Gold broke out of a two-week low-level triangle pattern in the previous trading session, ushering in a strong upward trend. Yesterday's market exhibited a three-stage upward trend: higher in the Asian session, continued gains in the European session, and accelerated gains in the US session. Each rally was followed by a period of consolidation without significant pullbacks, a classic characteristic of extremely strong market conditions.
Regarding the future trend, the bullish outlook remains unchanged for today.
On one hand, the current situation strongly suggests a period of high-level consolidation: given the current extremely strong pattern, gold is more likely to continue its "time-for-space" consolidation, digesting pressure before resuming its upward movement. If this pattern holds, aggressive long positions can be considered before the European session.
On the other hand, if a pullback occurs: the 4116-4110 range should be closely watched, as this will act as a crucial support level. If the price retraces to this range and stabilizes, long positions can be considered on the pullback.
gold awaits breakout before we buy or sell#XAUUSD bullish await breakout above 4145- 4149 on M30-H1 closure to buy.
Target 4161 -4178. Stop loss 4137
Below the rectangle 4137 holds strong pullback and rejection on sideways before we can get selling range.
If the buy doesn't breakout first but drop below the rectangle then we look for sell.

USOIL: Accumulate bullish momentumFrom the daily chart perspective of crude oil, on a partial level, the current oscillating rhythm is a secondary consolidation. Judging from the primary and secondary rhythms, there is still room for a rebound and upward move in the trend. The MACD indicator remains below the zero axis, indicating that bullish momentum still needs to accumulate further. It is expected that after the medium-term trend of crude oil tests the low point and finds support, a rebound and upward movement is likely to form.
Buy 59 - 59.5
SL 58.5
TP 60 - 60.5 - 61
Sell 60.5 - 61
SL 61.5
TP 59.1 - 58.5

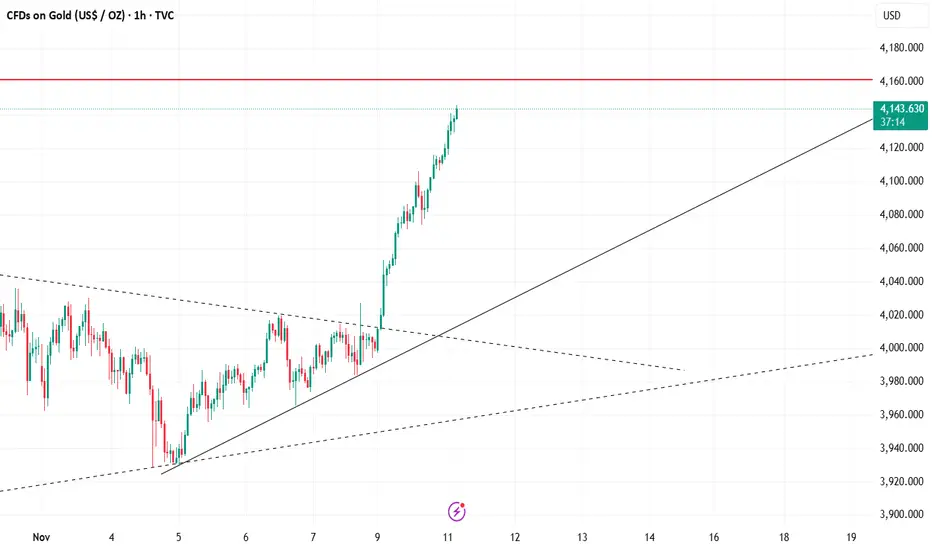
The Shutdown Ends: How Will Gold Prices React?The Shutdown Ends: How Will Gold Prices React?
According to Reuters, the U.S. Senate on Monday approved a compromise deal to bring an end to the longest government shutdown in the country’s history.
During the shutdown:
→ millions of Americans lost access to food assistance programmes;
→ hundreds of thousands of federal employees went without pay;
→ air travel was severely disrupted.
The uncertainty surrounding the potential continuation of the shutdown appears to have contributed to a breakout in the price of gold (as a traditional safe-haven asset) above its recent consolidation zone, marked by black lines on the chart.
However, further gains could be capped not only by fading risk aversion but also by a less obvious resistance level, which the XAU/USD rate has reached today.
Technical Analysis of the XAU/USD Chart
Using the key pivot points (highlighted in bold), we can trace a descending channel, with the gold price now testing its upper boundary, where resistance may emerge.
Another argument supporting this view is that the price currently sits around the 50% retracement level of the A→B downswing. This area may attract sellers seeking to defend the downward trajectory of gold.
Whether this resistance line holds — or the bulls attempt to reignite the autumn rally — will largely depend on the tone of upcoming economic releases (delayed by the shutdown) and their impact on market expectations for a possible Federal Reserve rate cut.
This article represents the opinion of the Companies operating under the FXOpen brand only. It is not to be construed as an offer, solicitation, or recommendation with respect to products and services provided by the Companies operating under the FXOpen brand, nor is it to be considered financial advice.

GOLD (XAU/USD): FED DOVISHNESS FUELS BREAKOUT! WHERE TO LONG?📰 Fundamental Analysis: The Main Driver (MUST READ)
The macroeconomic winds are strongly pushing Gold higher:
Rate Cut Expectations: The market is currently pricing in over 60% probability of another Fed rate cut in December.
Lower rates weaken the USD and eliminate the opportunity cost of holding non-yielding Gold.
Weak Economic Data: The US Consumer Sentiment Survey from the University of Michigan plunged to 50.3 (lowest since June 2022). This weak reading supports the narrative of a slowing economy, bolstering the case for a more dovish Fed.
💡 Key Event This Week: Focus shifts to FOMC member speeches on Wednesday (following the Tuesday bank holiday) for confirmation on the future rate path.
📊 Technical Analysis: The Perfect Setup
Gold has executed a decisive Breakout from its consolidation range (4,044 - 4,060), confirming a structural shift to a Bullish Trend.
Waiting for the Long Entry: DO NOT CHASE THE PRICE! Be patient and wait for a pullback to the Demand Zone/CP (4,081 - 4,114). This is the optimal area for Bulls to enter and follow the trend.
Targets (TP): If the CP zone holds, potential targets are 4,155, 4,185, and the higher objective at 4,236.
Stop-Loss (SL): Place safely below the old breakout level at 4,044.
🎯 Strategy Summary
Strategy: Wait to Buy (Long) in the 4,081 - 4,114 region.
Risk Note: Caution if price breaks and closes below 4,044.
#XAUUSD #Gold #FedRateCut #Breakout #TechnicalAnalysis #FOMC #TradingSetup
