Gold: Consolidation trend remains unbrokenGold has just tested the 4020-4030 resistance zone, only to pull back under pressure and retrace. This indicates that the resistance zone remains effective today. With the non-farm payroll data not being released, gold prices are expected to continue their sideways trend.
From the 4-hour chart perspective, focus on the short-term resistance at 4020-4030. The key pivot point for bull-bear dynamics lies at 4045-4055. For support levels, watch the short-term zone at 3960-3970, with critical attention on the previous low support at 3888-3890.
Our trading strategy, which was provided this morning, has already been validated by the market. We still recommend prioritizing short positions on rebounds for now, and caution against chasing the trend.
Xauusdanalysis

XAUUSD – Consolidation Before Drop**Gold (XAUUSD) – Consolidation Before Potential Downside Move**
Gold continues to hover in a consolidation range after the recent breakout and structural shift on the 3H chart. The bullish momentum that previously dominated has now slowed, indicating a possible distribution phase forming near the $4,050–$4,100 zone.
The market structure shows repeated rejections at the upper boundary, suggesting that buyers are losing strength. With BOS (Break of Structure) confirmations in the recent candles and a clear lack of higher highs, a potential downside continuation could unfold once the current range is broken.
If sellers take control below $3,978, the next liquidity targets lie around **$3,886** and possibly **$3,614**. This scenario aligns with the broader retracement expectation after a strong prior uptrend.
However, a confirmed breakout above the consolidation area would shift the short-term bias back to bullish, with upside potential toward **$4,248** and beyond.
**Market Outlook:** Neutral → Bearish
**Bias:** Short-term corrective move expected
**Key Levels:**
* Resistance: $4,050 – $4,100
* Support: $3,886 – $3,614
**Tags:** #Gold #XAUUSD #GoldAnalysis #XAUUSDforecast #GoldPricePrediction #GoldTrading #GoldMarket #Commodities #TradingViewIdeas

Gold (XAUUSD) – 6 Nov | Watching Supply 4030, Demand 3990 Zone🟡 Gold (XAUUSD) Analysis – 6 November
Hello Disciplined Traders,
Welcome to the Chart Is Mirror Community 👋
Market Context
• Gold continues to show bullish momentum after retesting the 3935–3915.6 demand zone .
• As per our yesterday’s analysis , we expected a retest of the 3942.5–3936.4 POI zone for a long setup, but the market did not retrace that deep.
• Instead, it formed a new support around 3956 and broke structure ( BoS ), confirming the M15 uptrend aligned with the H4 pullback phase .
• During the morning session, the market respected structure and resumed its bullish momentum from the 3967–3963 demand zone .
Key Observations
• There is a supply zone around 4022.5–4030.9 , aligned with the M15 major LH level , where potential rejection can occur.
• If the market respects this zone, we can plan a short setup with LTF confirmation targeting the 3990–3982.5 POI buy zone .
• For bullish continuation, our buying POI zone 3990–3982.5 remains valid — if respected with LTF bullish confirmation , we’ll plan our next long setup accordingly.
• If the market fails to hold this buy zone, it could retrace deeper to 3942.5–3936.4 , which will act as our next buy zone of interest .
Execution Plan
• Observe market reaction around 4022.5–4030.9 supply zone for short opportunities.
• Watch 3990–3982.5 for potential long setups with confirmation.
• If broken, the next key buy zone is 3942.5–3936.4 .
• No confirmation, no entry — let structure lead your participation.
Stillness between impulses defines precision.
📘 Shared by @ChartIsMirror

XAU/USD Intraday Plan — 3989 Support Holding, Next Stop 4042?Price has broken above 3989 and pulled back to retest the 50MA, which is now holding as support. If bullish momentum continues, the 50MA looks ready to cross above the 200MA, which would strengthen the short-term bullish momentum.
The next resistance is at 4042. A clean break above 4042 could open the move toward 4090.
If buyers fail to hold above 3989, price may slide back into the First Reaction Zone (3957–3918).
Failure to hold that zone could bring the Support Zone and even the HTF Support Zone back into play.
📌Key Levels to Watch:
Resistance:
4042
4090
4142
Support:
3989
3957
3918
3884
3851
3820
3781
🔎 Fundamental Focus:
Not many high-impact releases today. We do have several FOMC members speaking, along with Prelim UoM Consumer Sentiment and Inflation Expectations later.
As always, keep in mind that geopolitical and broader macro sentiment continue to play a major role here — even with a quiet calendar, gold can still react to headlines.

Elliott Wave Analysis – XAUUSD (Gold) | November 7, 2025
🔹 Momentum
D1 timeframe:
Daily momentum is turning upward, but just one more bullish candle will push it into the overbought zone. This suggests that the current upward move may not be sustainable, and a short-term correction could occur soon.
H4 timeframe:
H4 momentum is about to turn bullish from the oversold area. If this signal is confirmed, we can expect a short-term upward move. However, as the market is currently in a balanced state, even a small push from either buyers or sellers could shift momentum direction. Therefore, it’s better to observe carefully rather than act too early.
90M timeframe:
Momentum on the 90-minute chart is turning downward, indicating a possible short-term pullback before any further advance.
________________________________________
🔹 Wave Structure
D1 timeframe:
The ongoing rise in momentum indicates that wave X is still unfolding, meaning the corrective phase is not yet complete.
H4 timeframe:
Wave X is currently forming. The liquidity zone at 4028 remains a key level to watch.
If the price breaks above this zone, the next target will likely be the upper liquidity zone at 4070.
On the H4 chart, the green level around 4007 represents the highest-volume area, currently acting as a strong resistance.
Combined with the H4 bullish momentum reversal, it shows buying pressure exists, but the resistance remains heavy, making the 4007–4028 region a key battleground.
We should wait for a clear breakout before confirming the next direction.
90M timeframe:
• A triangle-like structure seems to be forming, but it’s not yet complete, so confirmation is needed.
• Waves a and b appear finished; the market may now be forming wave c (black) or wave d (black).
• Since H4 momentum is turning bullish, if the price breaks above 4012, it will likely confirm wave c continuation.
• Conversely, if the price drops toward 3950, completing a three-wave WXY (blue) structure, we can consider it wave d instead.
Currently, wave c (black) is temporarily labeled since the structure already shows three subwaves completed.
Therefore, I expect a decline toward 3950, where we can look for a short-term buy setup.
________________________________________
🎯 Trade Plan
• Buy Zone: 3952 – 3950
• Stoploss: 3935
• TP1: 3980
• TP2: 4000

XAUUSD Forming Bullish MomentumGold (XAUUSD) is currently trading around the 4,000 mark, showing strong bullish momentum after an extended breakout from a prolonged consolidation phase. The market has successfully cleared its previous resistance zone, which had acted as a ceiling for months, confirming a continuation of the broader uptrend. The pattern on the chart clearly reflects a breakout-retest-continuation structure, where gold has completed a healthy pullback phase and is now preparing for its next impulsive move to the upside. As long as price remains above the 3,900 support area, the bullish outlook stays intact, with buyers likely targeting the 4,300–4,500 region in the coming sessions.
Fundamentally, gold’s bullish tone is being supported by a combination of softer U.S. dollar sentiment and growing expectations that the Federal Reserve may adopt a more dovish stance heading into 2026. Inflation data has shown signs of moderating, and U.S. Treasury yields have started to ease, which typically benefits non-yielding assets like gold. Additionally, ongoing geopolitical tensions and central bank accumulation of gold reserves continue to add a strong layer of demand, keeping the metal well-supported even during short-term pullbacks.
Looking forward, XAUUSD’s trend remains positive as long as market conditions sustain this risk-hedging narrative. Any dips toward 3,950–3,900 could offer fresh buying opportunities for swing traders targeting the next leg higher. The technical picture complements the fundamentals, suggesting that gold may be entering a new expansion phase toward the 4,500–4,700 zone if momentum persists. A clean daily close above 4,100 would likely confirm this next bullish wave, keeping the overall sentiment firmly in favor of the bulls.

Gold Upholds Trendline Support, Targeting 4010Gold price is following an upward trendline, holding above the support zone near 3984. The next target is set at 4010 if bullish momentum continues.

Market volatility, trade steadily.#XAUUSD TVC:GOLD OANDA:XAUUSD
As mentioned last night, gold prices failed to break below the important short-term support level of 3965, so we maintain our bullish view. Although the intraday volatility was not high, the consolidation process can be seen as gold accumulating positions in the short term. Market breakout requires patience. Currently, the daily MA5 and MA10 moving averages are converging around 3980, which is also where the 4-hour middle band is located. The key resistance level in the short term is in the 4015-4030 area. A break above this level could lead to further gains towards 4050-4080.
It's important to be cautious given the recent volatile market with poor continuity. Therefore, even if a breakout occurs today, it is not advisable to rush to buy. Instead, wait for a pullback before entering the market to avoid being trapped by blindly chasing highs. The 3980-3965range remains the ideal entry point for bulls. Maintaining patience is always a key element in trading.

Maintain the morning's trading strategyDue to the government shutdown, the U.S. Bureau of Labor Statistics failed to issue the October Nonfarm Payrolls report as scheduled, marking the second consecutive "absence" of the report.
Therefore, for today's U.S. trading session, we will maintain the morning's trading strategy and continue to treat the market as a volatile trend. We will focus on short-selling on rebounds, adopt a "observe more, trade less" approach, refrain from chasing trades cautiously, and patiently wait for key levels to enter positions.

Gold: Trade Flexibly Within the 3963–4030 RangeDue to the U.S. government shutdown, NFP data has been delayed for two consecutive months and the CPI cycle has also experienced its first full interruption. Congress is currently negotiating, and expectations suggest the government may reopen by mid-month — a positive sign for the market.
If October and November labor data are released together by the end of the month, along with the delayed CPI update, this could significantly reshape Fed policy expectations:
Strong jobs and sticky inflation → Fed may delay rate cuts
Signs of economic slowdown → Rate-cut expectations strengthen
A concentrated release of key economic data will likely increase market volatility. Opportunities and risks will rise together, so risk management is essential.
From a technical standpoint, yesterday’s intraday spike and pullback reflected the tug-of-war between safe-haven demand and risk aversion. Selling pressure above 4006 capped upside momentum, but dip-buying interest allowed price to reclaim the 4000 level. The tug-of-war continues.
On the 4-hour chart, moving averages are starting to converge, with price holding above the MA60 but no clear directional signal yet. Key resistance remains at 4030/4050/4080-4100, while support sits at 3988-3982, with the broader support zone at 3948-3921.
Short-term structure on the 30M and 1H charts is bearish, suggesting potential further downside. Therefore, the 3988-3982 support area will be critical — holding above it keeps room for a bullish reversal.
Trading Strategy:
Medium- to long-term: accumulate long positions gradually
Short-term: trade the range — sell highs, buy dips
If price breaks key levels, consider reversal trades; in this tug-of-war environment, flexible strategies may capture better opportunities

XAUUSD: Short on rebounds ahead of the Non-Farm PayrollsIt closed around the 3977 level on Thursday, with the lowest touching around 3964.4 before finishing in a range-bound move, which also hit the 3960-3970 zone I indicated yesterday. I also kept emphasizing yesterday not to chase long positions at high levels.
Gold faces heavy resistance above. The bulls can only break through if driven by significant bullish news; otherwise, we will continue to stick to shorting on rebounds. With the Non-Farm Payrolls report due this Friday, we will maintain the approach of shorting on rebounds during the morning.
Looking at the 4-hour chart, the immediate resistance above is focused on the 4020-4025 zone, with the key bull-bear watershed at 4047-4055. For short-term support, watch the 3960-3970 area, while the key support lies at the previous low around 3888-3890.
In terms of operation, I still recommend prioritizing shorting on rebounds. For mid-range levels, we should always adhere to observing more and acting less, be cautious about chasing orders, and patiently wait for entry at key levels.
Trading Strategy:
Sell 4010 - 4020
SL 4030
TP 3980 - 3970 - 3960
Buy 3920 - 3930
SL 3910
TP 3950 - 3960 - 3970

GoldXAUUSD
- Symmetrical Triangle as an corrective pattern in Short Time Frame
- Break of Structure
- RSI - Divergence
- Completed " 12345 " Impulsive Waves and " ABC " Corrective Waves
- Change of Characteristics

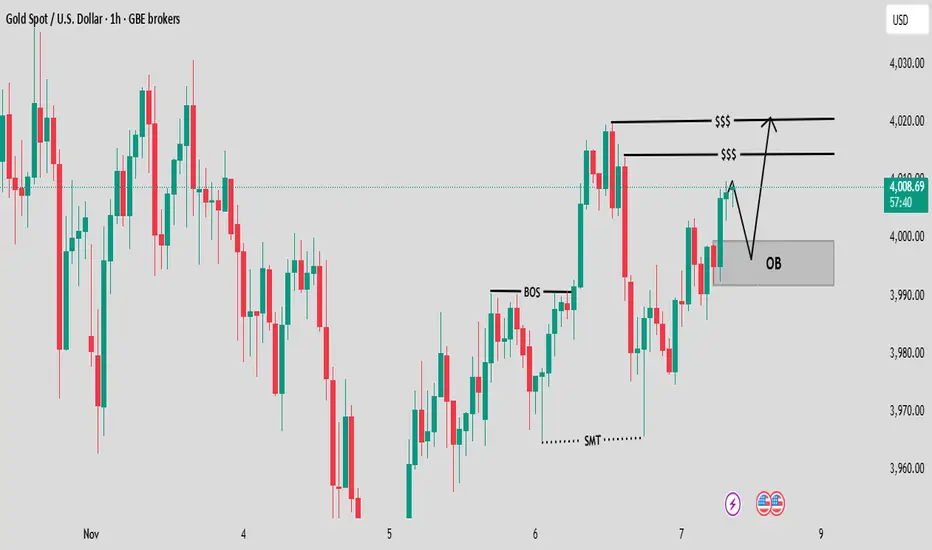
XAUUSD: Bullish Structure Shift Targeting Liquidity Above OB ?Break of Structure (BOS): There's a clear "BOS" labeled, indicating that the price has broken above a previous lower high. This is typically interpreted as a shift from a short-term downtrend (or consolidation) to an uptrend (or a structural move higher).
Order Block (OB): An "OB" (Order Block) is highlighted. This is a zone where a significant number of buy orders are believed to have been placed, making it a potential support area where price might retrace before moving higher.
Sell-Side Liquidity (BOS/$$$): The areas labeled "$$$" above the recent high represent liquidity. These are points where stop-loss orders from short sellers or pending sell orders are clustered, making them attractive targets for institutional traders to drive the price toward, often causing a quick move through that level.
Bearish Divergence (SMT): The "SMT" (Smart Money Technique) is marked, which often refers to a divergence between two correlated assets (like Gold and a US Dollar index) or a specific pattern where the low of one asset failed to reach the low of another, suggesting institutional manipulation or a short-term reversal (in this case, preceding the BOS).
Projected Move: The arrows illustrate a common trading hypothesis: the price is expected to retrace to the Order Block (OB), find support there, and then rally to take out the Sell-Side Liquidity ($$$) above the previous highs.
gold await breakout before entry#XAUUSD price still bullish until the 4019.9 breakout occurs which will target 4029 for bearish reverse.
Buy stop on short, 4019.9, target 4029, stop loss 4010. Sell from 4029 target 3991-3067.
Below 4002 on 2 times breakout hold strong bearish continuation, target 3967.
If H1 on above 4035 closure after 4029 breakout price is full bullish till 4060-70

GOLD HIGH PROBABILITY SETUPS SOON!!!🚨 XAUUSD HIGH PROBABILITY SELL/BUY SETUP 🚨
* Here We Can See Clearly The Next Potential Moves For GOLD Coming Hours/Days.
* Keep Your Eyes Close On Your Trading Positions.
* Happy PIP Hunting Traders.
FXKILLA.

XAUUSD — Intraday bullish if 3,996 holds — Targets 4,031 → 4,046Overview
Market printed CHOCH → BOS up intraday. I’ll look for a sell-side sweep into 3,996 (Bullish OB + FVG) and take confirmation longs toward BSL at 4,031 and extension 4,046. I’m not interested in chasing highs; I want liquidity → confirmation.
SMC Map (from your chart)
Buy-side liquidity (targets): 4,031.455, 4,046.774
Supply / Bearish OB: ~4,011
Mitigation zone: Bullish OB + FVG ~3,996.993
HTF Demand / Invalidation floor: 3,952.474
Structure: CHOCH → BOS up (intraday).
Playbook: sweep → BOS → FVG fill → OB entry.
Scenarios (reference levels)
Scenario 1 – Long (preferred)
Entry zone: 3,997–3,999 after a sweep of 3,996 + M5 BOS up and pullback (FVG fill).
SL: below 3,992 or below the M5 BOS swing low.
TP1: 4,011 (supply/OB).
TP2: 4,031 (BSL).
Runner: 4,046 (next BSL).
Management: take partial at TP1, move SL → BE; trail to structure.
Scenario 2 – Defensive short (reaction only)
Entry zone: 4,011–4,013 if price taps supply and prints M5 BOS down.
SL: above 4,016 or above reaction high.
TP1: 4,002 (intra support).
TP2: 3,996 (mitigation zone) → consider flip long if confirmation appears.
Invalidation: H1 close above 4,015 (supply reclaimed).
Notes & Session Timing
Focus on London Killzone; re-assess for NY if 4,011 breaks/holds.
No entries without confirmation (avoid FOMO at highs).
News/catalyst: manage size around data; protect gains into volatility spikes.
Risk
Partial at TP1, SL → BE post-confirmation. Risk per trade ≤ your plan. This is a personal view, not financial advice.

Market Analysis: Gold Stays FlatMarket Analysis: Gold Stays Flat
Gold price corrected gains, traded below $4,000, and started a consolidation.
Important Takeaways for Gold Price Analysis Today
- Gold price started a downside correction below $4,100 and $4,000 against the US Dollar.
- A key bullish trend line is forming with support at $3,985 on the hourly chart of gold.
Gold Price Technical Analysis
On the hourly chart of Gold, the price formed a base above $3,915. The price remained in a bullish zone and started an upward move within a range above $3,930.
There was a decent move above the 50-hour simple moving average and $3,975. The bulls pushed the price above the $4,000 and $4,010 resistance levels. A high was formed at $4,019 before the price saw a pullback.
The price dipped below the 23.6% Fib retracement level of the upward move from the $3,928 swing low to the $4,019 high, and the RSI declined below 50. Initial support on the downside is near $3,985, a bullish trend line, and the 50-hour simple moving average.
The first major area of interest for the bulls is near the 50% Fib retracement at $3,975. If there is a downside break below $3,975, the price might decline further. In the stated case, the price might drop toward $3,950. Any more losses might push the price toward $3,930.
Immediate resistance is near $4,020. The next major hurdle for the bulls is $4,030. An upside break above $4,030 could send Gold price toward $4,045. Any more gains may perhaps set the pace for an increase toward $4,090.
This article represents the opinion of the Companies operating under the FXOpen brand only. It is not to be construed as an offer, solicitation, or recommendation with respect to products and services provided by the Companies operating under the FXOpen brand, nor is it to be considered financial advice.

Gold Rejection at Resistance with Potential Bearish PullbackAnalysis:
The chart shows XAUUSD approaching a strong horizontal resistance zone around 4015–4020, a level where price has previously been rejected multiple times (highlighted in yellow). The market recently broke out of a falling channel, showing short-term bullish momentum, but now price is stalling again at this key resistance.
The grey zone above suggests a supply area, and the white arrow indicates a projected bearish move. As long as gold stays below this resistance, the probability of a downward correction increases.
A potential bearish target appears around 3900–3920 (previous support zone), where buyers may re-enter.
Key Points:
Strong multi-touch resistance at 4015–4020
Price showing early rejection signs
Bearish correction likely if price fails to break above resistance
Downside targets: 3920, possibly 3900

LiamTrading – Gold compressed at the triangle peak; watch for...LiamTrading – Gold compressed at the triangle peak; watch for a break at 4020 (H2)
After a week of accumulation, the price is pressing into the triangle peak between the descending trendline (from late October) and the ascending trendline (from 11/5). The advantage will lean towards an increase if 4020 is broken and sustained.
Technical Analysis (priority H2, Volume Profile – Trendline – S/R – Fibonacci)
Trendline & Structure
The descending trendline is blocking the recovery waves; the ascending trendline supports the adjustment waves.
Closing the H2 candle above the confluence zone ~4020 will confirm a clear upward movement.
Support / Resistance (S/R)
Main support: 3970–3972 (swing low & “Key level Support”).
Decision zone: 4014–4020 (break–retest zone).
Resistance: 4045 (medium-term), 4050 (supply for scalp orders), upper band 4105–4110.
Volume Profile (recent session / composite)
POC magnet: 4015–4017 → likely to have profit-taking/fluctuations; staying above POC turns this area into a launchpad.
LVN: around 4020 → beautiful break-and-go; failing to hold often pulls back to 4015/4010.
Fibonacci Extension (H2 swing)
1.618 coincides with 4045–4050 → first upward target.
2.272/2.618 creates a liquidity zone 4095–4110 → area may weaken/strong profit-taking.
Today's Trading Scenarios
Scenario 1 – Buy on breakout
Entry: 4020–4022 after closing above trendline + retest holding 4018–4020
SL: 4014
TP: 4045 → 4070 → 4100–4110
Management: Take partial profit at 4045; move SL to break-even when reaching +1R. Staying above 4020 turns POC 4015–4017 into support.
Scenario 1b – Buy on pullback (before breakout, cautious volume)
Entry: 3998–4002 (“400x”) when there is an upward reaction at the ascending trendline
SL: 3988
TP: 4017 → 4045
Note: H2 closes below 3988 → cancel the order.
Scenario 2 – Sell scalp at resistance
Entry: 4048–4052 (confluence of Fibo 1.618 + supply zone)
SL: 4056
TP: 4040 → 4030 → 4020
Note: This is counter-trend. Ignore if H2 closes strongly above 4052.
Summary
The upward bias is confirmed when breaking–holding 4020, opening targets 4045 → 4070 → 4100+. Before that signal, trade within the range respecting POC 4015–4017 and ceiling 4045/4050. Risk per order 0.5–1%, move SL to BE when reaching +1R.

Gold 1H – Pullback Expected as USD Softens After Jobless Claims🟡 XAUUSD – Intraday Trading Plan | by Ryan_TitanTrader
📈 Market Context
Gold is trading within a corrective structure today as the U.S. dollar weakens slightly following higher-than-expected Jobless Claims.
Market sentiment remains mixed ahead of upcoming Fed speeches, which could provide clues about December policy expectations.
• A more hawkish tone could trigger a deeper downside move toward unfilled discount zones.
• Conversely, any dovish signals may push gold into a short-term liquidity grab before resuming its corrective trend.
Liquidity remains concentrated near the $4,030 area, where price may tap into resting buy-side liquidity before forming the next bearish leg.
🔎 Technical Analysis (1H / SMC Style)
• Structure: Current bias shows corrective bearish intent following recent ChoCH → BOS sequence on H1.
• Premium Zone: The 4030–4028 region aligns with an unmitigated H1 supply — ideal for continuation shorts.
• Liquidity Sweep: Price may reach 4030 to sweep early breakout buyers before confirming downside continuation.
• Discount Zone: Strong demand sits at 3932–3934, overlapping with previous bullish displacement and unmitigated demand.
🔴 Sell Setup
• Entry: 4030 – 4028
• Stop-Loss: 4040
• Take-Profit Targets: → 3980 → 3964 → 3934 (major demand zone)
🟢 Buy Setup (Countertrend Reaction)
• Entry: 3932 – 3934
• Stop-Loss: 3925
• Take-Profit Targets: → 3964→ 3995 → 4020
(Only valid if liquidity sweep and bullish reaction occur at the demand zone)
⚠️ Risk Management Notes
• Wait for M15 BOS/ChoCH confirmation at both zones to avoid premature entries.
• Avoid trading directly at the minor support around 3964 — it is not a valid SMC entry zone.
• Prioritize the sell setup; intraday bias remains corrective-bearish within a broader range.
• Secure partial profits at the first liquidity target and trail stops according to structure.
✅ Summary
Gold is likely to seek premium liquidity near 4030 before resuming its corrective move lower.
The 4030–4028 supply area offers a clean continuation-short entry, while 3932–3934 remains the strongest discount zone for reactive long setups.
Stay adaptable — the market maintains a mild bearish tone while waiting for further Fed guidance.
FOLLOW RYAN_TITANTRADER for daily SMC setups ⚡

XAUUSD – WAITING FOR CONFIRMATION OF UPTREND – TARGET 4050 💛 XAUUSD – WAITING FOR CONFIRMATION OF UPTREND – TARGET 4050 🎯
🌤 1. Overview
Hello everyone 💬
Gold today is still in a phase of hesitation – waiting for signals to confirm a new trend.
On the H2 chart, the price has broken the downtrend line and is retesting this line. The structure of “higher lows” indicates that buying power is gradually gaining the upper hand.
The previous peak around 4018 is currently the decisive point for the trend – if the price confirms a breakout above, the uptrend could extend towards the 4050 area.
Currently, the market is fluctuating within the range of 3964 – 4018, and needs to break out of this range to determine a clearer direction.
💹 2. ICT Perspective
📈 The price has broken the downtrend line and retested the structure on the H2 chart – an early signal for the potential formation of an uptrend.
🟣 The 3964–4018 area is a short-term liquidity accumulation zone before the price expands.
🔹 OB 4040–4042 coincides with significant resistance, suitable for short sell (scalp) orders if there is a strong reaction.
💫 When the price exceeds 4018, the uptrend structure will be confirmed and the expansion target could head towards 4050 – 4077.
🎯 3. Reference Trading Plan
💖 BUY Scenario (priority when confirmed)
Entry: above 4018 | SL: 4011
TP: 4025 – 4033 – 4050 – 4077
💢 Short SELL Scenario (scalping)
Entry: 4040–4042 | SL: 4046
TP: 4022 – 4015 – 3998
⚠️ 4. Important Notes
Clear confirmation is needed when breaking the 4018 area before entering a buy order.
If the price continues to fluctuate within the 3964–4018 range, trading should be limited.
Today is Friday, manage risk more strictly, prioritize accuracy in each order.
🌷 5. Conclusion & Interaction with LanaM2
Gold is showing positive signals 💛
Be patient and wait for reactions around the 4018 area – this could be the start of a new uptrend if clearly confirmed.

Gold Price Outlook – Trade Setup (XAU/USD)📊 Technical Structure
OANDA:XAUUSD Gold (XAU/USD) trades near $3,996, struggling to gain clear direction after a short-lived rebound. The chart shows price capped by a descending trendline and the Resistance Zone at $4,001–$4,005, while Support lies between $3,977–$3,981.
Technically, gold remains under mild downward pressure. Unless the price achieves sustained acceptance above $4,006, rallies are likely to attract sellers. A break below $3,980 could trigger fresh momentum toward $3,965, while holding above $4,000 may allow brief consolidation before another leg lower.
🎯 Trade Setup
Idea: Sell near resistance amid capped bullish momentum.
Entry: $4,000 – $4,005
Stop Loss: $4,006
Take Profit 1: $3,981
Take Profit 2: $3,977
Risk–Reward Ratio: ≈ 1 : 5.13
If gold decisively closes above $4,010, the short setup becomes invalid, signalling renewed upside toward $4,020.
🌐 Macro Background
Gold prices are finding moderate support as safe-haven flows return amid political uncertainty and weak U.S. data, while Fed rate cut expectations underpin sentiment.
As FXStreet’s Haresh Menghani reports, “Concerns over the economic fallout from the prolonged U.S. government shutdown and renewed Fed rate cut bets drive safe-haven demand for gold.” 【FXStreet】
Safe-Haven Demand: With the U.S. government shutdown entering its 38th day, investor sentiment remains cautious. The Congressional Budget Office estimates a 1–2% hit to GDP if the impasse continues.
Legal and Policy Uncertainty: The U.S. Supreme Court’s review of Trump’s 1977 emergency powers–based tariffs adds legal uncertainty to trade outlook, further boosting gold’s defensive appeal.
Labor Market Weakness: Private data from Revelio Labs indicated a net job loss of 9,100 in October, while government payrolls declined by over 22,000, pointing to labor market cooling.
Fed Rate Cut Bets: The CME FedWatch Tool now shows a 67% probability of a December rate cut, up from 60% a week earlier. This weighed on the U.S. Dollar, supporting gold despite intermittent profit-taking.
However, with gold struggling to break cleanly above $4,000, traders remain cautious—suggesting a “fade-the-rally” approach is still favoured until clear directional confirmation.
🔑 Key Technical Levels
Resistance: $4,001 – $4,005
Support: $3,977 – $3,981
Psychological Level: $4,000
📌 Trade Summary
Gold’s momentum remains mixed—safe-haven flows and Fed cut bets support dips, but strong resistance near $4,000 continues to cap rallies. The short bias remains valid below $4,006, with room for a move toward $3,970 or lower if sellers regain control.
⚠️ Disclaimer
This analysis is for reference only and does not constitute trading advice. Trading involves significant risk, and proper risk management is essential.

XAUUSD: Daily OTE & CRT Setup - Targeting the DrawdownTimeframe: Daily (1D) Chart Analysis: Smart Money Concepts (SMC) / ICT
Gold (XAUUSD) is setting up a high-probability move as it consolidates beneath the recent Daily OTE High. The daily candle is painting a potential CRT Manipulation phase before a distribution down to clear liquidity.
The Setup: Targeting the CRT Drawdown
Current Range (CRT): Price is currently held within the range of the last major daily candle, suggesting Accumulation/Distribution is in progress.
OTE High Resistance: The overhead resistance at $3,991.82 (OTE High) is critical. A potential short-term sweep above this level (the Manipulation phase of CRT) could occur to grab liquidity before the main move.
The Liquidity Target: The projected path indicates a clear run to the Daily OTE Major Low at $3,929.78. This level is a major magnet for liquidity and represents an excellent area for the next Accumulation phase and a potential long entry.
🎯 Trade Plan:
Bearish Bias: Favor a move down toward the $3,929.78 zone.
High-Probability Entry: Wait for price to enter the lower OTE zone at $3,929.78 and look for a lower-timeframe Market Structure Shift (MSS) or bullish Displacement for a long entry confirmation.
The path of least resistance is lower to mitigate the recent Daily high and collect the sell-side liquidity.
Greetings,
MrYounity
