XAU/USD (Gold) 1H: Bullish BOS & Supply Zone Testthe price of Gold attempting to move higher after a significant drop earlier in the week. The key elements highlighted are:
Current Price Action: The price is currently trading around $3,987.20 and is testing a key resistance zone.
1H Supply Zone: A supply zone is identified between roughly $3,990 and $4,000. This area represents a concentration of selling pressure.
Break of Structure (BOS): There are multiple "BOS" labels, which indicate a Change of Character (CHoCH) or continuation of the trend.
The recent upward move has caused a BOS just below the supply zone, signaling an immediate shift towards bullish momentum.
1H Order Block (OB): A bullish Order Block (OB) or demand zone is identified at the bottom of the recent move, roughly between $3,930 and $3,950. This is a likely area for buyers to step in if the price retraces.
Stop-Loss Hunt (SSS): The "SSS" (likely standing for Sell-Side Liquidity or Stop-Loss Sweep) indicates an area of liquidity that could be targeted before the price moves up.
Bullish Scenario: The large arrow suggests a strong bullish expectation. The price is anticipated to break through the immediate 1H Supply zone (breaking the BOS at the high) and continue moving higher, potentially targeting levels above $4,040.
Xauusdanalysis

Gold: Support at 4006–3994, Resistance Near 4030Yesterday, gold broke above the 30-minute MA60 resistance and then pulled back to retest the level, successfully turning it into support. After confirming the support, price continued to grind higher today, reaching around 4020. The MA60 remains the core support for this upward structure. Unless the market enters a strong one-way rally, a pullback is likely, with the MA20/MA30 serving as secondary support levels during the process.
On the 4-hour chart, price is currently testing the MA60 resistance while moving averages still maintain a bullish alignment. If price can successfully complete a resistance-to-support shift around the 4006-3994 zone on the 4H timeframe, it may open the door for a move toward the 4080-4100 resistance region. The first key resistance sits near 4030. Therefore, if price pulls back after testing 4030 but holds above the 4006-3994 support zone, it will retain potential to test 4050/4080-4100 area.

Gold: High VolatilityYesterday, gold’s main structure followed a consolidation path, with the focus of its short-term structure edging slightly higher. The risk of price volatility today has increased. Combining the daily and hourly chart trends, the risk of volatility for gold will be very high in the next two days. Subjectively, we temporarily maintain the expectation of a technical correction pullback. Gold’s bullish performance has not been particularly strong, and with heavy resistance above, the trend has not reversed.
From the 4-hour chart, focus on the short-term resistance at the 4010 level, with secondary resistance at 4020-4025. For support, watch the short-term level at 3960-3970 and the key previous low support at 3888-3890. The bull-bear dividing line remains the 4040-4055 range. As long as this resistance range is not broken, I believe the trend has not reversed,on the contrary, any rebound presents opportunities to enter short positions.
We can enter short orders when rebounds encounter pressure. Operationally, it is recommended to continue shorting as long as rebounds fail to break key resistances.
Trading Strategy:
Sell 4010 - 4020
TP 3970 - 3960 - 3950
Buy 3920 - 3930
TP 3950 - 3960 - 3970

LiamTrading – Gold Confirms Medium-Term UptrendLiamTrading – Gold Confirms Medium-Term Uptrend
Gold has officially broken through the descending trendline, confirming a transition to a medium-term uptrend. After a prolonged accumulation phase, the market is beginning to show clear buying strength, and the potential for an extended rally is gradually forming.
Macroeconomic – Fundamental Analysis
The latest report from the World Gold Council (WGC) shows that central banks continued to increase their gold purchases significantly in September, totaling 39 tons, the highest level since the beginning of the year.
Most notably, the Central Bank of Brazil added 15 tons of gold to its national reserves for the first time this year.
Since the beginning of the year, net purchases by central banks have reached 200 tons, clearly reflecting a shift away from the USD amidst global economic and geopolitical instability. This capital flow provides a solid foundation for gold's medium- and long-term uptrend.
Technical Analysis
On the H2 chart, gold prices have broken the descending trendline, signaling a reversal and establishing a new upward structure.
The 3985–3988 zone is acting as dynamic support, potentially serving as a retest point before prices continue to rise.
The POC of the Volume Profile at the 4015–4017 zone is a short-term resistance, where the market may see profit-taking reactions before breaking higher.
The 4046 mark is considered a decisive area; if surpassed and maintained, the medium-term uptrend will be strongly reinforced.
Today's Trading Scenarios
Scenario 1 – Buy in line with the uptrend:
Entry: 3986–3988 (may wait for retest confirmation)
SL: 3980
TP: 4020 – 4045 – 4090
Scenario 2 – Short sell at resistance:
Entry: 4015–4017
SL: 4023
TP: 4002 – 3986
Summary
Gold is signaling a clear establishment of a medium-term uptrend, supported by central bank buying flows. Traders should prioritize buying positions at strategic support zones and observe price reactions around the POC to confirm the next direction.

Gold Price Surges Above $4,000Gold Price Surges Above $4,000
As the chart shows, XAU/USD climbed above the $4,000 mark today, a move likely driven by:
→ Weakness in the US dollar index – or a pullback from the resistance level discussed in yesterday’s DXY analysis.
→ Concerns over the ongoing US government shutdown – according to media reports, one consequence has been that American airlines began limiting ticket sales in November.
Technical Analysis of XAU/USD
On 28 October, our analysis of gold price movements showed the following:
→ We constructed an ascending channel (marked in blue), illustrating the metal’s remarkable rally from its August low.
→ We suggested that the developing pullback might target the QL line, reinforced by the round-number support at $3,900.
This support zone successfully held, forming a local bottom at point B, after which the price entered a period of consolidation, resembling a symmetrical triangle pattern.
Notably, gold has today broken upward through this triangle (outlined in black). In the broader context, this breakout represents a strong signal from the bulls, suggesting a possible resumption of the 2025 uptrend.
If buying momentum continues, their strength may be tested by:
→ Resistance at $4,045;
→ Resistance near $4,150, which aligns with the 50% retracement of the A→B decline and has previously acted as a reversal zone for XAU/USD.
This article represents the opinion of the Companies operating under the FXOpen brand only. It is not to be construed as an offer, solicitation, or recommendation with respect to products and services provided by the Companies operating under the FXOpen brand, nor is it to be considered financial advice.

XAU/USD 06 November 2025 Intraday AnalysisH4 Analysis:
-> Swing: Bullish.
-> Internal: Bullish.
Analysis and bias remains the same as analysis dated 20 October 2025.
Price has printed as per previous intraday expectation by printing a bearish CHoCH which indicates, but not confirms, bullish pullback phase initiation.
Price is currently trading within an established internal range, however, I will continue to monitor price with regards to depth of pullback.
Intraday expectation:
Price to continue bearish, react at either discount of 50% internal EQ, or H4 supply zone before targeting weak internal high priced at 4,380. 990.
Note:
The Federal Reserve’s sustained dovish stance, coupled with ongoing geopolitical uncertainties, is likely to prolong heightened volatility in the gold market. Given this elevated risk environment, traders should exercise caution and recalibrate risk management strategies to navigate potential price fluctuations effectively.
Additionally, gold pricing remains sensitive to broader macroeconomic developments, including policy decisions under President Trump. Shifts in geopolitical strategy and economic directives could further amplify uncertainty, contributing to market repricing dynamics.
H4 Chart:
M15 Analysis:
-> Swing: Bullish.
-> Internal: Bearish.
You will note how price remains contained in consolidation between a supply and demand range. The rest of my analysis and bias remains the same as bias date 29 October 2025.
As expected, price has printed a bullish CHoCH to indicate bullish pullback phase initiation.
Price is now trading within an established internal range.
Intraday expectation:
Price to continue bullish, react at either premium of internal 50% EQ or M15 demand zone before targeting weak internal low, priced at 3,886.465.
Note:
Gold remains highly volatile amid the Federal Reserve's continued dovish stance, persistent and escalating geopolitical uncertainties. Traders should implement robust risk management strategies and remain vigilant, as price swings may become more pronounced in this elevated volatility environment.
Additionally, President Trump’s tariff announcements, particularly against China, are expected to further amplify market turbulence, potentially triggering sharp price fluctuations and whipsaws.
M15 Chart:

We firmly go long when the market is blindly shorting.#XAUUSD OANDA:XAUUSD TVC:GOLD
From the hourly chart, the short-term gold price has broken through the resistance of the triangle pattern boundary. The market has made its choice, and it is clear that we bulls have won. Therefore, we can continue to execute our trading strategy for the next step. Wait for a pullback to 3995-3985 to buy again, with an initial target of 4020-4030.

ElDoradoFx – GOLD ANALYSIS (06/11/2025, LONDON SESSION)
1️⃣ Market Overview
Gold extends its bullish move into the London session after breaking above $3,995–$4,000, confirming short-term momentum shift from consolidation to continuation.
The metal currently trades near $4,005, where sellers are reacting at a key H1 supply zone aligned with a descending trendline from previous highs.
Overall sentiment remains cautiously bullish, with potential pullbacks expected before continuation toward $4,026–$4,046.
⸻
2️⃣ Technical Breakdown
📆 D1 (Daily):
Price sustains above the 100EMA and remains in an ongoing bullish recovery phase.
RSI ≈ 52, showing neutral-to-bullish structure. A confirmed daily close above $4,012 would strengthen the path to $4,026–$4,046 next.
⏰ H1 (Hourly):
Strong breakout candle above $3,995 with MACD turning positive.
Current resistance seen around $4,010–$4,015. RSI near 68 signals slight overextension, hinting that a minor pullback could occur before another push upward.
🕒 15M–5M (Intraday):
Price broke through descending structure and is now forming rejections near $4,010.
Short-term support sits between $3,985–$3,975, coinciding with EMAs and structure demand.
Expect a possible retest of this area for continuation if buyers remain in control.
⸻
3️⃣ Fibonacci Analysis (Last swing $3,960 → $4,010)
• 38.2% = $3,990
• 50.0% = $3,985
• 61.8% = $3,979
🎯 Golden Zone: $3,990 – $3,979 → Potential bullish continuation area.
⸻
4️⃣ Fundamental Watch
• The US Dollar Index (DXY) is holding below 106, favoring gold’s strength.
• US Jobless Claims and Fed speeches later today may inject volatility during the NY session.
• London is likely to trade inside the $3,985–$4,010 band until new catalysts emerge.
⸻
5️⃣ Analyst Summary
Gold maintains an intraday bullish bias while trading above $3,975.
The ideal scenario is a pullback toward $3,990–$3,979 (Golden Zone) before the next impulsive move up.
A sustained break above $4,015 would confirm fresh momentum targeting $4,026 → $4,046, while failure to hold above $3,975 could shift bias back toward $3,960.
⸻
6️⃣ Final Bias Summary
📈 Primary Bias: Bullish continuation above $3,975
📉 Bearish Invalidity: Below $3,970
🎯 Upside Targets: $4,026 → $4,046 → $4,075
⚠️ Key Zone to Watch: $3,990 – $3,979 (Golden Zone retest area)
⸻
— ElDoradoFx PREMIUM 3.0 Team 🚀

XAU/USD Intraday Plan | Buyers Back in Control?After a period of consolidation, gold has managed to break back above the 3989 level (now turned support) and is currently trading around 4005. Price has also reclaimed the MA50 and is now pushing above the MA200, suggesting buyers are attempting to regain control.
The next resistance sits at 4042 — a confirmed break and hold above this level would open the way for further upside toward 4090.
On the downside, if price fails to hold above 3989, we could see another pullback into the First Reaction Zone (3957–3918). If selling pressure continues we may see the lower support levels tested.
📌 Key Levels to Watch:
Resistance:
4,042
4,090
4,142
Support:
3,989
3,957
3,918
3,884
3,851
🔎 Fundamental Focus
No major economic data releases today. However, a full slate of FOMC member speeches throughout the session could introduce intraday volatility.
Keep in mind that headline risk remains high, and geopolitical / macro sentiment can still move gold even without scheduled news.

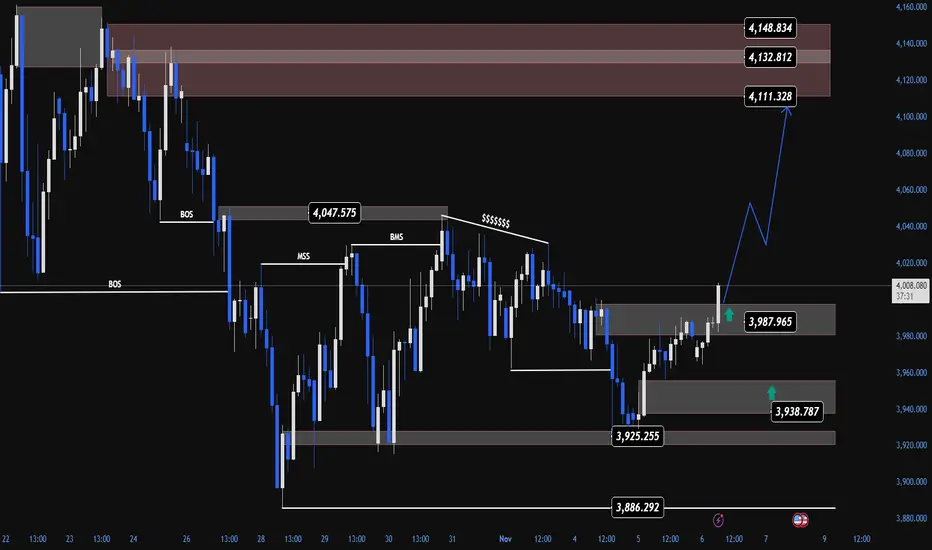
GOLD Smart Money Might Be Preparing for Bullish Structure ShiftGold (XAU/USD) is showing early signs that Smart Money may be shifting from a distribution phase into a short-term accumulation phase.
After a strong bearish leg marked by multiple Breaks of Structure (BOS), recent price behavior now suggests the potential formation of a Market Structure Shift (MSS) — an early indication that institutional flow could be changing direction.
💭 1️⃣ Market Structure – When the Market “Whispers” About Reversal
On the H1 timeframe, we can clearly observe a chain of consecutive BOSs since the 4,150 zone, but what’s intriguing is the reaction around 3,925 – 3,940.
Here, price failed to make new lower lows and began rejecting strongly — leaving several rejection wicks that reveal smart money absorption at discounted prices.
This area represents the discount zone of the current range — where institutions often collect liquidity from trapped sellers before pushing price toward premium levels for redistribution.
The latest Break of Market Structure (BMS) around 3,987 confirms that bearish momentum is weakening, and buyers may be starting to reclaim control in the short term.
🩶 2️⃣ Supply & Demand Zones – Footprints of Smart Money
Karina is currently watching three key zones shaping this market phase:
Demand Zones:
3,938 – 3,925: A strong demand base formed after the initial push upward — acting as a key support if price retraces.
3,986 – 3,988: A minor demand zone formed post-BMS, serving as a potential “reaccumulation point” for the next bullish leg.
Supply Zones:
4,111 – 4,149: Unmitigated Bearish Order Block from the previous decline — the most probable upside target for Smart Money in the current swing.
The projected SMC scenario: Smart Money accumulates at demand → builds liquidity → drives price into the upper supply zones.
🧭 3️⃣ Liquidity Context – Quiet but Purposeful Movement
Gold currently sits within a liquidity equilibrium — a transitional area where both buy- and sell-side liquidity coexist.
Below, 3,886 remains a pocket of sell-side liquidity, while above, large buy-side liquidity pools rest around 4,110 – 4,150.
Smart Money may first collect the remaining sell-side liquidity before triggering a strong upward displacement toward the upper supply zones — following the familiar pattern:
liquidity sweep → displacement → continuation.
🌙 4️⃣ Trade Scenario – Flow With Smart Money, Not Against It
As long as price holds above 3,938 – 3,987, the short-term bias for Karina is bullish.
If price retests these demand zones and forms bullish confirmations (e.g., bullish engulfing or clear order flow shift), it may set the stage for a push toward the 4,111 – 4,148 region.
Entry: 3,938 – 3,987
Stop Loss: 3,925
Take Profit: 4,111 – 4,148
This setup presents roughly a 1:4 R:R, consistent with a buy-side liquidity grab strategy under SMC principles.
🌷 5️⃣ Reflection – When the Market Moves in Silence
After an extended bearish phase, Gold now seems to be accumulating strength in quiet preparation.
This is not a loud reversal — it’s a subtle rebalancing of institutional flow.
To Karina, the market right now feels like a slow, gentle rhythm — calm, deliberate, and full of hidden intent. Sometimes, the key isn’t chasing volatility, but listening to the whispers of Smart Money in the silence of price action. 🌸
This analysis reflects Karina’s personal perspective and is not financial advice.
Do you see the same structure forming? Could this be the early stage of a bullish cycle, or just another liquidity grab? Let’s discuss below 💬
The correction is over; buy gold on pullbacks.#XAUUSD TVC:GOLD OANDA:XAUUSD
With the White House website indicating the ongoing US government shutdown, the normal release of key data such as ADP and NFP may be affected. The news briefly boosted gold prices, leading to a technical rebound in Asian trading.
From the daily chart, the short-term resistance is still around 3980-4000, which is also where the 4H middle line is located. For the bulls to make a full comeback, they need to break through this resistance range and hold above 4000. The current slow and volatile upward trend in gold prices indicates that the bulls still have room to maneuver. In the short term, one can try to continue to be bullish on gold by using the middle line of the hourly chart as a defense. Conservative traders can wait for a pullback to 3970-3955 to try to go long on gold.

XAUUSD Smart Money Zones & Trade Plan — Nov 06, 2025🟡 GOLD ANALYSIS - Updated Nov 06, 2025
OANDA:XAUUSD Gold is consolidating between the $3,950–$4,020 range as the U.S. government shutdown delays key data releases.
DXY is weaker near ~100.15, while the Fed’s recent 25bps cut (3.75–4%) keeps markets uncertain about the next move.
Central Banks remain net buyers (+19t in August, +220t in Q3), led by Poland.
ETF inflows are supporting price while geopolitical tensions continue to fuel safe-haven demand.
🧭 SMART MONEY LEVELS (Valid Today)
🔻 SELL ZONES
• $4,025 – $4,037 → Smart Money Sell Area
• $4,015 – $4,005 → Scalp Sell Area
🔺 BUY ZONES
• $3,938 – $3,915 → Smart Money Buy Accumulation Range
Current Price: ~$3,990
📊 TECHNICAL OUTLOOK
• Holding above $3,950 maintains a mild bullish structure
• Break above $4,020 can retest $4,100
• Break below $3,915 may extend correction toward $3,900
🔮 Timing Insight
Between 22:00–23:00 UK Time, expect a potential bullish liquidity spike near buy zones.
📌 Conclusion
Gold remains in controlled consolidation with a bullish tilt.
Trade reaction to levels, not prediction.
Let liquidity guide entries.

XAU/USD Holds 3,980$ as Bulls Eye Recovery Toward 4,020$🔍 Market Context
Gold steadies near the 3,980$ mark as traders weigh shifting expectations on US interest rates.
The latest ADP employment report showed a modest increase of 42,000 jobs — easing fears of an accelerated slowdown but reinforcing the broader cooling trend in the labor market.
While the Federal Reserve’s rate cuts have supported bullion throughout the year, the prolonged US government shutdown now clouds macro visibility, delaying key economic data.
Despite mixed sentiment, gold remains one of 2025’s strongest-performing assets, up over 50% year-to-date, driven by ETF inflows and central bank demand.
📊 Technical Outlook (H1–H4)
Gold has staged a notable rebound from the 3,947$–3,969$ demand zone, reclaiming short-term structure and approaching the 3,990$–4,000$ liquidity pocket.
This area aligns with the 0.618 Fib retracement and descending trendline resistance — making it the next decision point for intraday traders.
Key Technical Zones:
• 💎 Support: 3,947$ – 3,969$ (Liquidity Base / Re-accumulation)
• 🎯 Resistance: 3,992$ – 4,024$ (Fibo 0.618 + Trendline Confluence)
• ⚙️ Extended Bull Target: 4,028$ – 4,033$ (1.272–1.618 Fibo Expansion)
• ⚠️ Invalidation: Below 3,940$ → shifts bias toward 3,905$ liquidity pool.
🎯 MMFLOW View
Smart money continues to accumulate within the re-accumulation pocket near 3,950$, hinting at latent bullish intent.
If price holds above 3,970$ after today’s consolidation, an extension toward 4,020$–4,033$ remains highly probable.
However, failure to maintain intraday demand could invite another liquidity sweep before a larger push higher.
⚜️ MMFLOW Insight:
“Liquidity reveals intention — structure only confirms it.”

Gold Testing Resistance, Compression Structure Set to Break📊 Market Structure
On the H1 chart, gold is forming a compression structure between the Support 3,944 USD and Resistance 3,989 USD zones.
The recent lows create a series of Higher Lows along the rising trendline – indicating buyers are quietly absorbing supply around the lower region.
However, the 3,989 USD zone remains the central resistance axis , converging with the descending trendline formed from the previous peak (4,028 USD). Each time the price hits this zone, a short-term profit-taking reaction occurs, showing strong defense from sellers.
Below the support zone, the Premium Zone 3,944 USD continues to be the main pivot point – where the price has previously surged strongly in the last two sessions.
If this zone is breached, the short-term bullish structure will be invalidated, opening up the possibility of returning to the Liquidity Zone around 3,921 – 3,892 USD .
Conversely, if the price closes above 3,989 USD , the market will confirm a Bullish Break of Structure (BoS), triggering an extended target towards 4,028 – 4,052 USD .
💎 Key Technical Zones
• Resistance Zone 1: 3,989 USD → main resistance, strong reaction zone.
• Resistance Zone 2: 4,028 – 4,052 USD → upper liquidity target zone.
• Support Zone: 3,944 USD → dynamic support, converging with the rising trendline.
• Liquidity Zone: 3,921 – 3,892 USD → the last zone protecting the bullish structure.
🎯 Trading Scenarios
1️⃣ BUY Scenario – Await Confirmed Breakout:
If the price closes above 3,989 USD and successfully retests:
• Entry: 3,985 – 3,995
• SL: 3,965
• TP1: 4,015
• TP2: 4,028
• TP3: 4,052
2️⃣ SELL Scenario – React at Resistance:
If a reversal candlestick pattern appears at 3,989 USD:
• Entry: 3,985 – 3,990
• SL: 4,000
• TP1: 3,965
• TP2: 3,950
• TP3: 3,944
🧠 Vincent’s View
Gold is in a “compression before breakout” phase, with liquidity concentrated around the 3,989 USD zone.
If this zone is broken, the price could quickly surge to the supply area above 4,028 – 4,052 USD.
If it fails, a price rejection here could pull gold back to the rising trendline at 3,950 USD.
“Compression breeds expansion — let price show which side holds conviction.” ⚜️
⏰ Timeframe: 1H
📅 Updated: 06/11/2025
✍️ Analysis by: Captain Vincent

XAUUSD – DAILY BULLISH SCENARIO – TARGET 4050💛 XAUUSD – DAILY BULLISH SCENARIO – TARGET 4050 🎯
🌤 1. Overview
Hello everyone 💬
Although the larger trend for gold leans towards a downtrend, today I prioritize a bullish scenario in the short term.
On the M30 chart, the price structure is gradually increasing, indicating that short-term capital is shifting towards buyers.
The 3990 zone is a very important area – where a Break of Structure (BOS) has just appeared and is also a strong resistance that has reacted multiple times before.
Price needs to confirm a break above this area to continue expanding the bullish trend.
💹 2. Technical Analysis (ICT Perspective)
📈 An ascending structure (BOS) has formed on M30.
🟣 Buy Zone 3977–3979 coincides with the support trendline – a beautiful confluence point for buyers.
🔹 Resistance zone 3990–4000 is the area to confirm the main direction.
💫 Higher target: Fibonacci Extension 1.618 area around 4049–4050, coinciding with the psychological resistance at 4050.
🎯 3. Reference Trading Plan
💖 Main BUY (priority)
Entry: 3977–3979 | SL: 3970
TP: 3988 – 4000 – 4022 – 4040 – 4050
💢 Short SELL (when price reacts strongly at resistance)
Entry: 4012–4014 | SL: 4020
TP: 4002 – 3988 – 3965
⚠️ 4. Important Notes
Price needs to confirm above the 3990 area to solidify the bullish trend.
If it breaks below 3970, the ascending structure is temporarily invalidated.
Today, prioritize buying according to the capital flow, sell only when there is a clear signal at the resistance zone.
🌷 5. Conclusion & Interaction with LanaM2
Gold is showing positive signals 💛
Be patient and wait for reactions at the Buy Zone 3977–3979, this could be the starting point for a new upward move towards 4050.
This is not an investment recommendation, just a personal view according to the ICT method.
If you find it useful, please 💛 like – 💬 comment – 🔔 follow LanaM2 to update gold analysis with me every day ✨

Elliott Wave Analysis XAUUSD – November 6, 2025
🔹 Momentum
D1 timeframe:
The D1 momentum is now closing in, signaling a possible transition phase with two potential outcomes:
• If today’s D1 candle closes bullish (green): momentum is likely to reverse upward, suggesting a short-term bullish correction.
• If today’s candle closes bearish (red): the downtrend may continue.
The current momentum behavior is unusual, reflecting market indecision between buyers and sellers after a strong decline. As a result, even a small impulse from either side could cause a quick momentum shift.
H4 timeframe:
Momentum on H4 is still in a downward phase but already showing early signs of closing and potential bullish reversal.
• If the current H4 candle closes bearish, the downtrend may extend.
• If it closes bullish and momentum turns upward, price could retest the 4028 zone.
H1 timeframe:
Momentum on H1 is now entering the oversold area, indicating that a reversal could occur within 1–2 more H1 candles.
If momentum turns down again from resistance, this could offer an opportunity for a short-term sell (scalp) around the nearest liquidity zone.
________________________________________
🔹 Wave Structure
D1 timeframe:
As discussed in previous plans, the current structure still forms a W–X–Y correction in yellow, representing wave (4) of the larger cycle.
• The W wave has already reached the 0.382 retracement of wave (3) yellow — which often marks the typical end zone of wave 4.
• Therefore, the following X and Y waves may take longer to complete to maintain time balance within wave (4).
Meanwhile, the X wave (purple) remains relatively shallow, having retraced only about 0.236 of wave W (purple). Combined with the still-uncertain momentum discussed above, a potential rise toward the 4149 zone remains a realistic scenario.
However, if today’s D1 candle closes bearish, price could continue lower to complete wave Y (purple).
Given the current structure favors time balance rather than depth, this Y wave may unfold sideways rather than deeply downward.
At this stage, price is compressed within a narrow range, reflecting market hesitation. It’s best to wait for major catalysts such as the Nonfarm Payrolls report, which could trigger the next decisive move.
________________________________________
H4 timeframe:
The current X wave is developing within a narrow range under the form of a contracting triangle (a–b–c–d–e).
A triangle can only be confirmed once all five internal legs are completed.
Once that happens, a breakout above or below the triangle boundaries will define the next direction.
👉 For now, observation should be prioritized over action.
________________________________________
H1 timeframe:
Wave labeling on H1 is somewhat noisy due to overlapping three-wave structures within a tightening range.
Tentatively, the labeling shows a W–X–Y correction in green, where wave X appears to be a triangle formation.
A final small drop forming wave e could complete this triangle (wave X in green). Once it’s done, a new Y wave in green may start unfolding upward.
________________________________________
🔹 Summary
At present, the market remains noisy and compressed, making it unsuitable for swing entries.
• Avoid swing positions until the structure and momentum become clearer.
• Focus only on short-term scalp setups around key liquidity zones identified earlier.
• Wait for confirmation of direction and structure before committing to larger trades.

Gold price analysis June 11✏️ XAUUSD Analysis — 06/11
Today's gold trading range is being established within 100 prices, limited by the resistance zone of 4031 and the support zone of 3931.
The main trend is still up, so the strategy of prioritizing BUY following the market momentum will be more suitable in this period.
The Keylevel zone of 4031 continues to play an important role — if the buying force is strong enough to break this zone, the next target will be 4150.
On the other hand, it is necessary to observe the price reaction around the trendline and the support zone of yesterday's Asian session to determine whether the buying force is still maintained or not.
📈 Trading Plan
BUY around 3984
BUY when there is a price rejection signal at support 3931
BUY DCA when price breaks 4031
🎯 Target: 4150
⚠️ Risk: when price breaks the trendline and closes the candle below 3930

Gold Price Outlook – Trade Setup (XAU/USD)📊 Technical Structure
OANDA:XAUUSD Gold (XAU/USD) continues to face resistance below the $3,995–$3,993 Resistance Zone, with repeated rejections suggesting weakening bullish momentum. Price action has formed lower highs near $3,990, signalling potential exhaustion.
The Support Zone sits around $3,929–$3,938, which previously acted as a springboard for short-term rebounds. The current structure favours a bearish correction, particularly if price fails to reclaim $3,995 on a sustained basis. A clean break below $3,950 would confirm bearish continuation toward the $3,930 area.
🎯 Trade Setup
Idea: Sell near resistance, target a drop toward support.
Entry: $3,985 – $3,993 (Resistance Zone retest)
Stop Loss: $3,996
Take Profit 1: $3,950
Take Profit 2: $3,930
Risk–Reward Ratio: ≈ 1 : 5.2
A break above $3,996 would invalidate the short setup and could open the door to retest $4,030.
🌐 Macro Background
Gold prices slipped to around $3,970 in Thursday’s Asian session, weighed down by stronger-than-expected US private payroll data and a resilient US Dollar.
As FXStreet’s Lallalit Srijandorn noted, “Gold edges lower below $4,000 as private payrolls rebound in October.” 【FXStreet】
ADP Employment Data: US companies added 42,000 jobs in October, rebounding from the previous month’s contraction, suggesting stabilization in the labor market. This data supports the Fed’s cautious tone and trims expectations for near-term rate cuts.
Fed Commentary: Several Fed officials, including Michael Barr, John Williams, and Christopher Waller, are scheduled to speak later today. Any hawkish remarks reinforcing the “higher for longer” narrative could further strengthen the USD and pressure gold.
Government Shutdown: The US government shutdown, now at 37 days, marks the longest in history. Political gridlock could lend some safe-haven support to gold, but so far, the impact has been muted compared to stronger USD dynamics.
In short, with the US labour market improving and Fed officials maintaining caution, gold’s upside remains limited, while macro bias supports near-term weakness.
🔑 Key Technical Levels
Resistance: $3,985 – $3,996
Support: $3,929 – $3,938
Psychological Level: $4,000
📌 Trade Summary
Gold (XAU/USD) remains under pressure below $4,000 as bullish momentum fades. The setup favours a short position from the $3,985–$3,993 zone, targeting a decline toward $3,930. A sustained break above $3,996 would invalidate this bias and shift focus to $4,030 resistance.
⚠️ Disclaimer
This analysis is for reference only and does not constitute trading advice. Trading involves significant risk, and proper risk management is essential.

Gold's Potential Turtle Soup: Riding the CRT Wave?🐢 Gold's Potential Turtle Soup: Riding the CRT Wave?
The chart for XAU/USD (Gold) is showing an intriguing setup on the 15-minute timeframe that combines several high-probability concepts.
🌊 The CRT Foundation
Consolidation (C): Price recently saw a strong move up into the CRTH (Consolidation Resistance/High) at approximately $3,983 - $3,987. This area represents a clear high of recent structure.
Retracement (R): We've seen a sharp retracement/sell-off after testing the high, creating a noticeable FVG (Fair Value Gap).
Trend (T): The overall context suggests an underlying bullish trend, meaning this retracement could be fuel for the next leg up.
🥣 The Turtle Soup Setup
The sharp drop has set the stage for a classic Turtle Soup scenario. This pattern typically occurs when a high or low is clearly broken, inducing retail traders to jump onto the perceived breakout, only for the price to quickly reverse.
The recent low at $3,958.19 (CRTL - Consolidation Low) is our target. If price drops to break this low, it will likely trap early shorts.
The "Potential KGD forming" (Kill Zone Draw) is strategically positioned to indicate where Smart Money might be looking to step in.
🎯 My Trade Thesis
I'm watching for a fake-out:
Slight break below the CRTL ($3,958.19) to trigger stop losses and attract shorts (Turtle Soup Entry).
A sharp reversal back above the CRTL, preferably reacting off a deeper liquidity zone.
Target: A move back up to fill the FVG and re-test the CRTH for a potential final push toward $4,000+.
Invalidation: A strong, decisive close well below the CRTL, indicating a genuine structural break.
Greetings,
MrYounity

Gold Price Breakdown Setup Toward 3960 SupportGold price is trading near 3982, forming higher highs along a trend line. A potential breakdown below the trend line could trigger a move toward 3960 and 3929 support zones.

XAU/USD – Gold Forms New Liquidity Low, Buyers Return🔍 Market Context
Gold has completed a significant liquidity sweep around the 3,929 – 3,921 USD zone, clearing out the stop-losses of weak buyers before bouncing back strongly.
The bullish candle reaction at this zone indicates strong absorption from large capital flows, opening the possibility of forming a technical recovery wave towards the supply zone (OB – FVG) above.
In the short term, the market structure temporarily shifts to a bullish bias , as long as the price holds above this Liquidity Zone.
💎 Key Technical Zones
• Liquidity Sweep Zone: 3,929 – 3,921 USD → newly swept liquidity low, acting as main support.
• FVG 1: 3,951 – 3,959 USD → first target of the recovery wave.
• FVG 2: 3,977 – 3,985 USD → unfilled price balance zone.
• Order Block: 3,995 – 4,022 USD → strong supply resistance, expected reaction upon retest.
• Resistance Zone: 4,025 – 4,045 USD → watch for candle reactions to confirm upward momentum or reversal.
🎯 Trading Scenarios
1️⃣ BUY Setup – Liquidity Sweep Retest
• Entry: 3,932 – 3,922 USD (pullback to sweep zone)
• Stop Loss: below 3,912 USD
• Take Profit:
TP1: 3,965
TP2: 3,975
TP3: 3,987
TP4: 3,995
TP5: 4,022
➡️ “Buy the discount” strategy by Smart Money: buy after liquidity sweep to catch the technical rebound.
2️⃣ SELL Reaction – OB 4,022 USD
If the price approaches the OB 3,995 – 4,022 USD zone and shows reversal signals (strong rejection, bearish engulfing candle),
→ consider opening a short-term sell (counter-trend scalp)
• Entry: 4,015 – 4,020
• SL: 4,030
• TP: 3,990 → 3,970 → 3,940
⚙️ Market Structure
• Temporary uptrend line remains intact.
• Liquidity has been swept at the old low → confirming bullish ChoCH .
• Confluence structure of FVG + OB + trendline creates favorable conditions for recovery momentum.
📈 Summary
Gold has completed the old low liquidity sweep and is in a technical recovery phase.
As long as the price stays above 3,921 USD, the short-term trend leans towards bullish retracement .
Observe price reactions at the FVG 3,975 – 3,995 USD zone to determine buyer strength.
🔥 “Liquidity fuels direction — once the weak hands are out, the real move begins.”
⏰ Timeframe: 1H
📅 Updated: 05/11/2025
✍️ Analysis by: Captain Vincent

XAUUSD LONG-2 HIGH ACCURACY ( NOV 05, 2025 )If you have doubt on our trades you can test in demo.
OANDA:XAUUSD LONG
TP: 3987.065
SL: 3951.327
Trade Ideas:
Idea is clearly shown on chart + we have some secret psychologies and tools behind this.
Trade Signal:
I provide trade signals here so follow my account and you can check my previous analysis. So don't miss trade opportunity so follow must.

XAUUSD - Time to buy...XAUUSD was in a short term downtrend for a few weeks but has now shown some clear bullish movements ahead. XAUUSD (Gold) has broken out of a downward trend channel that was acting as strong resistance, The price is very likely to head to the next resistance level which is market as the take profit zone (green line). Time to buy!
