Gold (XAUUSD) – 31 Oct | Key Demand Zones in Focus🟡 Gold (XAUUSD) Analysis – 31 October
Hello Disciplined Traders,
Welcome to the Chart Is Mirror Community 👋
Market Context
• As per our yesterday’s analysis , the market did not retest our POI zone but instead took support from the double bottom / W-pattern key level around 3960 , breaking structure above 4030.5 .
• This move confirms that M15 is now fully uptrend , aligned with the ongoing H4 pullback phase .
Key Observations
• Today, our first buying zone is the 3975.5 – 3960.5 demand zone .
• The next potential demand area lies lower at the 3937.7 – 3930 OB , as marked in yesterday’s analysis.
• There is a high probability that price may sweep liquidity below 3975.5 – 3960.5 before resuming upside momentum toward new highs.
Execution Plan
• If price pulls back to the 3975.5 – 3960.5 zone and respects it with LTF bullish confirmation , we will execute our long setup accordingly.
• If price continues lower, observe how it reacts around the 3937.7 – 3930 OB . Enter only after clear LTF confirmation .
• The market remains volatile — manage your position size and risk accordingly .
Patience before confirmation is the trader’s true stillness.
📘 Shared by @ChartIsMirror
Xauusdanalysis

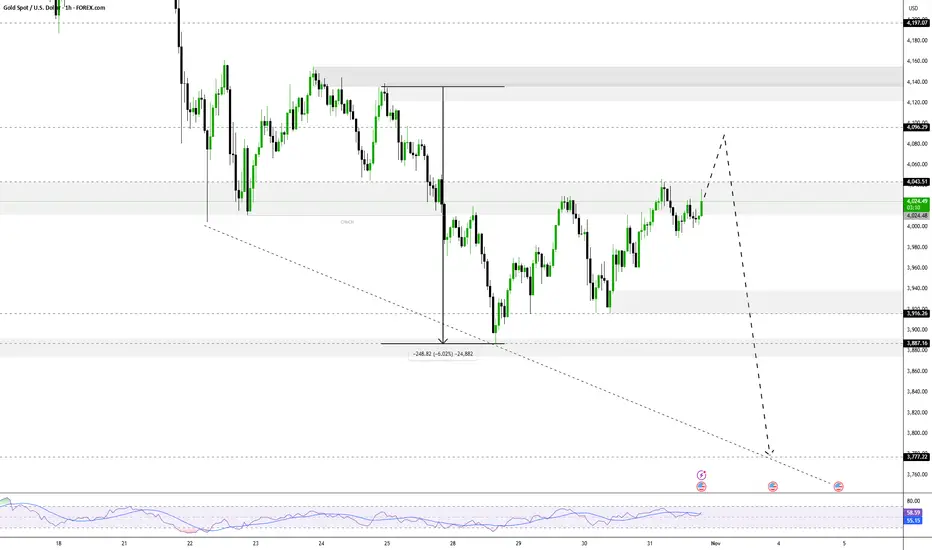
XAUUSD BEARISH REVERSAL SETUP FROM SUPPLY ZONE🔍 Key Observations:
1. Market Structure Shift:
A Change of Character (CHoCH) has occurred near the upper boundary of the ascending channel.
This indicates a potential shift from bullish to bearish momentum.
2. Liquidity & Supply Zone:
The red zone near $4,044 – $4,018 acts as a supply zone or bearish order block.
Price has reacted from this level, rejecting higher prices.
3. Entry & Targets:
Entry: Around $4,011 – $4,018 (current zone)
Stop Loss: Above the recent high near $4,044
First Target (TP1): $3,977 – local liquidity zone
Second Target (TP2): $3,930 – $3,915 major demand area / imbalance fill zone
4. Channel Breakdown Potential:
If the price closes below the lower trendline of the ascending channel, a strong bearish continuation toward the lower targets is expected.
5. Smart Money Concept (SMC) View:
The chart aligns with liquidity grab above highs, followed by CHoCH, suggesting smart money selling pressure.
A retracement to premium zones has already happened, and distribution is likely underway.
📉 Bearish Outlook Summary:
Bias: Bearish
Entry Zone: 4,011 – 4,018
Stop Loss: 4,044
Target 1: 3,977
Target 2: 3,930 – 3,915
Invalidation: Break and close above 4,045 would negate bearish setup.

How to trade gold stably as the weekly and monthly charts close?#XAUUSD TVC:GOLD OANDA:XAUUSD
As we expected, gold broke through the previous strong resistance at 4030 and continued its bullish trend, reaching a high of 4046, very close to our target of 4050. Although the price of gold retreated somewhat after the brief surge, from the daily chart, the short-term price of gold is still above the MA5 moving average, while from the 4-hour chart, the middle band coincides with the MA20. Therefore, I don't think this means the bulls have given up; on the contrary, it's more like a way to better accumulate momentum at the bottom. This strategy remains effective, and we can still consider going long on gold when the price retraces to the 3985-3975 range.

(XAU/USD) Bullish Reversal Setup Toward $4,066 Target ZoneThis chart shows the 1-hour price action of Gold (XAU/USD). The price is currently around $3,997 and has bounced from a support trend line. Key support levels are marked at $3,914 and $3,866, while resistance is near $4,030. The chart suggests a potential bullish move toward the target buy zone around $4,066, following a possible retest of the trend line or support area before continuing upward.

GOLG BULLISH BREAKOUT SETUP TARGETING 4030 AFTER STRUCTURAL SHIFEntry Point: Around 3,994 – 4,000 USD — where price retested the demand zone after BOS.
Stop Loss: Below 3,978 USD, just under the last higher low to protect from fakeouts.
Target Zone 1: Around 4,011 USD — short-term resistance and first liquidity area.
Target Zone 2: Around 4,034 USD — strong supply zone and next liquidity pool (EQH zone).
Smart Money Concept (SMC) Insights:
Liquidity Sweep: The chart shows that equal lows (EQL) were swept before bullish structure formed — a common SMC pattern indicating accumulation.
Fair Value Gap (FVG): Price may fill a small imbalance before continuing higher.
Strong High Zone: Around 4,034, which could act as the final liquidity target before a potential pullback.
Trade Idea:
Setup: Bullish continuation after market structure shift.
Risk/Reward: Approximately 1:3 R/R ratio.
Bias: Bullish as long as price holds above 3,978 – 3,980 zone.

GoldXAUUSD
- Resistance Level
- Bullish Channel as an corrective pattern in Long Time Frame
- RSI - Divergence
- Symmetrical Triangle as an corrective pattern in Short Time Frame
- Completed " 12345 " Impulsive Waves and " ABC " Corrective Waves

The gold price is still in the process of correcting Wave 4The gold price is still in the process of correcting Wave 4, and nothing has changed structurally.
Currently, the price continues to respect the corrective zone we have been monitoring, and the internal waves still support the complex WXY pattern. This tells us one thing:
⏳ The correction is not over.
Once Wave 4 is complete, the real opportunity will begin:
✅ First impulse up → confirms trend resumption
✅ Pullback (Wave 2) → optimal entry point
✅ Wave 3 → highest potential reward 🚀
If the price breaks above the current resistance zone from here, we will monitor the alternative count. However, as long as the structure hasn't confirmed it, we remain patient.
Remember:
Corrections are designed to test patience.
Wave 4 is historically the most complex wave; triangles, flats, and complex structures are common.
Remain disciplined. Let the structure settle. The next leg up will be worth the wait.
gold await breakout to buy or sell#XAUUSD we await price to fall below 4017 on 2 times breakout before selling. The price is reforming a new trend.
Sell below 4017 2 times breakout, target 3982, stop loss 4028.
H1 closure above 4030-32 will continue bullish till 4050.
Await for breakout before trading

XAUUSD - Signal#XAUUSD - Signal
H4 - Formation of the 3rd wave + retest of the trend line. Stop behind the local minimum.
Entry: 4030.143
TP: 4119.239 - 4192.840 - 4276.955 - 4485.155
Stop: 3985.872

ElDoradoFx PREMIUM – GOLD ANALYSIS (31/10/2025, US SESSION)
1️⃣ Market Overview
Gold is consolidating near $4,009 ahead of the US Core PCE release — a key inflation figure likely to inject high volatility.
After testing the Golden Zone (4,023–4,008) multiple times, bulls remain in control above 3,995, but momentum has slowed.
Overall structure shows accumulation within a rising channel — suggesting a potential bullish continuation if price breaks above 4,026.
⸻
2️⃣ Technical Breakdown
🟢 D1: Gold remains above the 100 EMA (3,860), showing long-term strength. Short-term retracement from 4,046 with RSI ~51 = neutral pressure.
🟡 H1: Consolidation range 3,995–4,026 forming; 50EMA at 4,008 acting as dynamic support. Price is compressing between EMAs and trendlines.
🔵 15M–5M: RSI climbing from 40→55; MACD showing early bullish histogram; price coiling under 4,014 — ready for expansion.
⸻
3️⃣ Fibonacci Analysis
Last swing: 3,985 → 4,046
• 38.2% ➤ 4,023
• 50.0% ➤ 4,016
• 61.8% ➤ 4,008
🎯 Golden Zone: 4,023 – 4,008 (currently active)
⸻
4️⃣ High-Probability Trade Scenarios
📈 BUY SCENARIO (Main Bias)
✅ Entry Zone: 4,023 – 4,008 (Golden Zone Re-entry)
🎯 Targets: 4,026 → 4,046 → 4,060 → 4,082
🛑 Stop Loss: Below 3,995
⚡ Confirmation: Bullish CHoCH or engulfing on 5M/15M timeframe.
💥 BREAKOUT BUY
Trigger: Break & close above 4,026
Retest: 4,022–4,024
🎯 Targets: 4,046 → 4,060 → 4,082 → 4,100
🛑 SL: Below 4,010
⸻
📉 SELL SCENARIO (Countertrend)
⚠️ Sell Zone: 4,026 – 4,046 (Strong liquidity / supply area)
🎯 Targets: 4,016 → 4,008 → 3,985 → 3,965
🛑 SL: Above 4,050
⚡ Confirmation: RSI divergence or bearish engulfing on rejection.
🚨 BREAKOUT SELL
Trigger: Clean break below 3,985
Retest: 3,995–3,990
🎯 Targets: 3,965 → 3,945 → 3,920
🛑 SL: Above 4,005
⸻
5️⃣ Fundamental Watch
📊 Key Event: US Core PCE (High Impact)
• If inflation prints higher → USD strengthens → possible gold pullback.
• If weaker → USD drops → gold rallies above 4,046.
💵 DXY near 106.20, limiting upside pressure for now.
⚠️ Month-end flows may cause whipsaws and liquidity grabs before direction confirms.
⸻
6️⃣ Key Technical Levels
Resistance: 4,026 / 4,034 / 4,046 / 4,060
Support: 4,016 / 4,008 / 3,995 / 3,985
Golden Zone: 4,023 – 4,008
Break Buy Trigger: > 4,026
Break Sell Trigger: < 3,985
⸻
7️⃣ Analyst Summary
Gold continues to respect the Golden Zone (4,023–4,008) while coiling within a narrowing range.
If buyers defend 4,008–3,995, we can expect continuation toward 4,046–4,060.
Only a confirmed break below 3,985 will flip the bias bearish.
⸻
8️⃣ Final Bias Summary
Primary Bias: 🟢 Bullish above 4,008 → Target 4,046–4,060
Secondary Bias: 🔴 Bearish below 3,985 → Target 3,965–3,945
Volatility: ⚡ High (due to US PCE + month-end rebalancing)
⸻
— ElDoradoFx PREMIUM 3.0 Team 🚀
⸻

Gold Market Update, Smart Money Levels & Macro Insight (29 Oct)OANDA:XAUUSD GOLD ANALYSIS – What’s Moving the Market Today?
Trade with DECRYPTERS | Let Levels Guide Your Moves
🚀 Market Pulse
Gold remains steady near $4,015, consolidating as the U.S. Dollar Index (DXY ~99.25) limits upside momentum amid renewed optimism over trade talks.
The Federal Reserve’s 25bps rate cut, combined with Powell’s cautious tone on future pauses, lifted yields temporarily, pressuring short-term gold sentiment.
Meanwhile, central banks continue strong accumulation, adding roughly 710 tonnes per quarter, led by China (11th consecutive month of buying).
These consistent inflows act as a price floor, keeping gold resilient even during intraday volatility.
🌍 Geopolitics & Safe-Haven Demand
Rising geopolitical risks and tariff concerns have revived gold’s safe-haven appeal.
During uncertainty, gold’s negative correlation to risk assets strengthens, when fear rises, gold shines.
Investors maintain exposure through ETFs and physical holdings, expecting volatility to persist ahead of key macro data.
📊 What to Watch Next
* Nov 1: U.S. Jobs Report (~150K expected)
→ A weaker print may revive rate-cut expectations.
* Nov 13: U.S. CPI Report
→ If core inflation holds near 3.0%, the Fed may pause rate cuts.
* Any flare-up in Middle East tensions or trade issues could trigger sharp rallies from key support zones.
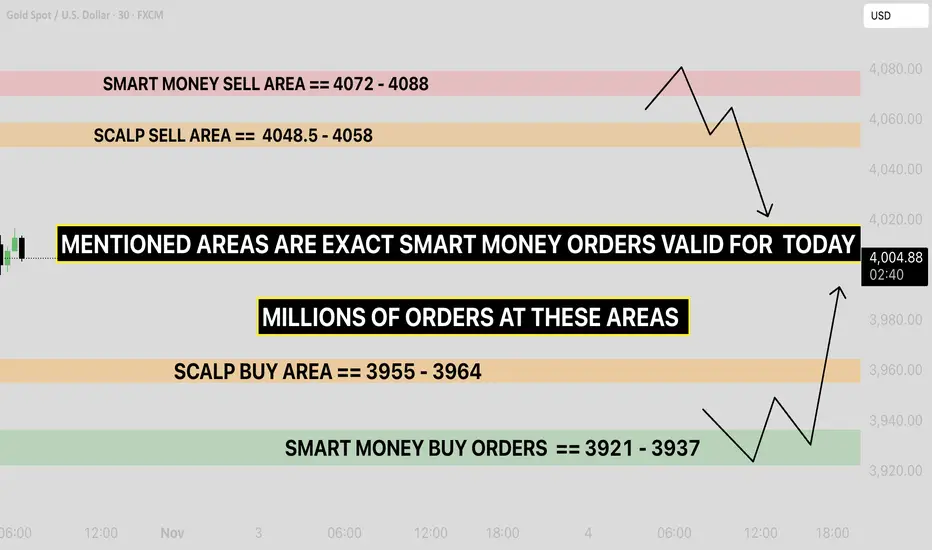
💹 Technical Framework (Smart Money Map)
📈 Current Price: ~$4,015/oz (+0.06%)
📊 Volatility Range: $3,980 – $4,050
* 🟥 Smart Money Sell Area: $4,072 – $4,088
→ Heavy institutional orders, short-term reversal zone.
* 🟧 Scalp Sell Area: $4,048.5 – $4,058
→ Ideal intraday reaction zone.
* 🟨 Scalp Buy Area: $3,955 – $3,964
→ Expect quick liquidity sweeps and bounces.
* 🟩 Smart Money Buy Orders: $3,921 – $3,937
→ Deep liquidity zone, institutional accumulation likely.
🧠 Conclusion – Mild Bullish Bias Within Consolidation
Gold is holding steady between central bank demand and Fed caution.
Bias remains mildly bullish within consolidation — supported by institutional inflows and geopolitical uncertainty.
📌 Above $4,000 → opens room to $4,200.
📌 Below $3,950 → exposes $3,921–$3,937 buy zone.
Stay patient. Let levels confirm direction — trade reaction, not prediction.
XAGUSDHello Traders! 👋
What are your thoughts on Silver ?
Silver entered a corrective phase following its recent rally and is now trading below the resistance zone and the broken trendline.
This structure suggests weakening bullish momentum and a potential continuation to the downside once the pullback completes.
We expect price to complete a pullback toward the broken zone and then resume its downward movement toward the identified support levels.
As long as silver remains below the resistance and trendline, the bearish bias stays valid.
A confirmed break and close above resistance would invalidate this scenario.
Don’t forget to like and share your thoughts in the comments! ❤️

Bearish Continuation Setup with Defined Risk/RewardKey Observations and Trading Setup
Price Action Context: The price recently made a high around $4,045 and appears to be consolidating or forming a lower high after a previous upward move.
Identified Setup: A bearish (sell) trade setup is clearly marked on the chart.
The Entry Price appears to be around $4,009.24 (the current price shown on the OHLC data).
The Stop Loss (the maximum acceptable loss level) is placed at $4,030.62, just above a recent swing high, indicating the point where the bearish bias would be invalidated.
The Target (Take Profit) is set at $3,980.22, indicating the desired level to exit the trade for a profit.
Visual Representation:
The red box highlights the area of risk (above the entry up to the stop loss).
The green box highlights the area of potential reward (below the entry down to the target).
The white arrow clearly illustrates the expected downward price movement.

GOLD Very Near Perfect Place For See , 500 Pips Waiting !Here is My 30 Mins Gold Chart , and here is my opinion , we again Below 4050.00 With 4H Candle and the price come back to retest it ! and we have a 4H Candle closure below it And Perfect Breakout and this give us a very good confirmation , so we have a good confirmation now to can sell after the price go back to retest the broken area between 4050.00 : 4055.00 , and give us a good wicks as previous wicks ! and we can targeting 100 to 200 pips . if we have a daily closure above this area this mean this idea will not be valid anymore .
Reasons To Enter :
1- Perfect Touch For The Area .
2- Clear Bearish Price Action .
3- Bigger T.F Giving Good Bearish P.A .
4- Over Bought .
5- Perfect 30 Mins Closure .

XAU/USD: Bearish Decline to 3827?OANDA:XAUUSD is exhibiting bearish momentum on the 1-hour chart , with price respecting a downward trendline and pulling back toward the EMA 50 (1H) as dynamic resistance, creating a prime short opportunity near the highlighted entry zone amid ongoing consolidation. This setup suggests continuation of the downtrend if sellers push through toward lower supports. 🎯
Entry zone between 3979-4020 for a sell position. Target at 3827 near the support and take profit zone, yielding a risk-reward ratio greater than 1:2.5 . Set a stop loss on a close above 4035 to manage risk. 🌟 Await confirmation with a bearish close below the entry and rising volume, tapping into gold's sensitivity to USD strength.
Fundamentally , this week features the FOMC meeting on October 29, where the Fed's rate decision could bolster the dollar if hawkish tones prevail. Additionally, outcomes from the ongoing Trump-Xi trade talks—kicking off this week in Asia—could spark major market volatility, potentially pressuring gold if a US-China deal materializes. 💡
📝 Trade Plan:
🎯 Entry Zone: 3979 – 4020 (short setup near resistance)
❌ Stop Loss: Close above 4035
✅ Target: 3827 (support / take-profit zone)
💎 Risk-to-Reward: Greater than 1:2.5, offering an excellent downside opportunity for disciplined traders.
What's your view on this gold drop? Comment below! 👇

Range trading, opportunities exist for both bulls and bearsGold prices fluctuated throughout yesterday, breaking through the intraday high in the evening and reaching near the previous high again, ultimately closing positive on the daily chart, essentially at the highest price. During the Asian session, prices rose another $30, touching around 4046, before slightly retreating. Judging from the recent trend of gold prices, the price has been fluctuating and neither the bulls nor the bears have been able to sustain their gains. Gold prices have once again reached high levels. After several rounds of fluctuations of 150 points each, the current support and resistance levels are quite clear. Gold prices are oscillating between 3900 and 4050.
This adjustment and reshuffling is a good thing. It gives those who missed the boat a chance to get on board, and it also slaps those who chased the highs in the face. The game between bulls and bears is itself an extension of the consensus of emotions.
Gold prices extended their rebound, returning to $4,050. This rebound was significant, recovering from a drop of about $500 to a gain of approximately $200. Whether this rebound represents a reversal depends on the weekly closing price. If the weekly candlestick closes as a doji, it indicates that the bulls remain strong. If the weekly candlestick continues to close negative, short-term consolidation and profit-taking will continue.
In volatile markets, both bulls and bears have opportunities; the key lies in the price level. If the Asian session rises, the European session retraces and breaks the low, and the US session surges, it's a bull trap. Once the high point appears, go short. Trading strategy: Sell gold on a rebound to 4015-4020, with a stop loss above 4045 USD, and target 3980-3960 USD on the downside. Watch for further downside targets at $3980-$3960.
XAU/USD 31 October 2025 Intraday AnalysisH4 Analysis:
-> Swing: Bullish.
-> Internal: Bullish.
Analysis and bias remains the same as analysis dated 20 October 2025.
Price has printed as per previous intraday expectation by printing a bearish CHoCH which indicates, but not confirms, bullish pullback phase initiation.
Price is currently trading within an established internal range, however, I will continue to monitor price with regards to depth of pullback.
Intraday expectation:
Price to continue bearish, react at either discount of 50% internal EQ, or H4 supply zone before targeting weak internal high priced at 4,380. 990.
Note:
The Federal Reserve’s sustained dovish stance, coupled with ongoing geopolitical uncertainties, is likely to prolong heightened volatility in the gold market. Given this elevated risk environment, traders should exercise caution and recalibrate risk management strategies to navigate potential price fluctuations effectively.
Additionally, gold pricing remains sensitive to broader macroeconomic developments, including policy decisions under President Trump. Shifts in geopolitical strategy and economic directives could further amplify uncertainty, contributing to market repricing dynamics.
H4 Chart:
M15 Analysis:
-> Swing: Bullish.
-> Internal: Bearish.
Analysis and bias to remain the same as yesterday's bias date 29 October 2025.
As expected, price has printed a bullish CHoCH to indicate bullish pullback phase initiation.
Price is now trading within an established internal range.
Intraday expectation:
Price to continue bullish, react at either premium of internal 50% EQ or M15 demand zone before targeting weak internal low, priced at 3,886.465.
Note:
Gold remains highly volatile amid the Federal Reserve's continued dovish stance, persistent and escalating geopolitical uncertainties. Traders should implement robust risk management strategies and remain vigilant, as price swings may become more pronounced in this elevated volatility environment.
Additionally, President Trump’s tariff announcements, particularly against China, are expected to further amplify market turbulence, potentially triggering sharp price fluctuations and whipsaws.
M15 Chart:

XAUUSD: Bulls vs. Resistance — 4050 Decides the Next MoveIn yesterday’s analysis, I mentioned that after the reversal from the 3920 support zone, Gold (XAUUSD) could continue higher toward the 4050 resistance area.
Indeed, that target has been reached, followed by a 600-pip leg down overnight.
At the moment, the price is resuming its upward move and is trading back above $4,000, around 4025.
Going forward, I expect volatility to remain high. If the bulls fail to sustain the price above 4050, another leg to the downside could follow.
For now, I’m out of the market, waiting to see whether we’ll get another test of 4050 — and more importantly, how the price reacts in that zone. 🚀

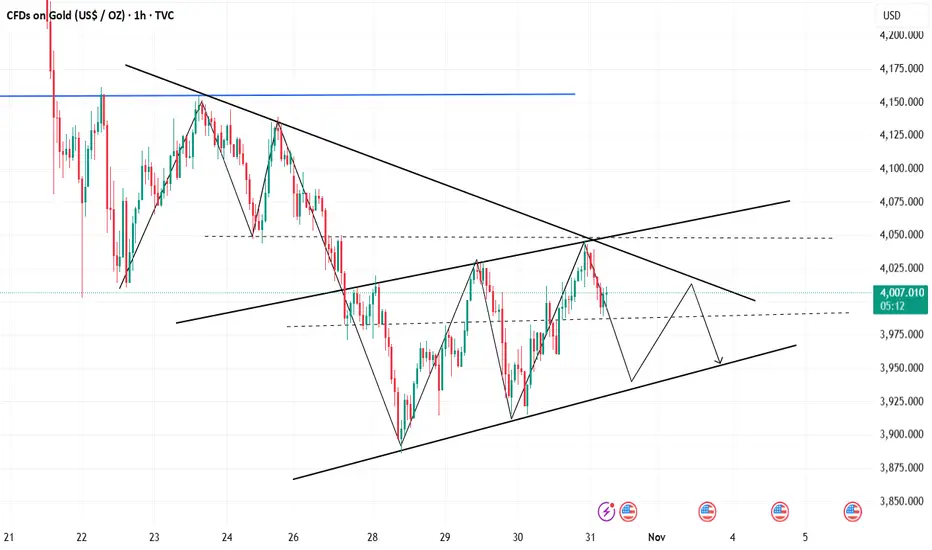
The Yo-Yo Market: Gold Swings Wildly but Goes NowhereRecently, Gold’s volatility has been extreme — with over 1,000+ pip swings up and down. Yet, despite all the loud noise , if we look closer, nothing truly significant has happened since the drop from the 4400 zone to below 4,000.
For most retail traders using stop losses, this type of environment has been extremely challenging — whipsaws in both directions.
However, if we step back and filter out the noise, a clearer structure begins to appear:
________________________________________
🔍 Key Observations
1. Normal Correction Behavior
The sharp drop from the all-time high actually stopped right at the previous ATH from early October — a very common technical behavior, where price retraces into prior calendar-based resistance zones.
2. Below 4K, But Not Broken
Although Gold is currently trading below 4,000, the move under that level is not yet a confirmed breakdown.
3. Strong Rebounds from 3920
Yesterday, price bounced aggressively from the 3920 zone, and this exact reaction repeated twice overnight — showing that buyers are still defending this area.
4. Correction Within the Golden Zone
Despite the dramatic fall, the current retracement sits just above the 61.8% Fibonacci level of the strong bullish leg from late August — technically, a textbook “golden zone” correction.
________________________________________
🎯 Trading Outlook
If we connect all the dots, Gold appears to be finishing a much-needed correction rather than starting a downtrend.
• Short term:
Resistance is found around 3975–3980. A clean break above could open the way to 4030.
• Medium term:
If Gold manages to stabilize above 4,000, the next upside targets are 4050, and possibly 4150 as we move into November.
________________________________________
⚖️ Final Thoughts
Yes, volatility is high — but beneath the surface, Gold is simply completing a natural corrective phase.
As long as 3900-3920 zone holds, the medium-term focus shifts back toward 4150.
🚀

XAU/USD Intraday Plan | Support & Resistance to WatchYesterday’s analysis is playing out as expected — after breaking above the 3987 resistance, gold tested the 4042 level, but failed to sustain momentum and pulled back for a retest of 3987, now acting as short-term support.
We need to see a clear break of either level to confirm direction, otherwise price may continue to range within this zone before the next move.
A break above 4,042 could open the way for a push toward 4095 and 4137, while a break below 3987 would likely trigger a move back toward the Deeper Support Zone (3,944–3,884).
📌 Key levels to watch:
Resistance:
4042
4095
4137
4178
Support:
3987
3944
3884
3820

XAU/USD Intraday Plan|Fed Cut Fails to Lift GoldGold broke above the 3987 resistance yesterday but failed to reach the 4042 resistance level, reversing sharply after the FOMC announcement and dropping back below 3944. The move reflected post-event volatility as markets reacted to the Fed’s cautious tone.
Price is currently trading around 3964, trending just above the MA50 but still below the MA200, suggesting early signs of stabilization while the broader short-term outlook remains uncertain. A confirmed break above 3987 could open the way toward 4042 and 4095, while failure to stay above 3944 may lead to another drop toward 3884–3820, where dip-buyers may look to step in.
📌 Key levels to watch:
Resistance:
3987
4042
4095
4137
Support:
3944
3884
3820
3781
🔎 Fundamental Focus:
The Federal Reserve cut rates by 25bps, bringing the Federal Funds Rate to 4.00%, but Chair Powell’s cautious tone during the press conference dampened market optimism.
Markets reacted with volatility as traders weighed the potential for further easing later this year. Meanwhile, the ongoing U.S. government shutdown and lingering U.S.–China trade tensions continue to cloud sentiment, keeping gold supported on dips as uncertainty remains elevated.

LiamTrading - XAUUSD: Prospect of $5,000 USD and Priority BUY...LiamTrading - XAUUSD: Prospect of $5,000 USD and Priority BUY Strategy at POC $3973
Hello traders community,
Gold is positioned between an extremely optimistic long-term outlook (forecast of $5,000 USD in the next 12-18 months by Bank of America) and short-term technical adjustments.
Although Gold has broken the upward trendline, a sustainable downward trend has not been confirmed.
BUY positions are still prioritized!
🔥 LONG-TERM CONTEXT & INFLATION
Long-Term Driver: Gold prices adjusted for inflation have DOUBLED over the past 4 years.
Highlight: Gold reinforces its role as an anti-inflation asset as real prices soar to all-time highs.
📊 DETAILED TRADING PLAN (ACTION PLAN)
Strategy: Buy at POC Zone to leverage liquidity advantage.
🟢 BUY Scenario (BUY Primary) - Buy at High Value Zone
Logic: The $3973 - 3975$ zone is right above the Buy POC (highest value zone).
Entry (BUY): $3973 - 3975$
SL: $3968$
TP1: $3988$ | TP2: $4000
Buy Target 2: Buy when price retests the trendline around $4002$.
🔴 SELL Scenario (SELL Scalping) - Preemptive strike at resistance zone
Entry (SELL): $4032 - 4034$
SL: $4040$
TP1: $4022$ | TP2: $4015
📌 SUMMARY & DISCIPLINE (Liam's Note)With the $5,000 USD forecast and inflation factors, the risk of SELL is increasing.
Focus on BUY at POC $3973$ and absolute SL.
Trade responsibly and with discipline!

XAU/USD – Gold Maintains Short-Term Uptrend, Target $4,108🔍 Market Context
Gold continues to uphold a short-term bullish structure after forming a clear Change of Character (ChoCH) around the 3,926 USD area.
Buyers are in control as prices consistently create higher lows and react positively at the Order Block + Support Trendline zone.
As long as prices remain above the 3,940–3,926 USD range, the bullish structure is preserved.
💎 Key Technical Zones
• Order Block Bullish: 3,926 USD → main support zone, confluence with rising trendline.
• Fair Value Gap (FVG): 3,942 – 3,972 USD → potential liquidity absorption zone.
• Resistance Zone: 4,032 USD → short-term barrier, needs to break to confirm continued upward momentum.
• Liquidity Zone: 4,108 USD → extended target if the above resistance is breached.
🎯 Trading Scenarios
1️⃣ BUY Setup – Prioritize catching the retracement from the support zone
• Entry: 3,942 – 3,926 USD
• Stop Loss: 3,910 USD
• Take Profit:
– TP1: 3,972
– TP2: 4,032
– TP3: 4,064
– TP4: 4,108
✳️ “Buy the discount” – Prioritize entries at the confluence of OB + FVG to follow Smart Money flow.
2️⃣ SELL Scalp – Short-term at resistance zone
• Entry: 4,032 – 4,048 USD
• Stop Loss: 4,060 USD
• Take Profit:
– TP1: 4,010
– TP2: 3,972
– TP3: 3,942
✳️ “Sell the premium” – Only activate if a clear price rejection signal appears at resistance.
💬 Summary
The current structure remains bullish short-term with the 3,926 USD area as the key invalidation zone .
As long as prices stay above the trendline, the immediate target is the 4,108 USD liquidity zone.
Optimal strategy: Buy on dip – Sell on reaction.
💡 Today's Tagline:
“Smart Money buys fear, sells greed — follow the footprints, not the noise.”
⏰ Timeframe: 1H
📅 Update: 31/10/2025
✍️ Analysis by: Captain Vincent
