GOLD - Sell off when u see a crowd entering - always workingGOLD - Sell off when u see a crowd entering - always working
New that in Argentina people buying al ot of phisical GOLD was a perfect signal of retail FOMO
$3400 isa key support
Xauusdanalysis

Gold price analysis October 28📉 GOLD UPDATE – Correction Phase Continues
Gold remains under bearish pressure as buyers failed to hold the price above 4057, confirming that sellers are back in control. The market structure now supports a continued corrective move toward the 3955 support zone during the European session. A further breakdown below this level could open the way to 3892, which serves as the next key downside target.
For now, the focus should remain on SELL setups during the London session. Any BUY positions would be considered counter-trend and only valid if price shows strong rejection signals at key supports or reclaims the 4057 zone.
🎯 Trading Plan
SELL trigger: Price rejection at resistance zone 4050
SELL DCA: On break below 3955
Target: 3890

Gold Extends Its Decline Below the $4,000 LevelGold Extends Its Decline Below the $4,000 Level
As the chart shows, the XAU/USD quote has fallen below $3,945 today — its lowest level since 6 October. The downward momentum is being driven by traders’ caution ahead of two key events:
→ the U.S. Federal Reserve’s upcoming interest rate decision;
→ the meeting between U.S. and Chinese leaders, which could help ease tensions between the world’s two largest economies.
Technical Analysis of the XAU/USD Chart
The ascending channel (shown in blue) illustrates gold’s remarkable rally from the 20 August low (point A):
→ throughout September, the median line acted as strong support;
→ the peak at point B coincided with the upper boundary of the channel;
→ the QH line — dividing the upper half into quarters — alternated between resistance and support.
The black lines mark the consolidation zone observed between 21 and 27 October:
→ its lower boundary aligns with the median;
→ the shape resembles a Symmetrical Triangle pattern, which has since been broken to the downside.
The chart highlights the confidence of sellers — bears managed to push prices through the key support area defined by:
→ the psychological $4,000 level;
→ the 0.382 Fibonacci retracement (indicated by the orange arrow).
The next potential target for the ongoing decline lies near the QL line, which coincides with the round-number level of $3,900. However, this may only serve as a temporary barrier before bears attempt to drive the price lower — towards the bottom boundary of the primary channel.
This article represents the opinion of the Companies operating under the FXOpen brand only. It is not to be construed as an offer, solicitation, or recommendation with respect to products and services provided by the Companies operating under the FXOpen brand, nor is it to be considered financial advice.

ElDoradoFx PREMIUM – GOLD ANALYSIS (28/10/2025, LONDON SESSIONGold extended its bearish continuation during Asia, breaking below 3,940, confirming dominance of sellers. London opens with price sitting near 3,935–3,940, still within the bearish structure that began at 4,106.
Momentum is strongly negative, with EMAs (50/100/200) aligned downward and RSI below 40 across all intraday frames. The market remains inside a descending channel — each recovery is being sold aggressively.
⸻
2️⃣ Technical Breakdown
🔹 Daily (D1)
• Fourth consecutive bearish candle confirms strong downside momentum.
• RSI (46) still neutral but leaning bearish; MACD histogram fully red.
• Price approaching potential higher-timeframe support near 3,900–3,880.
Bias: Bearish correction still in play until 3,880 or D1 reversal candle appears.
🔸 H1
• Structure: clean lower highs (4,106 → 4,048 → 3,997) and lower lows (3,971 → 3,935).
• RSI (27) deeply oversold, signaling possible micro bounce but no reversal yet.
• 100/200 EMA above at 3,990–4,040 acting as strong resistance.
Bias: Bearish below 4,000, corrective pullback likely capped at 3,995–4,010.
🔹 M15
• Extended downtrend channel remains active.
• Every minor pullback rejected under 3,950–3,960.
• MACD shows no bullish divergence yet; sellers still in control.
Bias: Sell pullbacks near resistance levels.
🔹 M5
• Micro CHoCH confirmed lower highs.
• RSI near 30 with weak attempt to rebound.
• Short-term liquidity zone forming 3,930–3,940, potential area for retest before continuation.
Bias: Bearish to neutral; short rallies only if confirmed rejection on M5–M15.
⸻
3️⃣ Fibonacci Analysis (Golden Zone)
Last H1 swing: High 4,106 → Low 3,935
• 🔸 38.2% → 3,990
• 🔸 50% → 4,009
• 🔸 61.8% → 4,028
✅ Golden Zone = 3,990 – 4,028
This zone aligns with the H1 supply area and EMA confluence, making it the optimal retracement level to rejoin the bearish trend.
⸻
4️⃣ High-Probability Trade Scenarios
📉 SELL SCENARIO (High Probability)
• Entry: 3,990 – 4,028 (Golden Zone)
• Stop-Loss: 4,035 – 4,045
• Targets: 3,955 → 3,935 → 3,910 → 3,885
• Confluence: EMA cluster, Fib 61.8%, trendline resistance
• Bias: Strong short continuation if rejection occurs inside Golden Zone
⸻
⚡ BREAKDOWN SELL
• Trigger: Clean H1 candle close below 3,930
• Entry: 3,928 – 3,935 on retest
• Stop-Loss: Above 3,945
• Targets: 3,912 → 3,900 → 3,885
• Bias: Follows continuation of bearish momentum below weak low.
⸻
🟢 COUNTERTREND BUY (Low Probability)
• Trigger: Bullish BOS + strong engulfing candle above 3,960
• Entry: 3,960 – 3,965
• Stop-Loss: 3,940
• Targets: 3,985 → 3,995 → 4,009
• Bias: Only if London forms a liquidity sweep under 3,930 with strong reclaim.
⸻
5️⃣ Fundamental Watch
• No major Asia data; London expected to move with USD Index (DXY) flows.
• DXY above 106 favors continued gold weakness.
• Traders monitoring US GDP & PCE later this week, meaning liquidity could tighten today.
• Expect volatility spikes near London–NY overlap as large players position early.
⸻
6️⃣ Key Technical Levels
Type Price Levels
Resistance 3,960 / 3,975 / 3,990 / 4,009 / 4,028
Support 3,935 / 3,924 / 3,910 / 3,885 / 3,872
Golden Zone 3,990 – 4,028
Breakdown Trigger < 3,930
Bullish Reclaim Trigger > 3,965
⸻
7️⃣ Analyst Summary
The bearish structure remains dominant across all timeframes. Momentum favors continuation toward 3,910–3,885, with the best entry region at 3,990–4,028 Golden Zone.
If London opens with liquidity sweeps below 3,930, wait for a quick retracement to sell at premium pricing.
Only strong reclaim above 3,965 could trigger a short-term intraday recovery to 3,990–4,009 before sellers step in again.
⸻
8️⃣ Final Bias Summary
📉 Primary Bias: Bearish – Sell rallies into 3,990–4,028
📈 Secondary Bias: Bullish only above 3,965 (confirmed reclaim)
🎯 Targets: 3,955 → 3,935 → 3,910 → 3,885
✨ Golden Zone: 3,990 – 4,028
🛑 Invalidation: H1 close above 4,045
⸻
— ElDoradoFx PREMIUM 2.0 Team 🚀
⸻

GOLD (XAU/USD): SHORT SETUP — RIDING THE FINAL BEAR LEG!1. MACRO VIEW: THE FED STALEMATE
The Gold market is being pulled in opposing directions:
Bearish Pull (USD Strength): Positive news on the US-China trade deal reduces safe-haven demand.
Bullish Push (Gold Support): Near-certainty of a 25bps Fed rate cut on Wednesday weakens the USD. Plus, escalating US-Russia geopolitical tension maintains risk appetite for Gold.
Bottom Line: While a weaker USD supports Gold, Technical Analysis suggests a deeper correction must complete first.
2. TECHNICALS: STRUCTURE IS DECIDEDLY BEARISH
Trend Shift: After a strong rally, Gold has broken major support structure, confirming a Bearish Shift in the short-term trend.
Scenario: We anticipate a technical pullback (Pullback) to retest the new resistance level. Once the retest is complete, selling pressure should resume to finish the corrective move.
3. 💡 TRADE STRATEGY (THE SHORT)
We are primarily SELLING (SHORT), positioning for the completion of the corrective cycle:
Ideal Entry Zone (Entry): 3,949.849 (Retesting the broken prior Support, now Resistance)
Take Profit (TP1): 3,929.793
Take Profit (TP2): 3,878.287 – 3,811.333 (Major Demand Zone Target)
Stop Loss (SL): Above 3,949.849 (Above Confirmed Resistance)
⚠️ Warning: Wednesday’s FED rate decision will cause extreme volatility. Risk management is paramount!
Where do you think this final drop will bottom out? Let me know below! 👇
#Gold #XAUUSD #FOMC #TradePlan

LiamTrading - XAUUSD: SCENARIO BEFORE FOMC LiamTrading - XAUUSD: SCENARIO BEFORE FOMC - $3840 Level Awaits Bottom Fishing Reaction Wave
Hello traders community,
The Gold market is showing a strong and sustainable downtrend. We are witnessing a crash after prices broke through key support zones. With the upcoming FOMC event, our strategy is to seek Buy opportunities at deep liquidity zones and continue Selling when prices recover to retest the broken trend.
📰 MACRO ANALYSIS & CASH FLOW CONTEXT
Gold is currently under dual pressure:
Downward Pressure 🔴: Optimism about the US-China trade progress has significantly weakened the demand for Gold, a safe-haven commodity. Spot Gold prices have fallen below $3950, hitting a three-week low, down about 0.78% on the day (28/10).
Short-term Support 🟢: Bets on the possibility of a Fed rate cut continue to weaken the US Dollar (USD), which is the only factor that could potentially support this precious metal.
Conclusion: This tug-of-war makes it difficult to determine the bottom. The bearish scenario remains the top priority.
📊 TECHNICAL ANALYSIS: THE DOWNWAVE CONTINUES
Based on the H4 chart (image_5fa7fa.png):
Current Trend: The price has successfully broken through the key liquidity support zone near $3950 and is continuing its downtrend.
Current Fibonacci Level: The price is touching and reacting at the 1.618 Fibonacci zone (around $3950).
Next Level: The next level Gold is targeting will be the 2.618 Fibonacci zone (around $3840), which is a large liquidity area expected to see a strong reaction.
Main Strategy: We focus on two scenarios: Bottom fishing reaction at 3840 and continuing to Sell when the price recovers.
🎯 DETAILED TRADING PLAN (ACTION PLAN)
We have two detailed scenarios based on the current price level:
🟢 BUY Reversal Scenario
We wait for the price to hit the deep liquidity bottom zone of 3840 to execute a buy order with the expectation of a technical recovery.
Entry Zone: 3840
Stop Loss (SL): 3832 (tight SL)
Take Profit Targets (TP): TP1: $3872 | TP2: $3898 | TP3: $3925 | TP4: $3950
🔴 SELL Retest Scenario
If Gold recovers without breaking the downtrend structure:
Entry Zone: Watch for a Sell retest at $4091
Stop Loss (SL): $4099
Take Profit Targets (TP): TP1: $4065 | TP2: $4033 | TP3: $4004 | TP4: $3965
SUMMARY & DISCIPLINE (Steven's Note)
Gold is in a strong fall ahead of the FOMC, with significant volatility expected. Capturing deep Fibonacci and Liquidity zones is key.
Note: Always adhere to the set Stop Loss. Capital management is the number one priority, risking only 1-2% of the account per trade.
Wishing traders a successful and disciplined new trading week!

Gold Price Outlook – Trade Setup (XAU/USD)📊 Technical Structure
OANDA:XAUUSD Gold (XAU/USD) continues to trade under bearish pressure, dropping to the $3,980–3,940 range, marking its lowest in three weeks. The chart highlights:
Resistance Zone: $3,975 – $3,981 (aligns with a descending trendline).
Support Zone: $3,936 – $3,943, with $3,930 as key downside level.
Price action shows lower highs, suggesting sustained bearish momentum. A corrective bounce into the resistance zone could be met with fresh selling interest.
📌 Trade Setup
Entry: $3,975 – $3,981 (near resistance & trendline)
Stop Loss: $3,986
Take Profit 1: $3,945
Take Profit 2: $3,936
Risk/Reward: ≈ 1 : 3.72
🌍 Macro Background
Gold’s decline is largely driven by renewed US–China trade optimism, which has reduced safe-haven demand. As reported, officials from both sides agreed on a trade deal framework ahead of Trump–Xi talks this week, pressuring gold prices despite weaker USD and dovish Fed expectations. Meanwhile, traders remain cautious ahead of the FOMC meeting (Oct 28–29), where markets have priced in a 96% chance of a 25 bps Fed rate cut.
Adding to the downside pressure, the People’s Bank of China (PBoC) paused gold purchases, while China’s imports fell 17.6% in September, further reducing demand support. However, US Treasury yields remain soft, and JPMorgan projects long-term bullish momentum for gold, forecasting an average $5,055/oz in Q4 2026.
🔑 Key Technical Levels
Resistance: $3,975 / $3,981
Support: $3,943 / $3,936
Breakdown Target: $3,900
📋 Trade Summary
Gold remains under pressure, trading below $4,000 with bearish momentum intact. Short-term rallies toward resistance offer opportunities to sell, targeting the $3,930–3,940 support zone. Market focus shifts to the FOMC decision and US–China talks, which could define gold’s next breakout direction.
⚠️ Disclaimer
This analysis is for reference only and does not constitute trading advice. Trading involves significant risk, and proper risk management is essential.

XAUUSD Crashes 1500 Pips — Key Supports Gone!Gold started the week poorly, dropping around 1500 pips and, more importantly, breaking three key support levels:
• the rising trendline that started back in August,
• the 4020 horizontal support zone,
• and even the psychological 4000 level.
Overnight, the price attempted to reclaim 4000, but failed — currently trading around 3965.
The next immediate support sits at 3945, and even if we see a rebound from here, bulls will need to hold the price firmly above 4000 to have any chance of a reversal.
If this level also fails, the next obvious medium-term target is the 3720–3750 zone.
I m bearish for now, but there isn’t a clean or logical entry point at the current levels — I will wait until a clearer setup forms.

XAU/USD: Channel Breakout → Retest → Downside Target at 3,940EURONEXT:FTI1! EURONEXT:FTI1! EURONEXT:VU8F2026 EURONEXT:VM81! EURONEXT:VV6X2025 EURONEXT:V26X2025 EURONEXT:NS8Z2025 EURONEXT:YG8F2026 Pair: Gold Spot (XAU/USD)
Timeframe: 1-hour
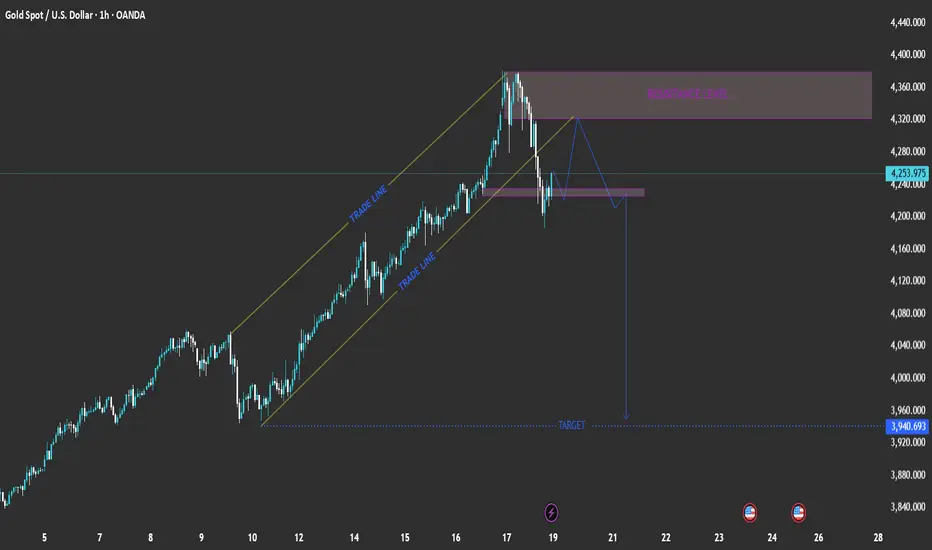
Current Price: 4,253.975
Trend: Recently broke out of an ascending channel (bearish signal)
📉 Chart Breakdown
1. Ascending Channel (Trade Lines)
Price was moving steadily inside a rising channel, indicated by the two parallel yellow “TRADE LINE” levels.
The break below the lower trade line suggests weakening bullish momentum and potential trend reversal.
2. Resistance Level (4,320 – 4,360 zone)
Marked in purple, this zone served as a key resistance.
Price rejected strongly from this area, confirming seller presence.
3. Structure Retest and Potential Move
After the channel break, price retraced back to retest the broken channel support (now resistance).
The projected blue path shows a lower-high formation followed by a new drop, completing a bearish continuation pattern.
4. Target Zone
The projected target is near 3,940.693, aligning with previous structure support.
This level could serve as a profit-taking area for short positions.
📊 Summary of Key Levels
Zone Type Range / Level
4,320 – 4,360 Resistance Strong supply zone
4,220 – 4,240 Retest zone Potential short entry area
3,940 Target Bearish target / demand zone
⚙️ Trading Plan Concept (Hypothetical)
Bias: Bearish
Entry Idea: Wait for rejection from 4,220–4,240 zone.
Stop Loss: Above 4,280 (resistance)
Take Profit: Around 3,940 (target)
Risk/Reward: Approximately 1:3 or better
🧭 Conclusion
The chart suggests that Gold (XAU/USD) might be entering a corrective bearish phase after failing to sustain its bullish channel. A retest of broken structure before another drop aligns with typical market structure behavior.
analysis for Gold (XAU/USD) based on your 15-minute chart:he chart shows a descending channel (marked by “TRADE LINE”) that recently broke to the upside, suggesting a possible short-term bullish reversal.
A strong resistance zone is visible near 4140–4160, where price has previously rejected multiple times.
The target zone below is marked around 4042.57, which aligns with prior swing support.
Key Levels
Resistance: 4140 – 4160
Support: 4080 – 4060
Target (Downside): 4042
Upside Break Zone: Above 4160 could lead toward 4180+
Analysis Summary
The price broke out of a short-term bearish channel, indicating potential for a bullish correction toward resistance (4140–4160).
However, this zone is critical resistance; rejection here may trigger a pullback back toward 4080 or even the target at 4042.
Momentum indicators suggest the move is reactive (short-term retracement), not yet a trend reversal.
⚙️ Trading Outlook
Bearish Bias: Below 4140 → potential retest toward 4060–4040.
Bullish Confirmation: Only above 4160 → continuation to 4180–4200. MIL:RACE MIL:LDO MIL:STLAM MIL:ENI MIL:STMMI MIL:STMMI MIL:ENEL MIL:MONC MIL:PRY MIL:TIT MIL:FCT MIL:AZM MIL:WBD

Gold bulls are powerless to recover rebound continues to bearishThis week, global financial markets are focused on the Federal Reserve's upcoming interest rate decision. Gold prices typically have a negative correlation with real interest rates. Rate cuts typically reduce the opportunity cost of holding gold, thus supporting prices. In the current environment of rising risk appetite, even if the Fed cuts rates as expected, gold's safe-haven appeal may be offset by trade optimism.
Yesterday, gold prices broke through the psychologically important 4,000 level as expected, and we saw significant returns on both short positions. After consolidating below the 4,160 high, gold is poised to break lower, generally in line with expectations. The daily candlestick pattern formed a doji candlestick pattern, followed by a mid-sized bearish candlestick pattern that engulfed the lower level, continuing its downward trend. The daily and weekly corrections are still ongoing. The daily chart finally closed at 3982, with a long black candlestick with a long upper shadow. Today's market continues to short. Gold's resistance level is currently moving downwards. The four-hour chart is entirely filled with long black candlesticks. Any rebound is easily swallowed by these large black candlesticks. These large black candlestick bodies demonstrate the strength of the bears, breaking through all support levels. The only lower support level is around 3950. If this breaks down, bears will target around 3800. Therefore, we will continue to focus on long positions, clearly at yesterday's support point, around 4040.
From a technical analysis perspective, gold is showing clear bearish signals on the one-hour chart. The moving averages are showing a bearish alignment, with the short-term moving averages pushing downward, indicating that short-term bears have the upper hand. Furthermore, the MACD indicator's death cross continues to diverge, and the growing green momentum bar further confirms the downward price trend. During the Asian session, watch for a rebound in gold prices to the 4035-4040 range. A small position can be entered into a short position with a stop-loss above 4050 to protect against losses from a sudden price reversal. Target prices can initially target the 4000 mark, with further downside potential targeting the 3980-3950 range.

Gold (XAUUSD) – 28 Oct | Key Demand Zone in Focus🟡 Gold (XAUUSD) Analysis – 28 October
Hello Disciplined Traders,
Welcome to the Chart Is Mirror Community 👋
Market Context
• Gold is currently trading inside the H4 demand zone 3976.8 – 3944.3 , aligning with a higher-low (HL) key zone , a high-probability area where price could potentially reverse and resume its uptrend.
• The recent retracement represents a healthy H4 pullback within the broader bullish structure.
• Momentum remains neutral at present, as the market awaits confirmation from lower timeframes.
Key Observations
• If the market holds this key demand zone and forms a bullish structure shift on M15 , it could signal the end of the H4 pullback and the beginning of a new bullish leg.
• A close below 3944.3 will confirm a CHoCH (Change of Character) to the downside, suggesting continuation of the H4 downtrend.
• In that scenario, only short opportunities will remain valid until structure shifts back to bullish.
Execution Plan
• Wait for M15 bullish structure shift or confirmation before entering long positions.
• If the market closes below 3944.3, switch bias to short setups in alignment with the H4 downtrend.
• Patience is key — let structure reveal the direction before participation.
Stillness precedes precision — let the market confirm your conviction.
📘 Shared by @ChartIsMirror

Gold Bullish Reversal Expected from D-FVG ZoneKey Observations and SMC Components:
D-FVG (Daily Fair Value Gap):
The most important element is the large shaded gray box at the bottom, labeled D-FVG. This indicates an Inefficiency or Fair Value Gap identified on the Daily timeframe, making it a powerful area of demand where institutional buying pressure is expected.
CRT-L and CRT-H:
CRT-L (Current Range Low/Bottom) is placed near the bottom of the D-FVG zone, marking a key support level.
CRT-H (Current Range Top/High) marks the high of the recent drop.
Current Price Action:
The price is currently at $3,974.61 and has been trending down. It is approaching the key support/demand zone (D-FVG).
Projected Move:
The curved line and green arrow indicate the anticipated price action: a continuation of the drop into the D-FVG zone, followed by a strong rejection and a reversal upwards (a rally).
The rally's TARGET is marked by a dotted line, sitting below the CRT-H level (around $4,020 - $4,030).
Trading Bias and Expectation
The overall bias is short-term bullish following the retracement. The analyst expects price to:
Retrace/Consolidate: Drop into the high-probability D-FVG demand zone (around $3,920 to $3,940).
Reverse and Rally: Find strong support in this zone, then reverse and move upwards to hit the intermediate TARGET.

Today's gold trading strategy1.Expectation of loose policy or "fulfillment leads to disappointment": The market's expectation for the Federal Reserve to cut interest rates by 25 basis points in October has largely been absorbed, and there is even an overly optimistic situation. Recently, the retail sales data released in the United States exceeded expectations, indicating that the consumption sector still has resilience. Some Federal Reserve officials also stated that "we need to be cautious of the rapidity of rate cuts triggering an inflation rebound", and it is not ruled out that a signal of "a slower pace of subsequent rate cuts" will be released at the meeting. If the expectation of loose policy is lower than expected, the funds that entered the market due to the expectation of rate cuts may concentrate on exiting, directly suppressing the gold price.
2. Geopolitical risks show signs of easing: A temporary ceasefire has been reached in the Gaza Strip, with both sides beginning to exchange hostages, and the ceasefire period may be extended. The tension in the Middle East has significantly decreased. Although the conflict between Russia and Ukraine has not been resolved, no new major escalation events have occurred recently. Market attention to geopolitical risks has decreased, and the demand for gold as a safe haven has naturally weakened, causing the key factors supporting the gold price to loosen.
Today's gold trading strategy
sell 4000-3990
TP:3980~3970
SL:4010

Elliott Wave Analysis – XAUUSD (October 28, 2025)
🔹 Momentum
D1 Timeframe:
The momentum lines on D1 remain intertwined. When this happens, the trend often continues with candle counts that follow Fibonacci numbers (3, 5, 8…).
Currently, there are around 3 candles, indicating a high probability of a reversal forming soon, possibly today.
H4 Timeframe:
Momentum is rising, suggesting a potential short-term upward or sideways move to push momentum into the overbought zone.
If the market consolidates at this level, once momentum reaches the overbought region, another bearish leg on H4 could still occur.
H1 Timeframe:
Momentum is currently decreasing. Price is closing lower around the liquidity zone at 3994, showing signs of a liquidity sweep.
We expect price to continue moving lower toward the next liquidity zone, in alignment with the short-term bearish structure on H1.
________________________________________
🔹 Wave Structure
D1 Timeframe:
The overall wave structure remains largely unchanged. Yesterday’s strong bearish candle fits within our prior analysis, confirming that the corrective wave is still in progress.
However, since the D1 momentum lines have already stuck together for about three candles, a potential bullish reversal candle today could mark the completion of this correction.
H4 Timeframe:
The structure has broken the previous low, suggesting that this could be the final leg of wave Y (blue).
Observing the completed 5-wave structure (1–2–3–4–5 in blue), this corrective leg has now returned to the base of the previous wave 4, achieving both price and time symmetry.
→ A short-term bullish reversal is expected from the current area.
H1 Timeframe:
The prior correction formed a triangle pattern (abcde in red), which has now broken to the downside, developing into a 5-wave sequence (black).
Wave 4 (black) appears completed, and price is likely within the final wave 5 down.
🎯 Target zones for completion of wave 5 (black):
• Target 1️⃣: 3953
• Target 2️⃣: 3927
________________________________________
🔹 Trading Plan
Scenario 1:
• Buy Zone: 3955 – 3952
• Stop Loss: 3932
• TP1: 4050
Scenario 2:
• Buy Zone: 3939 – 3927
• Stop Loss: 3907
• TP1: 3994

ElDoradoFx PREMIUM – GOLD ANALYSIS (28/10/2025, ASIA SESSION)Gold closed the US session around 3,982 after extending its sell-off from 4,048, confirming strong bearish continuation from the 4,38x top. The current structure remains heavy, with the H1 100/200 EMA acting as dynamic resistance and repeated rejections near 3,997–4,002.
Momentum indicators across intraday timeframes still favor sellers, but Asia may open with a brief corrective retracement before the next bearish leg toward 3,958–3,945 liquidity zones.
⸻
2️⃣ Technical Breakdown
🔹 Daily (D1)
• Third consecutive bearish daily candle confirming continuation of the mid-term correction.
• Price now trades around 3,982, testing the mid-range zone between 3,880–4,020.
• RSI slipping near 50, signaling room for more downside before oversold conditions.
• MACD histogram remains negative but moderating — corrective phase within broader uptrend.
🧭 Bias: Bearish continuation inside medium-term correction; key support 3,880.
⸻
🔸 1H Chart (H1)
• Structure: Clear lower highs from 4,12x → 4,072 → 4,048 → 3,997.
• Strong break of structure below 3,985 → 3,971 confirms downtrend intact.
• Price remains below all EMAs and the descending trendline.
• RSI ~37 (slightly oversold); MACD momentum still negative.
📉 Intraday Bias: Bearish below 4,021; corrective only if price reclaims that level.
⸻
🔹 15M Chart (M15)
• Descending channel clearly defined; price rejected twice near 3,997–4,002.
• Pullbacks shallow, suggesting weak buyer interest.
• MACD histogram fading after short correction — selling pressure resuming.
⚠️ Short-term Bias: Sell rallies until clean BOS above 4,021.
⸻
🔹 5M Chart (M5)
• Micro downtrend confirmed with CHoCH back to the downside at 3,996.
• Price consolidating near 3,982, forming minor liquidity base pre-Asia open.
• RSI ~36; momentum weak but potential short-term rebound toward 4,000 before next drop.
🔎 Micro Bias: Intraday pullback expected; structure favors new lower high formation near 4,009–4,021.
⸻
3️⃣ Fibonacci Analysis – Golden Zone
Last H1 swing: High 4,048 → Low 3,971
• 38.2% → 3,998
• 50% → 4,009
• 61.8% → 4,021 ✅
✨ Golden Zone = 4,009 – 4,021
This zone aligns with the descending trendline, the H1 EMA cluster, and prior supply rejection — making it the highest-probability short area for continuation.
⸻
4️⃣ High-Probability Trade Scenarios
🟢 Bearish Continuation Setup (Preferred Scenario)
✅ Sell Zone: 4,009 – 4,021 (Golden Zone)
🎯 Targets: 3,985 → 3,971 → 3,958 → 3,945
🛑 Stop-Loss: Above 4,028–4,032
📈 Reasoning: Structural alignment with EMAs, Fib confluence, and trendline resistance.
⸻
⚡ Momentum Breakdown Setup (Continuation Trade)
✅ Sell Trigger: Break & retest below 3,971
🎯 Targets: 3,958 → 3,945 → 3,930 → 3,920
🛑 Stop-Loss: Back above 3,985
📈 Reasoning: Structural breakdown confirmation and liquidity grab continuation.
⸻
⚪ Countertrend Buy Setup (Low Probability)
✅ Buy Trigger: Clean 15M BOS + retest above 4,021
🎯 Targets: 4,034 → 4,048 → 4,072
🛑 Stop-Loss: Below 4,009
📈 Reasoning: Short-term recovery if DXY weakens or liquidity imbalance above 4,02x forms.
⸻
5️⃣ Fundamental Watch
• Asia session quiet: no tier-1 data expected.
• Focus remains on USD index drift and post-US yield sentiment.
• If DXY holds firm above 106, gold downside pressure persists.
• Watch early Shanghai open flows — potential liquidity sweep near 3,971 before NY continuation.
⸻
6️⃣ Key Technical Levels
Type Levels
Resistance 3,997 / 4,009 / 4,021 / 4,034 / 4,048
Support 3,985 / 3,971 / 3,958 / 3,945 / 3,930
Golden Zone 4,009 – 4,021
Break Sell Trigger < 3,971
Break Buy Trigger > 4,021
⸻
7️⃣ Analyst Summary
The market remains structurally bearish across all intraday frames, with strong EMA alignment and trendline rejection confirming continuation bias. Asia session likely sees a corrective bounce into the 4,009–4,021 Golden Zone, where the best-quality short setups align.
Only if buyers reclaim and hold above 4,021 will momentum shift for a potential relief rally toward 4,048/4,072. Otherwise, expect renewed pressure targeting 3,971 → 3,958 → 3,945.
⸻
8️⃣ Final Bias Summary
📉 Primary Bias: Bearish → Sell rallies into 4,009–4,021
📈 Secondary Bias: Bullish only above 4,021 (retested hold)
🎯 Targets: 3,985 → 3,971 → 3,958
✨ Golden Zone: 4,009 – 4,021
🛑 Invalidation: H1 close above 4,032
⸻
🥇 ElDoradoFx PREMIUM 2.0 – PERFORMANCE 27/10/2025 🥇
📅 Smart setups. Steady profits.
━━━━━━━━━━━━━━━
🔻 SELL +220 PIPS
🟢 BUY +145 PIPS
❌ BUY -60 PIPS (SL)
🔻 SELL +210 PIPS
━━━━━━━━━━━━━━━
💰 GOLD TOTAL PIPS WON: +515 PIPS
📊 4 Trades → 3 Wins | 1 SL
🎯 Accuracy: 75%
━━━━━━━━━━━━━━━
🔥 Solid and precise session — trend moves respected technical zones perfectly.
👏 Congratulations if you profited! ✅✅✅🚀🚀🚀

gold analysis 30/9/2025 ( The Gold Map )Based on gold analysis using My own strategy that I use digital analysis combined with mathematics and physics :
Selling Zones :
3869 - 3881
3901 - 3922
3936 - 3951
3976 - 3994
4008 - 4020
4033 - 4056
4101 - 4118
4137 - 4157
4187 - 4202
4264 - 4285
4346 - 4362
buying zones
3778 - 3764
3751 - 3761
3717 - 3738
3693 - 3710
3670 - 3688
3654 - 3668
3636 - 3648
3612 - 3628
3596 - 3607
3561 - 3579
3503 - 3523

XAU/USD DOUBLE TOP FORMATION BEARISH MOVE TARGETTING SUPPORT🧩 Key Observations:
1. Double Top Formation
Two clear peaks around 4160–4180 zone (marked circles).
This confirms strong resistance and a potential reversal zone.
2. Trendline Resistance
A descending trendline from previous highs keeps price suppressed.
Every retest of this line has led to rejection — confirming bearish control.
3. Bearish Structure
Lower highs and lower lows clearly visible → consistent with downtrend.
Recent pullback appears corrective before another potential drop.
4. Projected Move (Arrow Path)
The arrow suggests a short-term retracement to ~4120–4150 zone (trendline + resistance confluence).
Then, a continuation down toward the target zone near 3968–3980.
5. Support & Target Levels
Immediate Support: 4040–4050
Main Target: 3968–3980 (shown on chart)
Major Resistance: 4160–4180

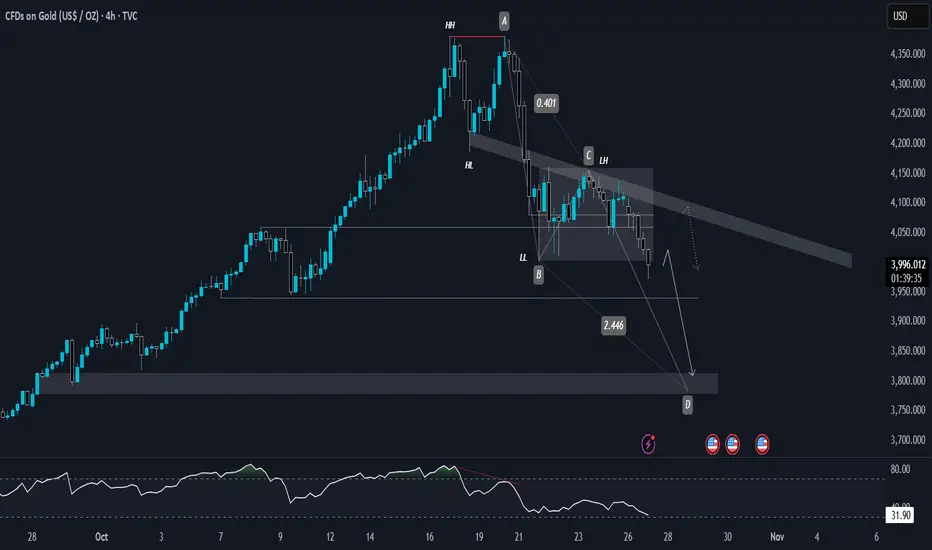
GOLD 4H | Harmonic AB=CD Bearish Reversal in PlayGold recently formed a clear double top at the all-time high (ATH), accompanied by a bearish divergence on higher timeframes — signaling exhaustion of bullish momentum. That divergence has played out perfectly, aligning with the current bearish market structure.
The price has now broken below the key accumulation range between 4000 and 4149, confirming a shift in sentiment. With the trend consistently printing lower lows (LL) and lower highs (LH), the overall market bias remains bearish.
🔹 Technical Breakdown
We currently have a bearish AB=CD pattern completing near the 3800 zone, which aligns with the Fibonacci golden ratio (0.618) on the D leg.
Although AB=CD is traditionally a bullish harmonic pattern, here it’s being used within a downtrend context to identify a potential reversal or continuation zone — depending on market reaction at D.
Key Zone to Watch:
🟡 3800 – 3840 → Major potential reaction zone (Fib confluence + AB=CD completion).
If sellers hold this level, we could see further downside momentum.
🔹 Daily Chart View
On the daily timeframe, bullish momentum looks weak — every recovery candle is smaller, and volume favors sellers. With the AB=CD pattern confirmation and price failing to reclaim the 40050 zone, the bias stays bearish.
🔹 Weekly Chart Insight
Historically, gold tends to retrace after 9 consecutive straight bullish weekly candles.
From 1990 to 2025, each 9-week rally phase has been followed by a notable correction ranging from 6% to 14%, showing that extended rallies often precede profit-taking phases.
This current rally phase mirrors that same behavior patterns — making a corrective move toward 3800–3700 highly probability.
🧭 Final BIAS
The technical confluence between the bearish structure, double top + divergence, and AB=CD D-leg near golden ratio and 9 week rally gives a high-probability bearish setup.
If 3940 fails to hold, next potential downside target lies near 3900-3775, aligned with long-term structure support.
GOLD (XAUUSD) — Market Sitting Below 3,980… What’s Next?Gold finally filled the Daily Fair Value Gaps below and we’re now sitting around 3,976 after a heavy pullback. Trend is still bullish overall, this looks like a normal correction after that vertical move up.
I’m watching the current Daily FVG support between 3,950 – 3,980.
If buyers defend this area → I’m looking for long entries.
Buy Plan (Only if we see bullish reaction):
• Entry zone: 3950 – 3980
• TP1: 4050 (small bounce liquidity)
• TP2: 4150 (upper FVG)
• TP3: 4250 if momentum is strong
• SL: below 3930 (clean invalidation)
Bearish invalidation:
If 3,930 breaks and closes below FVG → gold likely continues down to 3,880 next demand area .

Gold Pullback or Reversal? Key Zone Ahead!As I expected , Gold ( OANDA:XAUUSD ) started to drop thanks to the Double Top Pattern and reached its target at the Support zone($4,011 – $3,981) .
Now, do you think Gold will start dropping again, or will it resume its recent weeks’ uptrend?
Today, I’m going to do a short-term 15-minute analysis of Gold , so stay tuned.
At the moment, Gold is approaching a Resistance zone($4,192 – $4,137) —also a Potential Reversal Zone (PRZ) —and moving within an ascending channel . Overall, the recent moves in Gold over the past couple of days look like a pullback to the previous Support zone($4,192 – $4,137) .
From an Elliott Wave perspective , it seems that Gold , given the momentum of its recent drop, is completing corrective waves, and we should expect another decline .
I expect Gold to start dropping again from the Resistance zone($4,192 – $4,137) and PRZ , and AFTER breaking the lower line of the ascending channel , it could fall at least down to around $4,039(First Target) .
Second Target: Support zone($4,011 – $3,981)
Stop Loss(SL): $4,222
Please respect each other's ideas and express them politely if you agree or disagree.
Gold Analyze (XAUUSD), 15-minute time frame.
Be sure to follow the updated ideas.
Do not forget to put a Stop loss for your positions (For every position you want to open).
Please follow your strategy; this is just my idea, and I will gladly see your ideas in this post.
Please do not forget the ✅ ' like ' ✅ button 🙏😊 & Share it with your friends; thanks, and Trade safe.

XAUUSD - Signal#XAUUSD - Signal
H4 - Formation of the 3rd wave + breakout of the triangle line in continuation of the downtrend. Stop behind the high of the 2nd wave.
Entry: 4037.059
TP: 3973.036 - 3906.486 - 3845.833 - 3750.641
Stop: 4142.359

GOLD aka XAUUSD is heading to the downside!!Last week XAUUSD (Gold) had a very bearish week! It ended its bullish streak of years and declined to the downside. It only recently broke a very strong support zone (the green trendline) and struggled to break above the resistance zone (red trendline). It should drop all the way down further all the way to the 3833 level.
