Gold: The M-top pattern indicates a downward risk📈Gold’s situation today is quite complex, marked by sharp volatility. Looking at the price trend, after a rare steep drop the previous night, the Gold continued to slide following today’s opening, touching a low of 4004.5. It then staged a short-term rebound of over $100, fluctuating around 4100 and peaking at 4161.It then continued to decline.
📝In terms of influencing factors:
The cooling of safe-haven sentiment is one of the key reasons for Gold’s decline. Europe’s support for Russia-Ukraine ceasefire negotiations, the expected resolution of the U.S. government shutdown crisis, and the easing of Sino-U.S. trade tensions have all led to a significant drop in market demand for safe-haven assets.
📈Gold had risen too sharply in the earlier stage, fueling strong sentiment among investors to take profits at high levels. A large number of sell orders pushed its price down sharply.
Additionally, the strengthening of the U.S. dollar during the day has also exerted certain pressure on gold prices.
📝From a technical perspective:
The Gold closed with a long bearish candlestick on the daily chart, accompanied by a simple M-top formation. This indicates the risk of the market continuing to move downward. The upper resistance zone is between 4150 and 4180, the key lower support level is at the 4000 integer mark, and further downside support lies between 3900 and 3904.
💎Trading Strategy:
Buy 4075 - 4085
SL 4060
TP 4115 - 4125 - 4135
Sell 4150 - 4160
SL 4175
TP 4085 - 4100 - 4115
Daily-updated accurate signals are at your disposal. If you run into any problems while trading, these signals serve as a reliable reference—don’t hesitate to use them! I truly hope they bring you significant assistance
Xauusdanalysis

$4,381 WAS THE FAKE TOP? Gold -5.5%: MSS Confirms SELL!XAU/USD In-Depth Analysis: Historic Shock and Structure-Based Selling Opportunity!
1. Fundamental Shock Analysis
Gold's massive 5.5% plunge from its record high of $4,381 was a large-scale profit-taking action following a blistering 60% year-to-date rally. This move was fueled by:
USD Strength: The strengthening US Dollar reduced Gold's appeal.
Market Sentiment: A shift into Risk-On mode, diminishing safe-haven demand.
The Essence: This was a huge Liquidity Sweep, designed to wash out weaker hands before Gold decides its next major trend.
2. Technical Analysis (MSS & Execution)
The price structure has delivered a decisive message: The trend has changed!
MSS Confirmed (Market Structure Shift): The break of the bullish structure occurred at $4,254.549. This level is now a highly critical Supply Zone, acting as the "boundary" for the bears.
Demand Reaction: Gold is currently attempting to hold the Order Block (OB) at $4,077.
Preferred Strategy: SELL based on the confirmed MSS.
Optimal SELL Zone: Wait for a retracement back to the Supply Zone $4,254.549 (Ideal limit entry).
Target (TP): Successive targets are $4,008 (The psychological $4k mark) and the strong support area at $3,944 - $3,904.
Stop Loss (SL): Place above the high at $4,260 (Protecting the MSS point).
Conclusion: Don't be fooled by the bounce. $4,254.549 is the golden entry point for a short trade following the new market structure.
#GOLD #XAUUSD #MSS #Liquidity #SELLSignal #SmartMoneyConcept

XAU/USD 22 October 2025 Intraday AnalysisH4 Analysis:
-> Swing: Bullish.
-> Internal: Bullish.
Analysis and bias remains the same as analysis dated 20 October 2025.
Price has printed as per previous intraday expectation by printing a bearish CHoCH which indicates, but not confirms, bullish pullback phase initiation.
Price is currently trading within an established internal range, however, I will continue to monitor price with regards to depth of pullback.
Intraday expectation:
Price to continue bearish, react at either discount of 50% internal EQ, or H4 supply zone before targeting weak internal high priced at 4,380. 990.
Note:
The Federal Reserve’s sustained dovish stance, coupled with ongoing geopolitical uncertainties, is likely to prolong heightened volatility in the gold market. Given this elevated risk environment, traders should exercise caution and recalibrate risk management strategies to navigate potential price fluctuations effectively.
Additionally, gold pricing remains sensitive to broader macroeconomic developments, including policy decisions under President Trump. Shifts in geopolitical strategy and economic directives could further amplify uncertainty, contributing to market repricing dynamics.
H4 Chart:
M15 Analysis:
-> Swing: Bullish.
-> Internal: Bearish.
Price has printed according to my analysis dated 20 October 2025 where I mention that price is to continue bullish, react at either premium of 50% internal EQ, or M15 demand zone, before targeting weak internal low priced at 4,185.910.
Price has printed a bearish iBOS and subsequently a bullish CHoCH to indicate, but not confirm bullish pullback phase initiation.
Price is now trading within an established internal range.
Intraday expectation:
Price to react at either premium of 50% internal EQ, or M15 demand zone, before targeting weak internal low priced at 4,004.280.
Note:
Gold remains highly volatile amid the Federal Reserve's continued dovish stance, persistent and escalating geopolitical uncertainties. Traders should implement robust risk management strategies and remain vigilant, as price swings may become more pronounced in this elevated volatility environment.
Additionally, President Trump’s tariff announcements, particularly against China, are expected to further amplify market turbulence, potentially triggering sharp price fluctuations and whipsaws.
M15 Chart:

XAU/USD Intraday Plan | Support & Resistance to WatchGold dropped like a rock yesterday, extending its sharp sell-off into the early Asian session, where price briefly touched 4,004 before bouncing back. The move marked one of the steepest single-day declines in weeks, slicing straight through multiple support zones before finding some footing just above 4075(deeper support zone).
Price is now hovering around 4,141, showing early signs of stabilization after yesterday’s flush-out. While the broader uptrend remains intact, short-term momentum has clearly shifted bearish, with the MA50 now acting as dynamic resistance. If buyers can reclaim 4,192 and the MA200, a corrective bounce toward 4,227 and 4,279 could follow.
However, failure to hold above 4,117 would likely trigger another leg lower toward the Deeper Support Zone (4,075–4,044), where stronger buying interest are expected.
📌 Key levels to watch:
Resistance:
4151
4192
4227
4279
4321
Support:
4117
4075
4044
4004
3984
🔎 Fundamental focus:
While short-term sentiment has flipped cautious, the broader macro backdrop remains gold-supportive — ongoing political risk and weak global growth continue to attract dip buyers on major corrections.

ElDoradoFx PREMIUM – GOLD ANALYSIS (22/10/2025, LONDON SESSION)Gold (XAUUSD) is trading around 4,157, rebounding aggressively from the previous sell-off low near 4,004. Buyers have stepped in with conviction, reclaiming short-term structure and driving price back above key intraday levels. London opens with bullish momentum in play, but price is now approaching early resistance zones, where the next directional decision is likely to form.
⸻
🔍 Technical Outlook
Daily Chart (D1)
• Previous daily candle shows a strong lower wick recovery after heavy bearish liquidation.
• Price remains above both 20EMA and 50EMA, suggesting the broader bullish structure is still intact.
• RSI has cooled from overbought but now points upward, indicating renewed bullish pressure.
• MACD remains in positive territory, confirming long-term buyers are still active.
Bias: Bullish corrective rebound, awaiting confirmation for continuation.
⸻
1H Chart (H1)
• Clean bullish CHoCH formed after rejection from 4,004.
• Price is approaching dynamic resistance from 200 EMA (around 4,170).
• RSI at ~46–50, suggesting room for continuation before overbought conditions.
• If price breaks and holds above 4,170, next bullish leg may target 4,200–4,225 liquidity.
Intraday Bias: Bullish toward premium zones unless rejected at 4,170.
⸻
15M Chart (M15)
• Multiple higher lows after bounce confirm controlled bullish momentum.
• RSI around 60, reflecting moderate bullish strength.
• MACD expanding upward → intraday momentum supports continuation into resistance.
• Key minor resistance near 4,160–4,170 may trigger a pullback or consolidation.
Short-term View: In bullish leg, approaching decision zone.
⸻
5M Chart (M5)
• Structure is trending upward, with each dip being bought.
• MACD strongly bullish; histogram rising.
• Any pullback into 4,140–4,135 area may provide minor intraday buy reaction before a deeper decision.
⸻
✨ Fibonacci Golden Zone
Recent impulse leg: Low 4,004 → High 4,160 (current swing)
🔹 38.2% Fib = 4,115
🔹 50% Fib = 4,082
🔹 61.8% Fib = 4,050
✅ Golden Zone = 4,115–4,050, aligning with previous breakout structure and short-term EMA confluence.
➡ If price retraces to this zone and holds, bullish continuation setups may activate.
⸻
🎯 High Probability Scenarios
✅ Bullish Continuation Setup (Preferred if pullback holds)
📍 Buy Zone: 4,115–4,082 (Golden Zone reaction)
✅ Trigger: Bullish engulfing or strong rejection wick
🎯 Targets → 4,150 → 4,170 → 4,200 → 4,225
🛑 SL below 4,050
✅ Break & Retest Buy Setup (Aggressive Momentum Entry)
📍 Buy above 4,170 (Break of EMA confluence)
🎯 Targets → 4,200 → 4,225 → 4,254
🛑 SL below 4,150
⚠️ Bearish Correction Setup (If rejection occurs at premium zone)
📍 Sell if strong rejection at 4,170–4,200
🎯 Targets → 4,140 → 4,115 → 4,082
🛑 SL above 4,209
🔻 Sell Breakout (If bearish momentum resumes)
📍 Sell below 4,050 (Break & Retest)
🎯 Targets → 4,030 → 4,004 → 3,980
🛑 SL above 4,082
⸻
📅 Fundamental Outlook – London Session
• No major European data early session; price action driven by technical flows.
• Focus remains on US data later (unemployment, Fed sentiment).
• DXY cooling slightly after yesterday’s strength, offering support to gold pullback recovery.
• US yields remain elevated — could cap upside unless risk-off intensifies.
⸻
⚠️ Key Levels to Watch
Type Level Description
Resistance 4,170 H1 200 EMA / decision point
Resistance 4,200–4,225 Liquidity target zone
Resistance 4,254 Previous key supply
Support 4,140 Minor intraday support
Support 4,115–4,082 Fibonacci Golden Zone
Support 4,050 Final retracement line
⸻
✅ Summary
Gold is staging a strong recovery rally and remains bullish in early London momentum. A controlled retracement into the Golden Zone (4,115–4,082) would provide an ideal continuation buy opportunity toward 4,170–4,200–4,225. A confirmed break above 4,170 validates continued upside. A strong rejection at 4,170–4,200 may trigger a corrective dip back into the Fib zone.
Session Bias: Bullish, with continuation favored on dips.
Break Confirmation:
• ✅ Buy above 4,170
• ⚠️ Sell below 4,050
Golden Zone: 4,115 – 4,082 – 4,050
⸻
🥇 ElDoradoFx PREMIUM 2.0 – PERFORMANCE 21/10/2025 🥇
📊 GOLD TRADE RESULTS:
🔻 SELL +210 pips
🟢 BUY LIMIT +20 pips
❌ BUY –40 pips (SL)
🟢 BUY +70 pips
🟢 BUY +100 pips
🔻 SELL +210 pips
🟢 BUY +270 pips
---
💰 TOTAL GOLD PIPS WON: ✅ +840 pips
📈 RESULT: 7 Signals → 6 Wins | 1 SL
🎯 ACCURACY: 86%
---
🔥 Solid upward momentum and precision in reversals — swing continuation played out beautifully 📈💎
👏 Congratulations if you profited! ✅✅✅🚀🚀🚀

XAUUSD – Sharp 5% Drop as Traders Take Profit Ahead of US CPIMarket Context:
Gold (XAU/USD) slumped over 5.5% on Tuesday, marking its largest daily decline in months as traders took profits ahead of the upcoming US CPI data (October 24).
The US Dollar Index (DXY) rebounded 0.36% to 98.94, making gold more expensive for foreign buyers.
This correction also coincides with renewed optimism over potential easing of US–China trade tensions, after President Trump confirmed plans to meet Chinese leader Xi Jinping next week.
While this sharp move caught many traders off guard, it appears to be a healthy correction within a broader bullish structure, as investors remain cautious before major data and the upcoming Fed policy meeting next week.
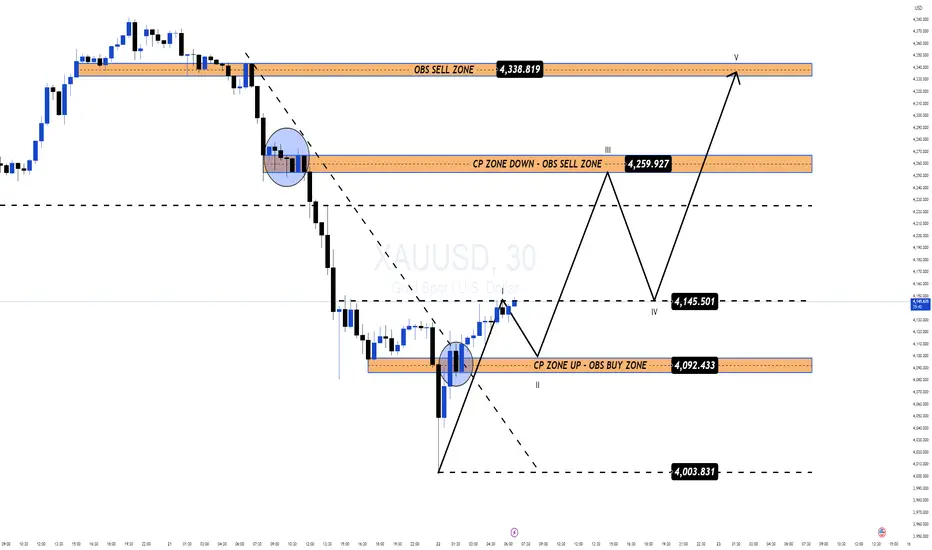
Technical Outlook (M30):
After the heavy selloff from the 4,375 high, gold found near-term support around 4,003 – 4,010, forming a potential accumulation base.
The pair now trades near 4,150, showing early signs of recovery toward key confluence zones.
Key Technical Levels:
OBS Sell Zone: 4,338 – 4,340
CP Zone Down / OBS Sell Zone: 4,259 – 4,260
CP Zone Up / OBS Buy Zone: 4,092 – 4,094
Deep Buy Zone: 4,003 – 4,008
The current structure outlines a 5-wave projection, where price may complete Wave II near 4,092, then advance toward Wave III at 4,259, followed by a correction (Wave IV) and another push toward Wave V near 4,338.
Trading Plan:
🔹 BUY ZONE#1 (Short-Term Recovery)
Entry: 4,092 – 4,094
Stop Loss: 4,080
Take Profit: 4,145 → 4,259 → 4,338
🔹 BUY ZONE #2 (Liquidity Sweep Scenario)
Entry: 4,003 – 4,008
Stop Loss: 3,990
Take Profit: 4,090 → 4,259
🔹 SELL ZONE (Countertrend Reaction)
Entry: 4,259 – 4,260
Stop Loss: 4,272
Take Profit: 4,145 → 4,092
Summary:
The recent 5% correction is viewed as a profit-taking phase ahead of CPI data, not a structural breakdown.
Gold is expected to stabilise above 4,092, with buyers likely stepping in near the OBS Buy Zone.
Focus remains on 4,259 for a short-term reaction and 4,338 as the next potential liquidity target if momentum continues.
📊 What’s your view — is this just a healthy retracement before CPI, or the start of a deeper shift?
👉 Follow MMFLOW TRADING for daily institutional-grade setups and smart money structure updates.

Today's trading strategy for gold is hoped to be helpful to you.Core Bullish Logic for Gold: Why It Deserves Long-Term Attention
1.Support from Policy and Monetary Environment: The market generally expects the Federal Reserve to continue cutting interest rates in the future. This will reduce the cost of holding gold, and at the same time, the attractiveness of the U.S. dollar is declining—both of which are favorable for gold. In addition, the U.S. government "shutdown" is still ongoing, and key economic data cannot be released on time. People are more uncertain about the economic trend, so they will be more willing to buy gold as a safe - haven asset.
1.Long-Term Demand Is Secured: Central banks around the world are continuing to buy gold. The People's Bank of China has increased its gold holdings for 11 consecutive months. Such large - scale long - term purchases can provide a floor for gold prices. Meanwhile, ordinary investors are also increasing their positions through methods such as ETFs. The inflow volume of global gold ETFs in September is almost close to the level during the Russia - Ukraine conflict, which shows that the market has a high recognition of gold.
Today's Gold Trading Strategy
xauusd @ buy:4120-4130
pt:4150-4160
sl:4100

technical analysis for XAU/USD (Gold) based on your chart:Pair: Gold (XAU/USD)
Chart Summary
Current Price: Around $4,140
Trend Lines: A descending trade line shows the overall short-term bearish trend.
Support Zone: Clearly marked between $4,080 – $4,120 (“SUPPORT BUY ZONE”).
Target: The upside target is labeled near $4,383.
Technical Outlook
🔹 Support Zone Reaction
Price recently dipped into the support buy zone, forming a potential bullish reversal wick.
This area is acting as a strong demand zone, attracting buyers around $4,100.
🔹 Downtrend Channel
The pair remains under a downward-sloping trade line, suggesting the short-term market bias is still bearish.
However, a breakout above this trendline could trigger bullish continuation toward the $4,383 target.
🔹 Short-Term Scenario
Bullish Case (Primary Plan):
If gold holds above the support zone ($4,080–$4,120) and breaks the trendline resistance (~$4,200),
→ next target area: $4,300–$4,383.
Confirmation comes with a clear candle close above $4,200.
Bearish Case (Alternative Plan):
If price fails to break the descending trade line and drops below $4,080,
→ possible continuation toward $4,040 – $4,000.
Key Levels
Type Level (USD) Description
🎯 Target 4,383 Major resistance / profit zone
⚔️ Resistance 4,200 Descending trendline zone
🛒 Support Zone 4,080–4,120 Demand / Buy zone
❌ Invalid Below 4,080 Break below = bearish continuation
Summary
📈 Gold (XAU/USD) is currently retesting its support zone, showing early signs of a bullish rebound.
A confirmed breakout above the trendline could lead to a rally toward $4,380.
However, losing support below $4,080 would invalidate the bullish setup and reintroduce downside risk. EURONEXT:IE6X2025 EURONEXT:BE8Z2025 EURONEXT:BXF1! EURONEXT:CU6X2025 EURONEXT:KB6X2025 EURONEXT:PJ6X2025 EURONEXT:PJ8Z2025 EURONEXT:UM6X2025 EURONEXT:UM8Z2025 EURONEXT:AB6X2025 EURONEXT:AB7X2025

Market Analysis: Gold Dips From HighsMarket Analysis: Gold Dips From Highs
Gold price started a downside correction from $4,380.
Important Takeaways for Gold Price Analysis Today
- Gold price climbed higher toward the $4,380 zone before there was a sharp decline against the US Dollar.
- It traded below a bullish trend line with support at $4,300 on the hourly chart of gold.
Gold Price Technical Analysis
On the hourly chart of Gold, the price climbed above $4,200. The price even spiked above $4,300 before the bears appeared.
A high was formed near $4,380 before there was a fresh decline below a bullish trend line with support at $4,300. There was a move below the $4,200 pivot level. The bears even pushed the price below $4,120 and the 50-hour simple moving average.
It tested the $4,000 zone. A low is formed near $4,002 and the price is now correcting losses. There was a minor move above the 23.6% Fib retracement level of the downward move from the $4,381 swing high to the $4,002 low.
Immediate resistance on the upside is near $4,190 and the 50% Fib retracement. The first major hurdle for the bulls could be $4,235 and the 50-hour simple moving average.
The main barrier for the bulls could be near the $4,380 level, above which the price could test the $4,500 zone. Any more gains might call for a move toward $4,650.
An upside break above $4,650 could send Gold price toward $5,000. Initial support on the downside is near $4,090 level. The next key level is $4,000. If there is a downside break below $4,000, the price might decline further. In the stated case, the price might drop toward $3,800.
This article represents the opinion of the Companies operating under the FXOpen brand only. It is not to be construed as an offer, solicitation, or recommendation with respect to products and services provided by the Companies operating under the FXOpen brand, nor is it to be considered financial advice.

Gold 1H – Bearish Reaction After Consecutive Gains🟡 XAUUSD – Intraday Trading Plan | by Ryan_TitanTrader
📈 Market Context
After several sessions of steady gains, gold is showing signs of exhaustion as U.S. Treasury yields stabilize and traders reassess the Federal Reserve’s next move.
The market’s focus today is on U.S. housing data and Fed officials’ remarks, which could shape expectations for the December policy outlook.
• A hawkish tone from policymakers may strengthen the dollar and pressure gold lower.
• Conversely, softer remarks could briefly trigger buying around key discount zones, but the overall tone remains corrective after the recent rally.
Market liquidity is concentrated near the $4,230 area — where price may tap into unmitigated supply before continuing its bearish leg.
🔎 Technical Analysis (1H / SMC Style)
• Structure: The overall bias has shifted bearish following consecutive ChoCH and BOS formations.
• Premium Zone: The 4,230–4,228 area aligns with an H1 order block and previous liquidity pool — a prime zone for short re-entry.
• Liquidity Sweep: The recent upside push toward 4,230 may sweep late buyers before the next bearish leg unfolds.
• Discount Zone: Short-term liquidity may rest around 4,080–4,100, which aligns with previous sell-side imbalance (SSI) and acts as an intraday reaction zone.
🔴 Sell Setup
• Entry: 4,230 – 4,228
• Stop-Loss: 4,240
• Take-Profit Targets: 4,100 → 4,080 → 4,050+
🟢 Buy Scalp Setup (Short-Term Countermove)
• Entry: 4,081 – 4,083
• Stop-Loss: 4,074
• Take-Profit Targets: 4,100 → 4,115
(Only valid if liquidity sweep confirms reaction within discount zone)
⚠️ Risk Management Notes
• Confirm M15 BOS/ChoCH before entry — avoid blind orders during news.
• Reduce position size for scalp entries; primary directional bias remains bearish.
• Lock partial profits near first liquidity targets and trail stops as structure confirms continuation.
✅ Summary
Gold faces near-term correction pressure after multiple bullish sessions.
The 4,230–4,228 zone offers a clean premium OB entry for continuation shorts, while reactive buyers may scalp intraday from 4,081 if liquidity sweeps occur.
Stay adaptive — today’s sentiment is short-term bearish within a larger range-bound structure.
FOLLOW RYAN_TITANTRADER for daily SMC setups ⚡

Gold (XAU/USD) M30 Smart Money Setup – Price Action Analysis📊 Current Structure:
On the M30 timeframe, CHOCH (Change of Character) has formed around 4186, confirming a possible bearish shift in market structure. The previous low stands at 4004, which acts as a major liquidity zone and final bearish target.
🧠 Smart Money Concept Overview
After the CHOCH at 4186, Gold is expected to retrace to premium zones before continuing its bearish move. The market has created two Fair Value Gaps (FVGs) — potential supply areas where price may react.
⚙️ Key Zones
1️⃣ 1st FVG (4231 – 4246) → Minor retracement zone 🟠
2️⃣ 2nd FVG (4302 – 4322) → Strong supply zone 🔴
📍 Stop Loss (SL): 4346
🎯 Target (TP): 4001
🧭 Trading Plan
Wait for price to tap into any FVG zone (4231–4322).
Confirm bearish reaction using candlestick rejection or CHOCH on lower TFs (M5–M15).
Enter short positions aiming for the 4001 target.
Risk management: keep SL tight above 4346.
📉 Conclusion
Gold currently shows strong bearish pressure after CHOCH confirmation. Smart money traders will be looking for short entries from FVG zones toward the 4001 liquidity target. Manage your trade wisely and follow structure confirmation before entry. 🧩
💡 Disclaimer: This analysis is for educational purposes only. Always do your own research before trading. 📚

XAUUSD – Sharp 5% Drop as Traders Take Profit Ahead of US CPIMarket Context:
Gold (XAU/USD) slumped over 5.5% on Tuesday, marking its largest daily decline in months as traders took profits ahead of the upcoming US CPI data (October 24).
The US Dollar Index (DXY) rebounded 0.36% to 98.94, making gold more expensive for foreign buyers.
This correction also coincides with renewed optimism over potential easing of US–China trade tensions, after President Trump confirmed plans to meet Chinese leader Xi Jinping next week.
While this sharp move caught many traders off guard, it appears to be a healthy correction within a broader bullish structure, as investors remain cautious before major data and the upcoming Fed policy meeting next week.
Technical Outlook (M30):
After the heavy selloff from the 4,375 high, gold found near-term support around 4,003 – 4,010, forming a potential accumulation base.
The pair now trades near 4,150, showing early signs of recovery toward key confluence zones.
Key Technical Levels:
OBS Sell Zone: 4,338 – 4,340
CP Zone Down / OBS Sell Zone: 4,259 – 4,260
CP Zone Up / OBS Buy Zone: 4,092 – 4,094
Deep Buy Zone: 4,003 – 4,008
The current structure outlines a 5-wave projection, where price may complete Wave II near 4,092, then advance toward Wave III at 4,259, followed by a correction (Wave IV) and another push toward Wave V near 4,338.
Trading Plan:
🔹 BUY ZONE#1 (Short-Term Recovery)
Entry: 4,092 – 4,094
Stop Loss: 4,080
Take Profit: 4,145 → 4,259 → 4,338
🔹 BUY ZONE #2 (Liquidity Sweep Scenario)
Entry: 4,003 – 4,008
Stop Loss: 3,990
Take Profit: 4,090 → 4,259
🔹 SELL ZONE (Countertrend Reaction)
Entry: 4,259 – 4,260
Stop Loss: 4,272
Take Profit: 4,145 → 4,092
Summary:
The recent 5% correction is viewed as a profit-taking phase ahead of CPI data, not a structural breakdown.
Gold is expected to stabilise above 4,092, with buyers likely stepping in near the OBS Buy Zone.
Focus remains on 4,259 for a short-term reaction and 4,338 as the next potential liquidity target if momentum continues.
📊 What’s your view — is this just a healthy retracement before CPI, or the start of a deeper shift?
👉 Follow MMFLOW TRADING for daily institutional-grade setups and smart money structure updates.
Gold Buy Long PostionA Gold (XAU/USD) Buy Long Position involves purchasing the XAU/USD pair with the expectation that the price of Gold (XAU) will rise relative to the US Dollar (USD) over time.1 This is a common strategy for position traders and swing traders.Gold Buy Long Position (XAU/USD) Short NoteCurrent XAU/USD Price ContextApproximate XAU/USD Price: The Gold price is highly dynamic, but recent market data shows it trading around the $4,150 - $4,250 per ounce range (as of the recent search results from October 2025). This price point is near historical highs, indicating a strong long-term bullish trend that is currently undergoing some short-term correction/consolidation.Strategy Summary for Long EntryFundamental Driver (Why Buy): Gold is typically bought as a safe-haven asset during times of economic or geopolitical uncertainty (e.g., wars, high inflation, recession fears).2 A sustained weakening of the US Dollar (USD) or a dovish outlook from the US Federal Reserve (Fed) (e.g., expected interest rate cuts) is also a strong bullish signal for XAU/USD.Technical Trigger (When to Buy):Support/Retracement: Look for the price to pull back to a key historical Support level or a major Fibonacci Retracement level (like 3$50\%$ or 4$61.8\%$) within an existing uptrend.5Confirmation: Enter the trade when a strong bullish candle (e.g., a Pin Bar or Bullish Engulfing) forms at that key support level, confirming buyer defense.Trend Following: Wait for a breakout above a recent minor resistance level (or consolidation range) to confirm the continuation of the main uptrend.6Risk Management:Stop-Loss (SL): Place the Stop-Loss below the confirmation support level or the most recent swing low to protect against an invalidation of the bullish structure.7Take-Profit (TP): Target the most recent swing high or use Fibonacci Extension levels to project higher targets.

Gold (XAUUSD) – 22 Oct | Watching Key Zones for Short Setup🟡 Gold (XAUUSD) Analysis – 22 October
Hello Disciplined Traders,
Welcome to the Chart Is Mirror Community 👋
Market Context
• Gold is currently in an H4 pullback phase.
• The M15 structure is bearish , with a confirmed ChoCH + BoS to the downside — keeping the short-term bias aligned with the higher timeframe pullback.
• The market has formed a broad range between 4381 (high) and 4004 (low) .
• After retesting the 4381 supply zone in yesterday’s session, price dropped sharply and touched the 4004.280 H4 demand zone , showing strong buying pressure.
Key Observations
• Despite buying reaction from the demand zone, there’s no clear internal structure formed yet to support a long setup.
• The market remains bearish unless a clean M15 structure shift upside occurs.
Execution Plan
• Primary sell zone to watch: 4246–4277.8 OB zone .
• Next potential sell POI: 4353.7–4381 major supply zone .
• If either POI is respected with LTF confirmation , we’ll plan short setups accordingly.
• Without confirmation — stay patient and observe.
Stillness is clarity — let structure confirm before you act.
📘 Shared by @ChartIsMirror

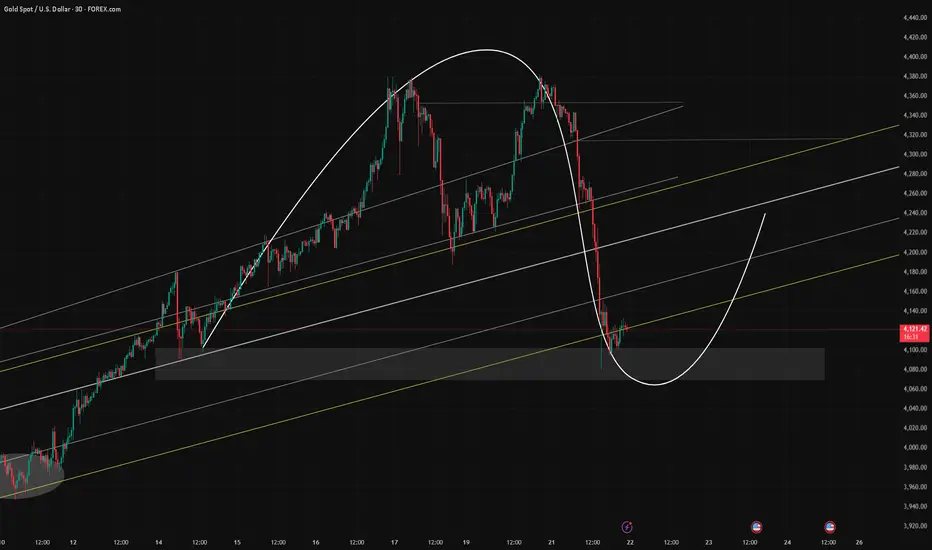
Gold – 24 Hours of Chaos: From 4400 to 4000The last 24 hours in Gold trading were absolutely insane. After retesting the 4400 zone all-time high last night, XAUUSD literally collapsed, dropping straight to the 4000 zone in just one day — a 10% move that’s unheard of for gold (at least I haven't seen).
1️⃣ Technical Picture
Once the price broke back below 4200, it confirmed a double top formation, and the selloff accelerated dramatically toward its measured target around 4000 — a level also supported by the ascending trendline that started in late August.
2️⃣ Current Context
At the time of writing, gold already rebounded nearly 1300 pips from the low, which means there’s no attractive level to enter long right now, even though the recovery might continue in the short term.
3️⃣ Key Levels to Watch
• Resistance: 4200 zone – now turned into a major resistance. If the price revisits this level, I’ll be looking for short setups, ideally on intraday spikes.
• Support: 4000 zone – if the price dips again before testing resistance, it could offer long opportunities from this confluence area.
4️⃣ Trading Plan
In short, we’re in a wide range between 4000 and 4200, both levels offering potential trades but in opposite directions. For now, I’ll stay patient and wait for price to get closer to one of these extremes before taking action.
⚠️ Final Note
Volatility is off the charts, so if you decide to trade XAUUSD these days, adjust your stop losses and targets accordingly. This is not the time for tight stops, is time for patience, and flexibility. 🚀

Gold price analysis October 22GOLD UPDATE – Strong Correction Pressure Appears
After a long rally, gold witnessed a sharp decline yesterday, with a deep correction of up to 300 prices - a rare number in the recent period. This shows that profit-taking pressure from buyers is increasing, and the short-term correction trend may continue today.
In the context of the temporary pause in the uptrend, the resistance zones above will play an important role in observing price behavior. If there is a clear price rejection signal at these zones, the priority strategy will be to SELL according to the correction wave.
📉 SELL trigger: When there is a price rejection at the resistance zone of 4179 - 4226
🎯 Target: 3946
The short-term trend is leaning towards a downward correction, so keep a close eye on the price reaction to avoid missing out on the opportunity to trade in the right direction.

Gold Price Outlook – Trade Setup (XAU/USD)📊 Technical Structure
Gold tumbled below $4,100, finding temporary support around $4,085–$4,093.
The chart shows a descending trendline, keeping short-term momentum bearish.
Immediate resistance lies at $4,142–$4,151, while the support zone is at $4,085–$4,093.
A break above the trendline could trigger a rebound toward resistance, but failure may open the door to deeper losses.
📌 Trade Setup
Entry: $4,093
Stop Loss: $4,080 (below support zone)
Take Profit: $4,150 (resistance retest)
Risk-to-Reward (R:R): ≈ 1 : 4.45
🌍 Macro Background
Gold is pressured by easing US-China trade tensions as both sides prepare for potential tariff negotiations ahead of November 1. This weakens safe-haven flows. At the same time, the steep profit-taking after a nine-week rally adds to selling pressure.
However, risks from the prolonged US government shutdown, concerns over global debt sustainability, and expectations of further Fed rate cuts (October and December) continue to support the medium-term bullish case for gold.
Markets now await US CPI data on Friday (YoY expected at 3.1%), which will be a crucial trigger for USD and gold direction.
🔑 Key Technical Levels
Resistance: $4,142 / $4,151
Support: $4,093 / $4,085
Upside Target (breakout): $4,150–$4,160
Downside Target (failure): $4,070 / $4,050
📋 Trade Summary
Gold faces strong downside momentum but holds above the $4,085 support zone. Short-term strategy favours a rebound trade on a breakout above the descending trendline, targeting $4,150. However, if support fails, the decline could accelerate toward $4,070–$4,050.
⚠️ Disclaimer
This analysis is for reference only and does not constitute trading advice. Trading involves significant risk, and proper risk management is essential.

Gold price analysis October 21GOLD UPDATE – Buying opportunity is forming after a strong correction
Today's European session recorded a rather deep correction of gold, when the price fell nearly 100 USD before temporarily stabilizing again. However, the main trend is still leaning towards the Buyers, and the support zones below are considered ideal areas to observe BUY signals.
Notable zones include: 4223 – 4193 – 4267, where the market may react and create opportunities to enter orders.
The upcoming US session is still likely to maintain the upward momentum, so the priority strategy at this time is still to wait for BUY when there is a confirmation signal of price rejection at support.
🎯 Trading plan:
BUY NOW: 4367
BUY Trigger: when there is a signal of price rejection at 4223 or 4193
Target: 4500

Today's trading strategy for gold is hoped to be helpful to you.The core logic: The key reasons behind the price changes
1.Long - term support remains: This year, the price of gold has risen from $3000 all the way to an all - time high of over $4380. Several major factors are at play. On the one hand, the Federal Reserve began to cut interest rates in September and may continue to do so in the future. The cost of holding gold has become lower, making everyone more willing to buy. On the other hand, the continuous government shutdown in the United States, coupled with the unresolved tense situations in the Middle East, Eurasia and other places, has made the market's concerns about the economy more prominent, thus highlighting the safe - haven value of gold. Another important support is that central banks around the world have been buying gold. Many countries, such as China and Poland, have been increasing their holdings. These long - term purchases can underpin the price of gold and reduce the possibility of a sharp decline.
2.Reasons for short - term fluctuations: Recently, the price of gold has dropped from around $4380 to $4090. Mainly, it is because the previous increase was too fast, and some investors sold to take profits, bringing selling pressure. In addition, there is news that the U.S. government shutdown may end this week, which has temporarily reduced part of the safe - haven demand and also led to a price decline. However, from the perspective of the trend, this correction is more like a short - term rest rather than a trend reversal.
Today's Gold Trading Strategy
xauusd@buy:4080-4100
pt:4130-4150
sl:4030

A game for the brave. Please participate.Amidst the surging tides of the trend, every ship appears adept. But the true test isn't speed, but staying at sea. Survival is more important than success. Respect the market. Quaid hopes everyone can maintain a steady pace amidst volatility and reap their own wave of wealth.
Gold prices retreated after reaching a high of 4381 on Monday. Early analysis indicated a potential "double top" pattern.
Based on the previous daily fluctuations of around $100, initial expectations suggested a range-bound market fluctuation of 4381-4270. However, the actual trend far exceeded expectations. Prices plummeted from the 4381 high, triggering a sell-off, with the largest single-day drop reaching $300. This market action further demonstrates market uncertainty. Quaid advises everyone to maintain a cautious approach and strictly set stop-loss orders, whether long or short.
A sharp decline is always preceded by a rebound. Prices declined in early Asian trading, not incrementally. Irrational declines will eventually reverse. Don't be intimidated by the market at this time. Don't trade with a normal mindset. Position management is paramount. A 10-point stop-loss is completely unbearable right now, so reduce your position size to about one-third of your normal size.
When the market plummets or soars, you can open positions in batches to keep the total transaction loss within the controllable range of the account.
For short-term trading, you can enter short positions around 4130. I'll update specific trading strategies on the channel, so stay tuned.

GOLD (XAU/USD) Game Plan GOLD (XAU/USD) Game Plan
📊 Market Sentiment
Market sentiment for GOLD remains extremely bullish, driven primarily by central bank accumulation.
Since 2023, global central banks — led by China — have been buying gold aggressively, creating a long-term demand base.
With the FED preparing to initiate QE while inflation remains elevated, risk assets like GOLD are expected to outperform as USD (DXY) weakens.
This macro setup builds a powerful bullish narrative that continues to favor long exposure on gold.
📈 Technical Analysis
GOLD has rallied for nine consecutive weeks since mid-August, reaching overbought RSI levels.
Currently, price is showing signs of retracement and consolidation, suggesting an accumulation phase may form before the next impulsive move.
The Weekly Fair Value Gap (FVG) around $4010, just below the HTF bullish trendline, acts as a critical support area where a potential deviation and bounce may occur.
📌 Game Plan
I expect GOLD to retrace toward the HTF trendline and Weekly FVG ($4017).
A deviation and bounce from this zone could trigger a new bullish leg.
However, I anticipate 1–2 weeks of accumulation before continuation.
💬 Like, follow, and comment if this breakdown supports your trading! More setups and market insights coming soon — stay connected!
⚠️ Disclaimer: This content is for informational and educational purposes only and does not constitute financial, investment, or trading advice. Always DYOR before making any financial decisions.

Gold Market Nearing a Bottom — Trade with CautionAfter yesterday’s sharp decline, the market is likely entering a gradual bottoming phase. As I mentioned on Saturday, there are still unfilled gaps at 4019–4024 and 3887–3898. If the bears remain dominant, the 4019 gap could be filled, though a move toward 3887 seems less likely unless major negative news triggers it.
During any rebound, pay close attention to the 4200–4250 resistance area. If prices fail to stabilize there, the weekly chart pattern will weaken, increasing the risk of a drop toward the 3887 gap. Overall, trade with caution in the near term — the market is being influenced by multiple factors, leading to heightened volatility and risk. Being cautious never hurts.
While making profits is important, protecting your account comes first — otherwise, gains mean little. If you prefer fewer, safer trades, focus on the key price zones mentioned above and observe the market more than you act. For those continuing with short-term or scalping strategies, be sure to control your target prices strictly, especially now as the broader trend direction is still being established.
Of course, everyone has his or her own trading methods and theories. I will not comment too much here, but just share my own views. If you think it is useful, use it. If it is not useful, just watch the fun.
ElDoradoFx PREMIUM – GOLD ANALYSIS (22/10/2025, ASIA SESSION)Gold (XAUUSD) is currently trading around 4,125, attempting a minor recovery after a strong bearish breakdown during the US session. Price found near-term liquidity around 4,106–4,100, where a short-term bounce is unfolding. Despite this pullback attempt, the overall structure remains bearish unless key resistance levels are reclaimed.
⸻
🔍 Technical Outlook
Daily Chart (D1)
• Strong bearish candle formed after rejection from 4,381.
• Price still above 20EMA and well above 50EMA, confirming a corrective move within a broader bullish trend.
• RSI cooling from overbought; now around mid-level, room for either further correction or bounce.
• MACD still positive but histogram weakening, suggesting potential retracement or pause.
Bias: Corrective bearish inside macro bullish trend.
⸻
1H Chart (H1)
• Clear bearish shift with BOS confirmed below 4,254 and 4,229.
• Rejection from 20EMA and 50EMA above (4,170–4,249) confirms intraday bearish bias.
• RSI recovering from oversold (26→38) indicating a potential pullback leg.
• If gold climbs into 4,160–4,198 zone and rejects, bearish continuation likely.
Intraday Bias: Bearish until H1 closes above 4,200–4,210.
⸻
15M Chart (M15)
• Minor CHoCH formed after bounce at 4,106, with price entering a corrective channel.
• RSI around 55 → short-term recovery phase.
• MACD histogram green but still shallow → possible retracement only.
• Price approaching first resistance around 4,140–4,150.
Short-term View: Pullback phase inside bearish structure.
⸻
5M Chart (M5)
• Series of higher lows forming → bullish momentum attempt.
• MACD positive with expanding green bars.
• RSI above 55 suggests buyers in short control, but nearing resistance.
⸻
✨ Fibonacci Golden Zone
Recent impulse: High 4,254 → Low 4,106
🔹 38.2% Fib = 4,160
🔹 50% Fib = 4,180
🔹 61.8% Fib = 4,198
✅ Golden Zone: 4,160 – 4,198
This zone aligns with intraday EMA resistance and H1 supply, making it a key sell area if rejection occurs.
⸻
🎯 High Probability Scenarios
✅ Bearish Continuation Setup (Preferred)
⚠️ Sell in the 4,160–4,198 Golden Zone upon bearish rejection.
🎯 Targets → 4,140 → 4,120 → 4,106 → 4,080
🛑 SL above 4,210
✅ Breakout Sell (Momentum Play)
⚠️ Sell below 4,106 (Break & Retest)
🎯 Targets → 4,080 → 4,060 → 4,040
🛑 SL above 4,120
⸻
🟢 Bullish Countertrend Setup (Lower Probability)
✅ Buy from 4,106–4,100 only if strong bullish engulfing + MACD flip appear.
🎯 Targets → 4,140 → 4,160 → 4,180
🛑 SL below 4,090
🟢 Bullish Breakout Setup (Structure Shift Only)
✅ Buy above 4,200 (Break & Retest)
🎯 Targets → 4,229 → 4,254
🛑 SL below 4,180
⸻
📅 Fundamental Outlook – Asia Session
• No major Asian economic catalysts early session → market may retrace or range.
• Traders likely positioning for NY session after heavy US selling.
• USD Index holding firm; any DXY weakness could extend pullback.
• Focus shifts to US jobless data and Fed sentiment later today.
⸻
⚠ Key Levels to Watch
Type Level Description
Resistance 4,140 / 4,160 First intraday rejection zones
Resistance 4,180 / 4,198 Fibonacci Golden Zone
Support 4,120 Minor intraday support
Support 4,106–4,100 Liquidity shelf
Support 4,080 Deep corrective target
⸻
✅ Summary
Gold is undergoing a corrective bounce within a bearish intraday trend. The Golden Zone (4,160–4,198) is the critical area for potential continuation sells if rejection is confirmed. A failure to clear 4,200 keeps sellers in control. Buyers only gain momentum above 4,200, or at deep retests near 4,106 with bullish confirmation.
🟢 Reversal Buy only if 4,106 holds with strength.
🔻 Main Scenario: Sell rallies from 4,160–4,198 zone.
📉 Break Confirmation: Sell below 4,106.
✨ Golden Zone: 4,160 – 4,198.
⸻
🥇 ElDoradoFx PREMIUM 2.0 – PERFORMANCE 21/10/2025 🥇
📊 GOLD TRADE RESULTS:
🔻 SELL +210 pips
🟢 BUY LIMIT +20 pips
❌ BUY –40 pips (SL)
🟢 BUY +70 pips
🟢 BUY +100 pips
🔻 SELL +210 pips
🟢 BUY +270 pips
---
💰 TOTAL GOLD PIPS WON: ✅ +840 pips
📈 RESULT: 7 Signals → 6 Wins | 1 SL
🎯 ACCURACY: 86%
---
🔥 Solid upward momentum and precision in reversals — swing continuation played out beautifully 📈💎
👏 Congratulations if you profited! ✅✅✅🚀🚀🚀
