GOLD (XAU/USD) BULLISH CONTINUATION SETUP AFTER RETESTChart Overview
Timeframe: 1H (Hourly)
Current Price: Around $4,338
Trend: Strong bullish trend within a rising channel
Structure: Price broke slightly above the channel top and is now retesting the resistance level as potential new support
🔍 Detailed Analysis
1. Trend Structure
Gold has been moving in a strong upward channel, showing consistent higher highs and higher lows.
The breakout above the resistance channel suggests bullish continuation, but a short-term pullback or retest is expected before another leg up.
2. Key Levels
Resistance Level: Around $4,350 – $4,370, now acting as support.
Entry Zone: Around $4,313 – $4,338 (highlighted region).
Stop Loss: Below $4,274 – $4,268 zone to protect against false breakouts.
Target Point: Around $4,509 – $4,513, which aligns with the projected move from the breakout zone.
💹 Trade Plan (Bullish Setup)
Entry: Wait for price to test and hold above $4,313 (confirmation candle or bullish rejection).
Stop Loss: $4,274 – $4,268 (below recent swing low).
Take Profit: $4,509 – $4,513.
Risk/Reward Ratio: Roughly 1:4, which is excellent for a continuation trade.
⚠️ Market Sentiment Notes
If gold fails to hold above $4,313, the move could turn into a deeper correction toward $4,250 – $4,200.
Watch for strong bullish candles near the entry zone for confirmation.
The setup remains bullish-biased, but patience for a clean entry is key.
✅ Summary:
Bias: Bullish
Setup Type: Pullback continuation
Buy Zone: $4,313 – $4,338
Target: $4,509 – $4,513
Stop: $4,268
Xauusdbuy

Maintain gold buying pressure above 4400⭐️GOLDEN INFORMATION:
Gold (XAU/USD) rebounds toward record highs after an earlier dip to the $4,280 zone, poised to close its ninth straight week in positive territory. Persistent geopolitical risks, renewed US-China trade tensions, and the prolonged US government shutdown keep investors cautious, driving safe-haven demand. Meanwhile, dovish Federal Reserve expectations—with markets pricing in two more rate cuts this year—continue to weigh on the US Dollar and bolster the yellow metal. Despite overbought conditions, steady dip-buying suggests the path of least resistance for Gold remains to the upside.
⭐️Personal comments NOVA:
Gold price has almost no significant selling pressure, huge fomo market for strong uptrend above 4400
⭐️SET UP GOLD PRICE:
🔥SELL GOLD zone: 4436 - 4438 SL 4443
TP1: $4425
TP2: $4412
TP3: $4400
🔥BUY GOLD zone: $4278-$4276 SL $4271
TP1: $4285
TP2: $4298
TP3: $4310
⭐️Technical analysis:
Based on technical indicators EMA 34, EMA89 and support resistance areas to set up a reasonable BUY order.
⭐️NOTE:
Note: Nova wishes traders to manage their capital well
- take the number of lots that match your capital
- Takeprofit equal to 4-6% of capital account
- Stoplose equal to 2-3% of capital account

ElDoradoFx PREMIUM – GOLD ANALYSIS (17/10/2025, LONDON SESSION)Prepared by: ElDoradoFx Premium Analyst Team
⸻
🧭 Market Overview
Gold remains in a strong bullish cycle, printing higher highs and higher lows across all major timeframes. However, after multiple rejections near $4,379–$4,380, the market is showing temporary exhaustion, hinting at a possible short-term retracement before continuation.
RSI readings above 85 on the daily chart suggest the metal is overbought, yet momentum structure remains intact.
⸻
📊 Technical Breakdown
1️⃣ Daily Chart (D1)
• Structure: Clear bullish trend continuation.
• RSI: 86.0, signaling potential short-term correction.
• Key Support: 4,316 – 4,273 (previous resistance now turned support).
• Bias: Bullish but extended — watch for retracement into 38.2%–61.8% Fib zone.
2️⃣ 1H Chart (H1)
• Price rejected resistance at 4,379, forming a lower high with weakening MACD histogram.
• 50EMA and 200EMA both sloping upward — overall momentum remains long-term bullish.
• Support Zone: 4,336–4,318 (Fibonacci confluence).
• Bias: Short-term corrective retracement expected before new buying momentum resumes.
3️⃣ 15M–5M Charts
• Consolidation within a tight intraday channel.
• Liquidity above 4,379 remains uncollected — likely target after correction.
• MACD turning flat, confirming short-term pause.
⸻
📐 Fibonacci Analysis (Last Swing: 4,273 → 4,379)
Level Price Confluence
38.2% 4,336 Near EMA50 & intraday support
50.0% 4,326 Mid-channel support
61.8% 4,318 Trendline intersection / re-entry zone
📊 Fibonacci Golden Zone: 4,318–4,336
→ Optimal area to look for bullish confirmation patterns before re-entry.
⸻
🎯 High-Probability Trade Scenarios
✅ BUY SCENARIO (Primary Bias)
• Break & Retest: Above 4,364, confirming short-term bullish continuation.
• Retest Zone: 4,350–4,355
• Targets:
• TP1 → 4,379
• TP2 → 4,395
• TP3 → 4,410
• Stop-Loss: Below 4,338
⚠️ SELL SCENARIO (Countertrend Opportunity)
• Break & Retest: Below 4,336, signaling potential correction phase.
• Retest Zone: 4,336–4,345
• Targets:
• TP1 → 4,318
• TP2 → 4,300
• TP3 → 4,273
• Stop-Loss: Above 4,355
🚀 AGGRESSIVE BREAKOUT BUY
• Trigger: Clean breakout above 4,379 and candle closure.
• Retest Zone: 4,372–4,379
• Targets: 4,395 → 4,410 → 4,428
• Stop-Loss: Below 4,355
⸻
📰 Fundamental Outlook
• US Data: Light calendar until NY session; traders watching inflation expectations.
• DXY: Below 104.80, maintaining downward bias, supportive for gold.
• Yields: Neutral; no fresh upside momentum observed.
• Global Sentiment: Slightly risk-off, benefiting gold as a hedge.
⸻
⚙️ Key Technical Levels
Type Levels
Resistance 4,379 / 4,395 / 4,410
Support 4,336 / 4,318 / 4,273
Pivot Zone 4,350–4,355 (London liquidity area)
⸻
🧾 Analyst Summary
Gold remains structurally bullish while holding above 4,336, though an intraday pullback into the Fibonacci Golden Zone (4,318–4,336) would offer better long entry opportunities.
A confirmed break above 4,379 can open a clean path toward 4,410–4,428.
If 4,336 fails to hold, expect a healthy retracement toward 4,300–4,273 before the next bullish impulse.
⸻
📈 Bias: Bullish above 4,336 — Corrective phase expected before continuation.
📉 Alternative Bias: Bearish short-term below 4,336 (retracement only).

Gold Price Outlook – Trade Setup (XAU/USD)📊 Technical Structure
OANDA:XAUUSD Gold surged to a fresh record near $4,380 before retracing lower, now consolidating around $4,320–$4,330. The support zone sits at $4,301–$4,290, while the resistance zone is located at $4,368–$4,377. Price action shows a sharp pullback from highs, but bulls still hold ground above the key support. A rebound scenario could see a push back toward the resistance, while a decisive break below $4,285 would invalidate the bullish setup.
🎯 Trade Setup (Bullish Scenario)
Entry: $4,301–$4,290 (near consolidation & above support)
Stop Loss: $4,285
Take Profit 1: $4,350
Take Profit 2: $4,368
Take Profit 3: $4,377
Risk/Reward: ≈ 1 : 4.91
🗝️ Key Technical Levels
Resistance: $4,350 / $4,368 / $4,377
Support: $4,301 / $4,290
🌍 Macro Background
Gold remains supported by Fed rate cut bets, US-China trade frictions, and prolonged US government shutdown fears.
Fed Policy: Powell and Waller signalled two more cuts this year, reducing the opportunity cost of holding gold.
US-China Tensions: Additional port fees and tariff threats fuel safe-haven demand.
US Government Shutdown: Entering its third week, weighing on the USD and indirectly boosting gold.
Geopolitics: Some easing in Ukraine risks could cap upside, but macro drivers remain gold-positive.
📌 Trade Summary
Gold remains in a strong uptrend despite intraday corrections. A long setup near $4,301–$4,290 with stops under $4,285 offers a favourable risk-reward toward $4,368–$4,377. Safe-haven demand and dovish Fed expectations continue to support bullish momentum.
⚠️ Disclaimer
This analysis is for reference only and does not constitute trading advice. Trading involves significant risk, and proper risk management is essential.

ElDoradoFx PREMIUM 2.0 – GOLD (17/10/2025, ASIA SESSION)Gold is currently trading around 4,362, maintaining strong bullish momentum after breaking the 4,350 psychological level. The market remains in an extended uptrend, but RSI and structure show overbought signs, so a short-term correction or retest may occur before continuation.
⸻
🔍 Technical Outlook
D1: Strong bullish structure with higher highs and higher lows. RSI (88.1) indicates extreme overbought — possible short-term pullback.
H1: Price reached the top of the ascending channel at 4,379 (new high) and is now consolidating below. Momentum remains positive above 4,340, but divergence is forming.
15M–5M: Minor rejection from 4,379–4,380 resistance zone; MACD showing slowing bullish histogram — suggesting potential retest before next leg up.
⸻
📊 Fibonacci Golden Zone (Latest Swing)
Swing Low → 4,291
Swing High → 4,379
🎯 Golden Zone = 4,324–4,338
This aligns with 50EMA + channel midline — ideal retracement area for new buy entries if price dips.
⸻
🎯 High Probability Entry Zones (Break & Retest)
✅ BUY SETUP (Main Bias)
• Break & Retest: Above 4,363 → Retest zone 4,350–4,355
🎯 TP1 → 4,379 TP2 → 4,395 TP3 → 4,410
🛑 SL below 4,338
⚠️ SELL SETUP (Short-Term Countertrend)
• Break & Retest: Below 4,338 → Retest zone 4,338–4,345
🎯 TP1 → 4,324 TP2 → 4,310 TP3 → 4,294
🛑 SL above 4,355
🚀 BREAKOUT BUY (Aggressive Setup)
• Break & Retest: Above 4,379 (new high) → Retest 4,372–4,379
🎯 TP1 → 4,395 TP2 → 4,410 TP3 → 4,428
🛑 SL below 4,355
⸻
🕐 Fundamental Watch
• DXY slightly weaker near 104.85, favoring gold’s bullish continuation.
• Yields remain capped — positive for metals.
• No major Asia-session news expected — technicals will drive price action.
⸻
⚠️ Key Levels
Resistance → 4,379 / 4,395 / 4,410
Support → 4,338 / 4,324 / 4,310
⸻
✅ Summary
Gold remains bullish while above 4,338 (Golden Zone support).
A break & retest above 4,363 opens room for continuation toward 4,395–4,410.
Failure to hold above 4,338 may trigger a healthy pullback to 4,310–4,294 before new buyers step in.

Gold: Full verification of today's trend prediction👏Our prediction for today's gold trend has been validated by the market:
1.Key Level Prediction: We previously indicated that after consolidating with oscillations during the daytime, gold would require close attention to the breakthrough and stabilization of the 4250 level, a break above this level was expected to sustain an upward momentum. The actual market movement showed that after completing its daytime fluctuations, gold successfully broke through 4250, stabilized above it, and immediately initiated an upward rally.
2.Target Range Achievement: Based on the breakthrough logic, we set the preset upward target range at 4280 – 4300. By the end of today’s trading session, gold had successfully reached this range, peaking at 4298.64. The accurate realization of the target validates the effectiveness of our judgment on bullish momentum and resistance levels.
💡Our today’s prediction for gold was built on the core framework of "technical key level breakthrough + trend continuity": it focused on the "sustained bullish momentum following a breakthrough of key resistance", and incorporated an analysis of market sentiment and volume logic. Ultimately, this resulted in a high degree of alignment between the prediction and the actual market trend.

Gold: Keep an eye on the 4280–4300 rangeAs we predicted for today’s target range, gold is currently fluctuating between 4230 and 4250. After stabilizing above 4230, it once again staged a strong rally, peaking at 4250.91 before pulling back with a certain decline — this also confirms the resistance effect at the 4250 level today.
However, we confirm that a break above 4250 can be achieved in an instant. After breaking through and stabilizing above 4250 next, we will focus on the resistance zone around 4280–4300. For short-term support below, the key focus remains on the range of 4200–4175.

ElDoradoFx PREMIUM – GOLD (16/10/2025, US SESSION)Professional Technical & Fundamental Breakdown by ElDoradoFx
Gold is currently trading near 4,241, consolidating below the resistance zone 4,246–4,250, after a strong bullish rally in the London session. The market structure remains bullish, but there are signs of temporary exhaustion at the top of the ascending channel.
⸻
🔍 Technical Outlook
Daily (D1):
• Price continues forming higher highs, maintaining strong bullish momentum.
• RSI remains extremely overbought (85.4), suggesting limited upside before a corrective move.
• MACD still bullish but starting to flatten — showing early divergence risk.
1H (H1):
• Price touched the upper channel trendline at 4,247 and rejected slightly, forming a weak high.
• EMAs (50 & 100) are below price supporting structure; however, bullish momentum is slowing down.
• RSI at 64.7 — healthy but approaching overbought intraday conditions.
15M–5M:
• Multiple BOS confirmations and minor pullbacks indicate bulls still in control.
• MACD shows positive momentum but histogram is flattening — suggesting a possible short-term retracement before continuation.
• Immediate intraday support located at 4,228–4,230 zone.
⸻
📊 Fibonacci Golden Zone (Latest Swing)
Swing Low → 4,203
Swing High → 4,247
🎯 Golden Zone = 4,223–4,230
This zone aligns with 50EMA and channel mid-support — ideal re-entry point if price pulls back before resuming the uptrend.
⸻
🎯 High Probability Entry Zones
✅ BUY SETUP (Main Bias)
Entry Zone: 4,223–4,230 (Golden Zone)
🎯 TP1 → 4,242 TP2 → 4,255 TP3 → 4,268
🛑 SL below 4,210
⚠️ SELL SETUP (Short-Term Countertrend)
Entry only if price fails again to break 4,247 and closes below 4,228
🎯 TP1 → 4,215 TP2 → 4,203 TP3 → 4,185
🛑 SL above 4,250
🚀 BREAKOUT BUY (Aggressive Setup)
Buy above 4,247 (Clean Breakout)
🎯 TP1 → 4,260 TP2 → 4,275 TP3 → 4,290
🛑 SL below 4,228
⸻
🕐 Fundamental Outlook
• DXY trading flat around 105.05, failing to extend upside — mildly supportive for gold.
• Yields remain steady, adding temporary equilibrium to the market.
• Fed speakers later today could trigger intraday volatility; trade with caution near resistance zones.
⸻
⚠️ Key Levels to Watch
Resistance → 4,246 / 4,255 / 4,268
Support → 4,230 / 4,223 / 4,210 / 4,203
⸻
✅ Summary
Gold remains in a strong bullish structure.
If 4,223–4,230 holds, expect continuation toward 4,255–4,268.
Failure to hold 4,228 could open retracement toward 4,203–4,185 before resuming upside.

Gold Maintains Upward Channel Toward $4320 TargetAnalysis:
The XAU/USD 45-minute chart shows gold continuing its steady rise within a well-defined ascending channel. The price action maintains higher highs and higher lows, confirming a sustained bullish trend.
Currently, gold is testing the midline of the channel, suggesting a possible minor pullback before resuming upward momentum toward the projected resistance near $4320. This level aligns with the upper boundary of the channel, acting as the next potential target zone for buyers.
As long as the price remains above the lower channel support, the bullish structure remains intact. A breakout above $4320 could open further upside potential, while a drop below the channel could signal early weakness or short-term consolidation.

Gold: Go long around the 4205–4210Gold has risen for the fifth consecutive day, briefly breaking through the all-time high of 4241.99, before pulling back to around 4210 as the U.S. Dollar Index regained lost ground.
From the 4-hour chart perspective, focus on the short-term support range of 4196–4200 in the near term, with key emphasis on the critical support zone of 4160–4180. Based on its recent performance, all pullbacks are traps set by bulls. Currently, bullish momentum remains intact as prices consolidate above 4230. The only viable approach is to wait patiently for retracements before entering long positions.
For intraday gold trading, we recommend entering long positions around the 4205–4210 range, with targets set near 4230 and 4250. Given the strong bullish trend, there is no clear top in sight. Operationally, prioritize buying on dips; avoid trading in the middle range and refrain from chasing rallies recklessly. Exercise patience and wait for entries at key levels.
Buy 4205 - 4210
TP 4230 - 4250
SL 4195
Daily-updated accurate signals are at your disposal. If you run into any problems while trading, these signals serve as a reliable reference—don’t hesitate to use them! I truly hope they bring you significant assistance

Gold: Breaks through 4200 to hit a new all-time high📈Gold has once again refreshed its all-time high, supported by escalating concerns over U.S.-Asia trade and expectations that the Federal Reserve may cut interest rates twice more within the year.
📝The strong rally of gold this time is mainly driven by two key factors:
First, global trade worries have intensified. U.S. President Trump stated on Tuesday that he might suspend edible oil trade with Asian countries—a move that triggered a sharp surge in market safe-haven demand. In response, Asian countries have warned of retaliatory measures, further worsening trade tensions.
Second, expectations for Fed rate cuts have heated up. Federal Reserve Chair Jerome Powell hinted at another 0.25-percentage-point interest rate cut this month, and the market generally expects two rate cuts to be implemented within the year. The low-yield environment has significantly reduced the opportunity cost of holding non-interest-bearing assets, providing sustained support to the precious metals market.
In today’s early session, gold bulls stabilized in the 4140 zone and gained momentum again. As of now, gold has broken through the $4,200 mark to reach a new all-time high. For gold’s current trend, we remain bullish, with upside targets at 4,300 and 4,500. Do not attempt to predict the top until there are clear signs of a peak. Undoubtedly, the primary trading strategy remains "buying on dips." Key support levels to watch include today’s intraday low and the short-term uptrend support that has been in place since 4,090. If this support holds, the bullish momentum will remain strong and gold will continue to hit new highs. Key resistance zones to focus on above are 4,210–4,215, followed by 4,245–4,240.
Nevertheless, investors must closely monitor changes in geopolitical situations and signals from the Federal Reserve, adjust strategies flexibly, and strictly control risks.
💎Buy 4160 - 4165
TP 4180 - 4190 - 4200
SL 4150
Daily-updated accurate signals are at your disposal. If you run into any problems while trading, these signals serve as a reliable reference—don’t hesitate to use them! I truly hope they bring you significant assistance

ElDoradoFx PREMIUM – (16/10/2025, LONDON SESSION)Professional Technical & Fundamental Breakdown by ElDoradoFx
Gold is currently trading around 4,223, rebounding from the Asian low 4,203 after a liquidity sweep. The metal remains within its ascending structure but is showing signs of exhaustion below 4,242, which remains the daily high and the main resistance barrier.
⸻
🔍 Technical Outlook
Daily (D1):
• Strong bullish trend remains intact; candles consistently printing higher lows.
• RSI at 84.9, heavily overbought, signaling limited upside without a correction.
• MACD still bullish but starting to flatten — watch for potential divergence.
1H (H1):
• Price retested the ascending channel support and bounced from the 50EMA + 100EMA confluence (4,203–4,213).
• Currently approaching minor resistance 4,228–4,235 — rejection here could trigger another pullback.
• RSI neutral at 58–60, showing potential equilibrium before breakout or rejection.
• MACD histogram turning positive again, confirming short-term buyer momentum.
15M–5M:
• Clear BOS and sweep of liquidity below 4,203, followed by strong bullish engulfing — intraday bullish bias.
• 5M chart shows early momentum loss near 4,228, caution for fake breakouts.
• Volume recovering after Asian quiet period; London likely to set the directional tone.
⸻
📊 Fibonacci Golden Zone (Latest Swing)
Swing Low → 4,203
Swing High → 4,242
🎯 Golden Zone = 4,213–4,219
This area aligns with moving average support and mid-channel retest — high-probability reentry point for continuation buys.
⸻
📌 High Probability Entry Zones
✅ BUY SETUP (Main Bias)
Entry Zone: 4,213–4,219 (Golden Zone)
🎯 TP1 → 4,235 TP2 → 4,242 TP3 → 4,255
🛑 SL below 4,203
⚠️ SELL SETUP (Countertrend)
Sell only below 4,203 (Break & Retest)
🎯 TP1 → 4,185 TP2 → 4,176 TP3 → 4,165
🛑 SL above 4,213
🚀 BREAKOUT BUY (Aggressive Setup)
Buy above 4,242 (Clean Breakout)
🎯 TP1 → 4,255 TP2 → 4,268 TP3 → 4,280
🛑 SL below 4,225
⸻
📅 Fundamental & Macro Overview
🕐 London session begins with cautious optimism as traders await U.S. data.
💵 DXY stabilizing near 105.10, slightly weaker, supporting gold’s rebound.
📈 U.S. yields remain capped, keeping the medium-term bullish structure intact.
⚙️ No high-impact news in early London hours — expect technical-led volatility.
⸻
⚠️ Key Levels to Monitor
Resistance → 4,228 / 4,235 / 4,242 / 4,255
Support → 4,219 / 4,213 / 4,203 / 4,185
⸻
✅ Summary
Gold is holding its bullish structure with strong recovery momentum from 4,203.
As long as 4,213–4,219 holds, bias remains bullish toward 4,235–4,242.
A confirmed break below 4,203 would shift bias short-term bearish toward 4,185–4,165.

Gold Analysis - Can Buyers Push the Price to $4,250?OANDA:XAUUSD is currently moving within a clearly defined upward channel, with prices consistently adhering to both the upper and lower boundaries of the channel. The recent bullish momentum indicates that the buyers are in control, creating a strong possibility for the uptrend to continue in the near future.
Recently, the price broke through a key resistance level and is now retracing to test it again. If this level holds as support, it will further reinforce the bullish structure, and the next target of 4,250 will become attainable, aligning with the upper boundary of the channel.
As long as the price remains above this support zone, the bullish outlook will remain intact. However, if the support is broken, the bullish scenario could be invalidated, increasing the likelihood of a deeper pullback.
Remember, before making any trading decisions, always confirm your setups and ensure you are managing risk effectively.

New zone for xauusd Gold (XAU/USD) is showing strong bullish momentum, trading around 4164 with potential continuation toward the 4236 resistance. Price may retest the fair value zone near 4150 before pushing higher, while support remains around 4091.

Gold — High Consolidation, Beware of a Sharp DropGood morning!
Yesterday, gold fell back near 4220 and tested the support near 3176 several times during the session. During the US trading session, the support moved up to the 4202-4196/80 area. As of now, this support is still maintained and the price has returned to above 4200.
On the smaller charts, some indicators still favor bullish sentiment, but divergence has emerged on the 2H/4H charts, suggesting that the market may need to consolidate before a new round of gains can begin. Therefore, caution is crucial during trading.
Therefore, in future trading, it is more advisable to sell at high levels. Trend-setting bulls should wait until consolidation is complete before entering the market.
Important Support:
30M: Near 4185. Focus on the 4180-4176 area.
1H: Near 4157.
4H: Near 4137, followed by the 4107-4088 area.
In the current environment, we cannot guess the top, but based on the technical pattern, if the price is higher than 4230, we should be cautious in chasing the rise. It is recommended to look for selling opportunities. In the current market, it is better not to trade than to blindly follow the trend. Once there is no news support, from the technical pattern alone, adjustments may occur at any time, and the amplitude is expected to be large, so everyone should be prepared to deal with it.

ElDoradoFx PREMIUM 2.0 – (16/10/2025, ASIA SESSION UPDATE)Gold closed the U.S. session around 4,208, consolidating below the psychological resistance at 4,218, where repeated rejections confirm a short-term supply zone. While the broader trend remains bullish, intraday charts show early exhaustion and divergence — suggesting Asia may start with a controlled pullback before the next impulse.
⸻
🔍 Technical Outlook
Daily (D1):
• Strong bullish continuation structure remains intact.
• RSI still in overbought territory (84), signaling potential pause or minor retracement.
• MACD positive but showing the first signs of flattening momentum.
1H (H1):
• Price remains within the ascending channel; multiple failed attempts to break 4,218 resistance.
• Immediate support around 4,197–4,192 (previous NY demand area).
• A clean break below 4,192 could open room toward 4,180–4,165.
• RSI (63) cooling down; MACD histogram decreasing, confirming loss of buying pressure.
15M–5M:
• Short-term CHoCH detected below 4,210; liquidity sweeps at the top suggest potential correction.
• 20EMA and 50EMA starting to converge — watch for momentum shift if 20EMA crosses below.
• MACD histogram fading with bearish crossover forming.
⸻
📊 Fibonacci Golden Zone (Latest Swing)
Swing Low → 4,165
Swing High → 4,218
🎯 Golden Zone = 4,176–4,184
This area aligns with 1H EMA confluence and the mid-channel structure — a potential “buy-the-dip” zone for continuation setups.
⸻
📌 High Probability Entry Zones
✅ Bullish Re-entry (Primary Setup)
Buy between 4,176–4,184 (Golden Zone)
🎯 Targets → 4,206 → 4,218 → 4,230
🛑 SL below 4,165
⚠️ Bearish Setup (Short-Term Correction)
Sell below 4,192 (Break & Retest confirmation)
🎯 Targets → 4,180 → 4,165 → 4,150
🛑 SL above 4,206
🚀 Breakout Buy (Aggressive)
Buy above 4,218 (Clean breakout)
🎯 Targets → 4,230 → 4,245 → 4,260
🛑 SL below 4,200
⸻
📅 Fundamental & Macro Outlook
🕐 Asia expected to open with reduced liquidity after CPI-driven volatility.
🕐 DXY stable around 105.25, keeping gold supported but capped near resistance.
🕐 Watch for Chinese market sentiment — stronger yuan could support temporary dips.
🕐 U.S. yields remain firm; this limits upside acceleration for gold short-term.
⸻
⚠️ Key Levels to Monitor
• Resistance: 4,206 / 4,218 / 4,230
• Support: 4,192 / 4,184 / 4,176 / 4,165
⸻
✅ Summary
Gold continues in a controlled bullish structure, but momentum is fading at the top.
Expect Asia session to test 4,184–4,176 (Golden Zone) before a potential rebound.
If price holds above 4,176, upside continuation toward 4,218–4,230 remains likely.
A confirmed close below 4,165 would shift the short-term bias to bearish correction.
--------
🥇 ElDoradoFx PREMIUM 2.0 – PERFORMANCE 15/10/2025 🥇
📊 GOLD TRADE RESULTS:
🔻 SELL LIMIT +40 pips
🟢 BUY (Swing) +420 pips (from 13/10)
🟢 BUY +60 pips
🔻 SELL –40 pips
🟢 BUY +60 pips
🟢 BUY +50 pips
🟢 BUY +320 pips
🔻 SELL +20 pips
🔻 SELL +110 pips
---
💰 TOTAL GOLD PIPS WON: +1,040 pips
📈 RESULT: 9 Signals → 8 Wins | 1 Loss
🎯 ACCURACY: 89 %
---
🔥 Consistent profits and flawless swing setups across GOLD!
👏 Congratulations if you profited ✅✅✅🚀🚀🚀

XAUUSD: The bullish structure remains intact📈Gold has strengthened further after staging a deep V-shaped rebound yesterday. It broke through the historic 4,200 level during the day, hitting a high near 4,218.
📝Whether looking at the 4-hour chart or the daily chart, the bullish trend remains solid. As such, long positions should remain the core trading strategy.
💡Today, we also took short-term short positions, but exited promptly once the market pulled back. Therefore, short positions can only be traded on an opportunistic basis with quick entries and exits. Long positions should still be the primary approach. Do not attempt to "call the top". there is no clear peak in sight. Today’s high will only be tomorrow’s low.
💎Buy 4160 - 4165
TP 4180 - 4190 - 4200
SL 4150
Daily-updated accurate signals are at your disposal. If you run into any problems while trading, these signals serve as a reliable reference—don’t hesitate to use them! I truly hope they bring you significant assistance

Gold Hits 4200 — A Key Turning Zone for the Next MoveGood afternoon, everyone!
After completing the 4067 resistance-to-support transition, gold continued its upward momentum and is now approaching the 4200 level — a new local high and a critical psychological resistance zone.
While some profit-taking pressure is expected near this level, the overall bullish structure remains intact, meaning any pullback could present buying opportunities for traders who missed earlier entries.
If the price retreats from around 4200, watch for support near 4176–4167.
If gold extends higher and stabilizes above 4210, focus on 4193–4187 as the next support area.
The main intraday support sits near 4176, and the primary trading bias remains buying on dips.
⚠️ Note: Upon the first rise above 4220, short-term profit-taking pressure may appear. Avoid chasing the price blindly and stay disciplined.
If the price climbs toward 4250, expect heavier selling pressure and heightened volatility — trade cautiously.
Today's Strategy:
✅ Buy near 4176 (buy the dip)
⚠️ Sell near 4220 (short near resistance)
For conservative traders, focus on buying on pullbacks; for aggressive traders, use scalp entries and manage risk tightly.
Gold Pullback Opportunity Within Strong Bullish MomentumAnalysis:
The XAU/USD chart shows that gold has maintained a powerful upward trajectory, breaking out of its previous consolidation channel (highlighted in purple). After the breakout, price surged to new highs near 4,120, confirming strong bullish momentum.
Currently, the market is showing a minor pullback toward the 4,090–4,060 zone — a region aligning with previous resistance turned support. This retracement appears healthy and could provide buyers a chance to re-enter before another leg up.
The bullish continuation setup is supported by:
Previous breakout retest: The price is testing the prior resistance area, which could now act as strong support.
Momentum structure: Higher highs and higher lows remain intact.
Favorable risk-reward ratio: The long position targets around 4,180, with stops below 4,060 support.

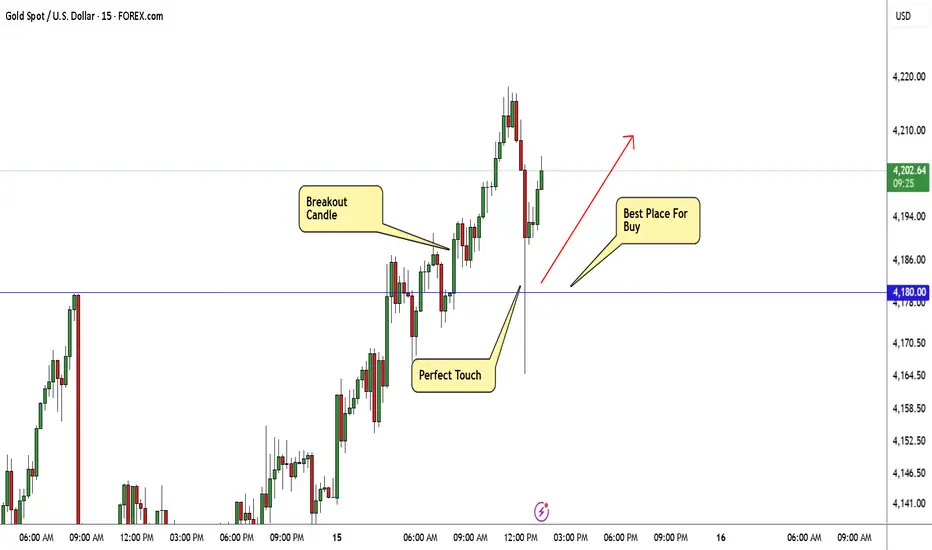
GOLD Breakout Done , Long Setup Valid To Get 300 Pips !Here is My 15 Min Gold Chart , and here is my opinion , the price going up very hard without any correction so we should move with it and we have a 4H Candle closure above our Res 4180.00 And Perfect Breakout and this give us a very good confirmation , so we have a good confirmation now to can buy after the price go back to retest the broken area 4180.00 One more time and we have already a great touch that take all stop losses before going up so i think the second touch will be better and will give us a good chance to enter with good stop loss , and we can be targeting 100 to 300 pips . if we have a daily closure below this area this mean this idea will not be valid anymore .
Reasons To Enter :
1- Perfect Touch For The Area .
2- Clear Bullish Price Action .
3- Bigger T.F Giving Good Bullish P.A .
4- The Price Take The Last High .
5- Perfect 4H Closure .
ElDoradoFx PREMIUM 2.0 – (15/10/2025, US SESSION UPDATE)📅 U.S. Session – 15 Oct 2025
💹 Prepared by ElDoradoFx Premium 2.0 Team
⸻
🧭 Market Overview
Gold is currently trading near 4,198, after failing to sustain the breakout above 4,206–4,218. The price is showing temporary weakness as intraday structure shifts toward a corrective phase within the bullish channel.
A deeper retracement may develop before new buyers step in, especially ahead of U.S. CPI reaction and liquidity sweeps.
⸻
🔍 Technical Outlook
D1 (Macro Trend)
• The daily candle remains bullish, but nearing exhaustion at channel resistance (4,218).
• RSI ≈ 84 → deep in overbought territory.
• MACD still strong but showing divergence — hinting possible short-term correction.
➡️ Macro bias: Bullish but stretched; expect retracement before continuation.
⸻
H1 (Intraday Structure)
• The structure remains within the rising channel, but momentum is slowing.
• 20EMA and 50EMA are flattening — suggesting short-term equilibrium.
• Current support: 4,187–4,182 zone, resistance: 4,206–4,218.
• A confirmed break below 4,182 opens space for a deeper pullback to 4,165–4,150.
➡️ Bias: Neutral-bullish → correction likely before next impulse.
⸻
15M–5M (Execution Zone)
• A CHoCH (change of character) formed around 4,206, confirming short-term bearish pressure.
• MACD shows fading momentum, RSI near 50 (neutral).
• Lower timeframe liquidity likely to target 4,180–4,175 before reaccumulation.
⸻
📊 Fibonacci Golden Zone
• Swing Low → 4,165
• Swing High → 4,206
🎯 Golden Zone = 4,174 – 4,179
This aligns perfectly with 1H demand zone and 200EMA — high-probability area for bullish re-entry.
⸻
🎯 High Probability Trade Scenarios
✅ Bullish Re-entry (Main Setup)
• Entry: 4,174–4,179 (Golden Zone)
• Targets: 4,193 → 4,206 → 4,218
• Stop-loss: Below 4,165
📗 Ideal low-risk entry after corrective pullback.
⸻
⚠️ Bearish Short-Term Setup (Countertrend)
• Entry: On confirmed break and close below 4,165
• Targets: 4,150 → 4,139 → 4,122
• Stop-loss: Above 4,182
📕 Short-term sell only if the structure fully breaks.
⸻
📈 Breakout Buy Setup
• Entry: Break and close above 4,218
• Targets: 4,230 → 4,245 → 4,265
• Stop-loss: Below 4,200
📗 Strong continuation confirmation toward new highs.
⸻
📅 Fundamental Watch
🕐 Key Event: U.S. CPI release later today — high volatility expected.
🕐 DXY holding around 105.25, showing indecision.
🕐 Pre-news consolidation expected, with breakout likely post-data release.
⸻
⚠️ Key Levels to Monitor
• Resistance: 4,206 / 4,218 / 4,230
• Support: 4,182 / 4,174 / 4,165 / 4,150
• Breakout Zones:
🔼 Buy above 4,218
🔽 Sell below 4,165
⸻
✅ Summary
Gold remains bullish overall, but a short-term retracement is unfolding as price loses steam near 4,206–4,218 resistance.
Look for a dip into 4,174–4,179 (Golden Zone) for new buying opportunities,
or a confirmed break below 4,165 for intraday correction.
Patience and precision are key ahead of the U.S. CPI volatility window.
⸻
— ElDoradoFx PREMIUM 2.0 Team 🚀

GOLD Will Keep Growing!
HI,Traders !
#GOLD is trading in an
Uptrend and the price
Made a bullish breakout
Of the key horizontal
Level of 4143.76$ and the
Breakout is confirmed so
We are bullish biased
And we will be expecting
A further bullish continuation !
Comment and subscribe to help us grow !

GOLD: Pullback risk needs to be guarded against📈At the opening of trading today, gold’s performance aligns perfectly with our judgment yesterday. After breaking through 4100 the previous day, gold has continued its upward trend today. within just one trading day, it has surged toward the extended target range of 4170, peaking at around 4179 before encountering resistance near 4180 and pulling back. If the market breaks above the resistance zone of 4180-4183, attention should then shift to the key 4200 level above. Once gold firmly holds above 4200, it cannot be ruled out that it will accelerate its advance toward the 4280-4300 area.
📝However, we can see that today’s price is close to the upper edge of the upward channel—a zone that usually faces significant resistance. Today’s price action of surging higher and then pulling back also reflects, to a certain extent, the suppressing effect of the upper edge of the upward channel on the price, with short-term upward momentum weakening somewhat.
💡In the short term, due to overbought conditions on the technical side and pressure from profit-taking, London Gold may undergo a certain degree of correction. Nevertheless, the medium-to-long-term upward trend remains intact. Investors need to pay close attention to the speeches by Federal Reserve Governor Bowman and Fed Chair Powell tonight; their remarks could alter market expectations for interest rate cuts, which in turn may trigger sharp short-term fluctuations in gold prices.
💎Buy 4120 - 4125
TP 4150 - 4160 - 4170
SL 4100
Daily-updated accurate signals are at your disposal. If you run into any problems while trading, these signals serve as a reliable reference—don’t hesitate to use them! I truly hope they bring you significant assistance
