XAUUSD 15M ProjectionXAUUSD 15M Projection
Trend will change from FED meeting.
retailer are holding there gold.
once selling will start nobody can sell there gold and drop like blood bath.
Thanks if you like content, follow me.
Xauusdidea

ANFIBO | XAUUSD - next ATH ??? [09.23.2025]Sorry guys, I'm very busy today so I can't share my views in detail. I will share my trading plan first, then update the details later ;)
Here's my OANDA:XAUUSD plan today:
>>> BUY ZONES:
ENTRY: 3715 - 3720
SL: 3710
TP: 3740 - 3760 - 3770 - 3800
>>> SELL ZONES:
ENTRY: 3800 - 3795
SL: 3805
TP: 3760 - 3730
GOODLUCK GUYS!!!

XAU/USD Intraday Plan | Support & Resistance to WatchGold continues its strong rally, now trading around $3,755 after breaking out of the ascending channel. To sustain momentum, we need to see a confirmed hold above $3,753, which would open the way toward higher resistance levels.
Failure to confirm this breakout could trigger a temporary pullback into lower support zones, with a potential retest of the 50MA if bears take short-term control. The higher price extends, the greater the risk of sharp swings and volatility spikes.
📌 Key Levels to Watch
Resistance:
$3,768
$3,782
Support:
$3,753
$3,728
$3,712 (MA50 retest zone)
🔎 Fundamental Focus – Tue, Sep 23
Key drivers today: US PMIs, Trump remarks + Richmond Index, and the main event — Powell speech.
Gold’s rally is extended, so expect headline-driven swings and possible volatility spikes around these releases.

23/9/68 : XAUUSD ( Europe / London Session )Using it from Europe Session until 7.00PM , I'll new analysis and update at 8.00PM
Resistance
3767-3772
3757-3762
3751
Support
3740
3729-3735
3719-3724

Elliott Wave Analysis XAUUSD – September 23, 2025
Momentum
• D1: Momentum is in an uptrend, currently on the 3rd bullish candle of the cycle. This suggests we may see at least 2 more bullish daily candles from now.
• H4: Momentum has turned bearish, indicating the possibility of a corrective decline within today’s H4 structure.
• H1: Momentum has already turned bearish and is approaching oversold territory. This shows the current decline is weakening, and a short-term rebound is likely. However, if momentum turns back up and enters the overbought zone but fails to break the previous high, another bearish leg may follow.
________________________________________
Wave Structure
• D1: After completing wave 4 (yellow), price broke the previous high, confirming the continuation of the uptrend. Wave 5 (yellow) targets are projected at 3789.019 and 3887.117.
• H4: Wave 3 (yellow) has completed, followed by a corrective structure in a flat WXY pattern. Currently, price is rising steeply, suggesting wave 5 (yellow) is underway. With H4 momentum turning bearish, this pullback could correspond to wave 4 within the ongoing wave 5 (yellow).
• H1: Wave 3 (black) has formed with a complete 5-wave sequence (blue). Price is now in wave 4 (black), which could develop as a Zigzag, Flat, or Triangle correction.
Wave 4 (black) target zones:
1. 3729.447
2. 3709.732
3. 3696.422
Once H4 momentum turns bullish from the oversold region, the nearest level among these zones is the most likely end of wave 4.
________________________________________
Trading Plan
Buy limit strategy at support zones:
• Buy Zone 1: 3730 – 3727
o SL: 3719
o TP: 3760
• Buy Zone 2: 3710 – 3707
o SL: 3696
o TP: 3729
If price extends lower, additional buy opportunities can be considered around 3696 or deeper levels marked on the chart.
________________________________________
👉 The primary trend remains bullish, with wave 5 (yellow) in progress. The plan is to wait for wave 4 (black) to complete and then enter Buy positions in alignment with the larger uptrend.

Gold breaks through 3710
Since the Fed’s interest rate decision was announced, gold’s second attempt to break above the 3700 mark fell short, leading to a sharp subsequent decline. The market then began to question the uptrend and fear a deep correction. Last Friday, market sentiment was almost unanimously bearish on a pullback, with the view that after rebounding to 3670, gold would drop a second time and break below the 3630 level. However, I clearly stated in my article last week that we should use the area below 3620 as the defensive level and continue going long at 3650. Sure enough, gold surged to above 3680 in late trading on Friday.
Currently, gold has broken through the critical resistance level of 3710 and continues to move higher. We can seek opportunities to go long at lower prices
In our weekend analysis, we predicted that gold would continue its upward movement in the new week, with 3710 as the resistance level. As it turns out, gold indeed broke through 3710 today and kept moving higher.
Buy 3680 - 3690
TP 3700 - 3710 - 3720
Daily-updated accurate signals are at your disposal. If you run into any problems while trading, these signals serve as a reliable reference—don’t hesitate to use them! I truly hope they bring you significant assistance
XAUUSD Analysis todayHello traders, this is a complete multiple timeframe analysis of this pair. We see could find significant trading opportunities as per analysis upon price action confirmation we may take this trade. Smash the like button if you find value in this analysis and drop a comment if you have any questions or let me know which pair to cover in my next analysis.

Gold Trade Set Up Sep 22 2025www.tradingview.com
Price broke PDH and i created a new ATH so i am overall bullish. It has tested a 1h demand and is respecting it so i will be looking for internal bullish BOS with a retest to target previous highs

Gold Surges on Low Rates & Tensions: Is a New Record Coming?Hello, traders!
Gold started the new week on an impressive note, hitting $3,685 in early Monday trading. The main drivers are the market's continued reaction to the Fed's rate shock and escalating geopolitical events. So, how far will this rally go?
Fundamental Analysis: Why Is Gold Still Soaring?
Although the Fed cut interest rates by 0.25%—the first time in 2025—Chair Jerome Powell maintained a cautious stance, calling it a "risk management cut." This message initially worried the market, but in the long run, lower interest rates are a strong supporting factor for gold.
Lower Rates: They reduce the opportunity cost of holding gold, a non-yielding asset.
Geopolitical Tensions: Conflicts in Ukraine and the Middle East are escalating, boosting safe-haven demand. Ukrainian President Zelensky reported that Russia carried out a major drone and missile attack, reaffirming gold's role as a protective asset against risk.
Technical Analysis: Breaking Resistance, The Uptrend Continues
Gold had a powerful rally at the start of the week, successfully breaking the key resistance zone at $370x. The price is currently hovering around $3720 with a slight correction, but the uptrend remains intact.
Outlook: With the strong upward momentum, short-selling (sell) with a tight stop-loss is extremely risky. We will continue to prioritize long positions (buy) as long as gold holds above the $370x level.
Suggested Trading Strategy (Strict Risk Management):
BUY SCALP
Zone: $3413 - $3711
SL: $3407
TP: $3716 - $3721 - $3726 - $3731 - $3741
BUY ZONE
Zone: $3700 - $3798
SL: $3790
TP: $3708 - $3718 - $3728 - $3738 - $3758
SELL ZONE
Zone: $3734 - $3736
SL: $3744
TP: $3726 - $3716 - $3706 - $3796 - $3779
The market is showing unpredictable volatility. Can gold overcome all barriers and set new records? Share your opinion in the comments below! 👇
#Gold #XAUUSD #Fed #GoldAnalysis #TradingView #FinancialMarkets #TechnicalAnalysis #GoldTrading #USD #Geopolitics

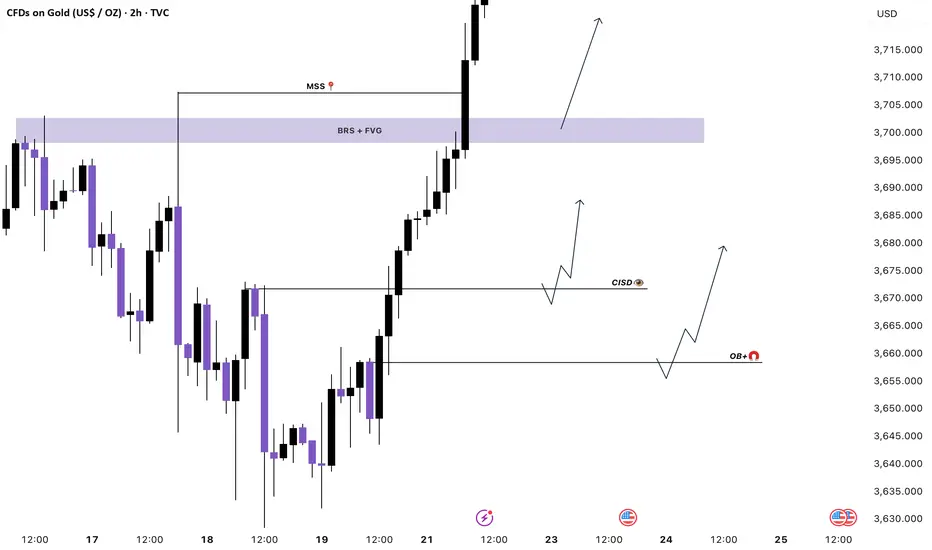
GOLD RETEST OR CONTINUE FLYING ? Gold Basic Buy Zones We Have
BREAKER BLOCK 3702 / 3698
FAIR VALUE GAP ZONE 3712 / 3700
CISD BUY 3671 / 3668
ORDER BLOCK ZONE 3658 / 3648
Follow The Trade , These Are Basic Zones Where Market Go Pullback Buy
Good Luck With Your Trading 🤞
"Bullish Breakout Potential for Gold (XAU/USD) Above Key ?Key Observations:
The price is currently rising and is reaching a key resistance level.
A potential breakout is shown above the resistance at approximately 3,723.
A blue support zone between 3,686 and 3,690 suggests that the price has recently bounced off this level, implying bullish momentum.
The target price shown in the chart (with the green box) is positioned around 3,730, indicating that the trader is expecting further upward movement.
The stop-loss is placed just below the support zone, around 3,672, which suggests that the trader is managing risk.

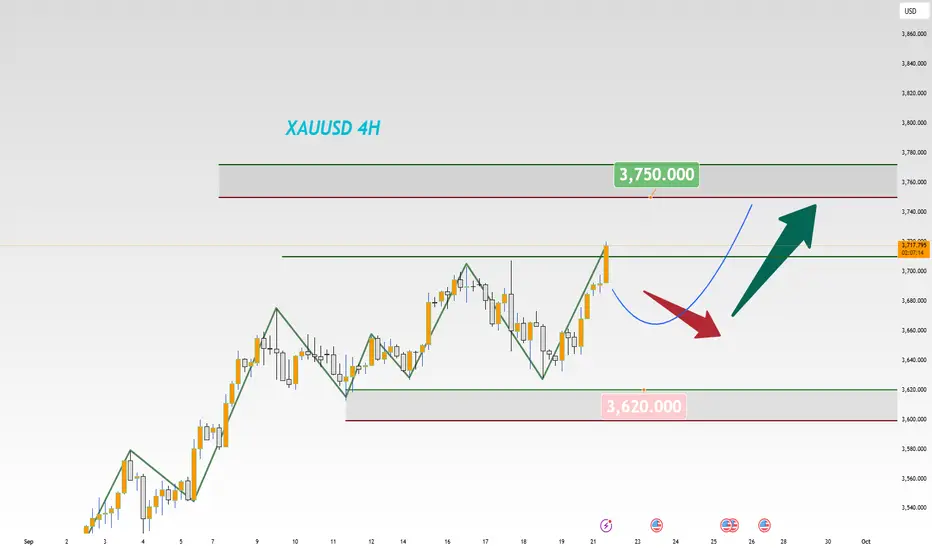
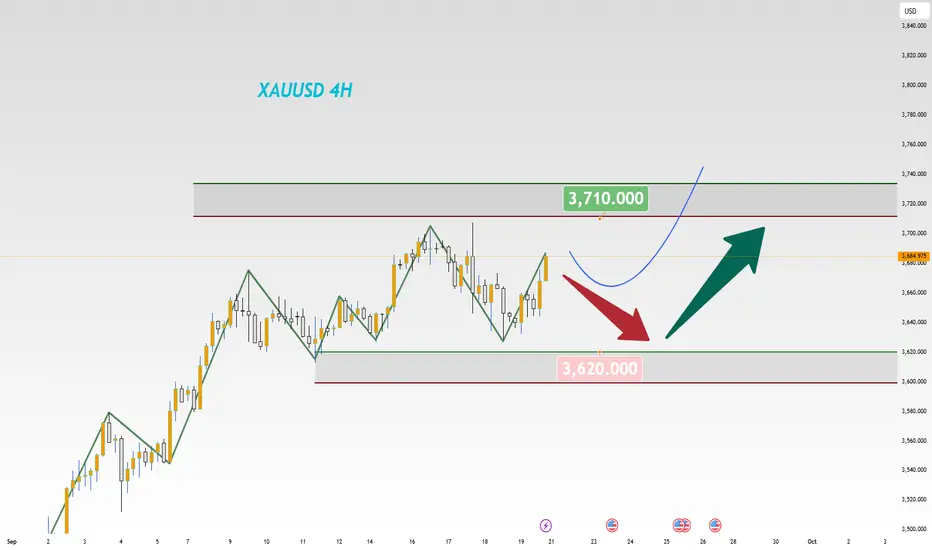
Gold XAUUSD: Overextension, Pullback, and Key Opportunities📊 Watching Gold (XAUUSD), we’ve seen price make an aggressive push higher, leaving the market looking overextended after such a strong run.
🔎 From here, I’m anticipating a retracement back toward equilibrium ⚖️. In the short term, this sets up the possibility of a counter-trend short opportunity.
📈 Longer-term, my focus remains bullish. I’ll be looking for price to retest key support zones and then confirm strength with a bullish break of market structure. That would offer a high-probability continuation entry 🚀.
⚠️ Disclaimer: This analysis is for educational purposes only and not financial advice. Always trade with proper risk management.

ANFIBO | XAUUSD hits new ATH today [09.22.2025]Hi guys! It's me, Anfibo. My latest plan brought good profit with 100 pips Sell entry 3690 - 3700 and 100 pips sell entry 3720. Today is the beginning of the week, and I will think Gold will move in a parallel sideways range as on the chart I drew.
XAUUSD Analysis – Start of the Week
The new week kicks off with gold OANDA:XAUUSD moving sideways after last week’s strong volatility. The market has yet to make a clear breakout, with most major players still observing and waiting for decisive signals from key U.S. economic data due this week. Therefore, the narrow trading range and sideways structure are currently the “playground” best suited for short-term scalp trades.
🔎 Technical Outlook:
> Key Resistance Levels: 3720, 3725, 3745, 3775
> Key Support Levels: 3670, 3660, 3650.
Here's my OANDA:XAUUSD trading plan today:
>>> SELL SCALP:
ENTRY: 3723 - 3728
SL: 3731
TP: 3700 - 3670
>>> BUY SCALP:
ENTRY: around 3670
SL: 3665
TP: 3720 - 3730 - 3745
The current gold market is better suited for scalping strategies – quick in, quick out around well-defined support and resistance zones.
3720 – 3730 remains a “golden zone” for short-term selling opportunities, while 3660 – 3650 serves as the key support block to keep an eye on.
Only if gold clearly breaks above 3775 or drops below 3650 should we consider shifting to a medium-term trend-following strategy.
Well, HAVE A BEAUTIFUL DAY! :)

GOLD Breakout Done , Long Setup Valid To Get 200 Pips !Here is My 30 Mins Gold Chart , and here is my opinion , we finally above 3700.00 With 4H Candle ! and we have a 2H Candle closure above it And Perfect Breakout and this give us a very good confirmation , so we have a good confirmation now to can buy after the price go back to retest the broken area 3700.00 , and we can targeting 100 to 200 pips . if we have a daily closure below this area this mean this idea will not be valid anymore .
Reasons To Enter :
1- Perfect Touch For The Area .
2- Clear Bullish Price Action .
3- Bigger T.F Giving Good Bullish P.A .
4- The Price Take The Last High .
5- Perfect 30 Mins Closure .

Fed Dovish Tone & Geopolitical Tensions Fuel Gold’s Rally🚀 XAUUSD – Daily Trading Plan: | MMFLOW TRADING
📊 Market Context
Gold continues to gain strong support from the Fed’s dovish signals and escalating geopolitical tensions. Meanwhile, the USD is extending its recovery from multi-year lows, which could temporarily limit commodity gains. Positive risk sentiment across financial markets might act as a short-term headwind for XAU/USD ahead of upcoming Fed speeches. However, the long-term bullish trend has returned, and gold looks poised to challenge new all-time highs in the near term.
🔎 Technical Analysis (H1/H4)
Price has broken the descending trendline, confirming that the uptrend is back in play.
Short-term support: 3686–3684, holding above this level keeps the bullish structure intact.
Next support: 3670–3668, aligned with CP and liquidity zones on the chart.
Key resistance: 3720–3722, a critical reaction area for potential profit-taking or liquidity sweeps.
🔑 Key Levels
Resistance: 3707 ➡️ 3720
Support: 3685 ➡️ 3669 ➡️ 3658
📈 Scenarios & Trading Plan
BUY ZONE 1: 3686–3684
SL: 3680
TP: 3690 ➡️ 3695 ➡️ 3700 ➡️ 3705 ➡️ 3710 ➡️ 3720 ➡️ ???
BUY ZONE 2: 3670–3668
SL: 3664
TP: 3675 ➡️ 3680 ➡️ 3690 ➡️ 3700 ➡️ ???
SELL ZONE (Watch for Liquidity Trap): 3720–3722
SL: 3726
TP: 3715 ➡️ 3710 ➡️ 3705 ➡️ 3700 ➡️ ???
⚠️ Risk Management Notes
Be cautious of liquidity sweeps around 3720–3722 — price could fake a breakout before reversing lower.
Enter longs only after price action confirmation at support zones; avoid chasing price mid-range.
Adjust position sizing carefully, considering potential volatility from Fed speeches and geopolitical headlines.
Summary
Gold’s long-term uptrend is back, supported by dovish Fed signals and rising global tensions. The strategy prioritizes buying dips at 3686–3684 and 3670–3668 aiming for 3705–3720, while short-term selling at 3720–3722 remains valid if rejection signals appear.
For more timely updates and refined setups, consider following the MMFLOW Trading profile on TradingView to stay aligned with evolving market conditions.

Elliott Wave Analysis XAUUSD – September 21, 2025
Momentum
• D1: Momentum is still declining → suggesting that early next week price may either experience a downward move or continue to range sideways.
• H4: Momentum is in the overbought zone → likely to see a corrective move on Monday.
• H1: Momentum is also in the overbought zone → during the Asian session on Monday, a short-term corrective decline is highly probable.
Wave Structure
• D1:
o Scenario 1: Wave v (black) has already completed (refer to H4). This means the market is now in a larger corrective phase, and price is unlikely to break above 3709, the high set last week.
o Scenario 2: Wave 4 (black) of wave v has completed, and Friday’s rally was wave 5 (black) of wave v. In this case, early next week we could see a breakout above 3709 with a daily close higher.
• H4: Since D1 and H4 momentum still support a corrective move on Monday, I will keep the current wave labeling unchanged. Only if price breaks strongly above 3709 will I update the labeling to Scenario 2.
• H1: On D1, the two scenarios are contradictory:
o One scenario suggests a decline.
o The other suggests a new high.
Therefore, the best approach for now is to wait for more confirmation. On H1, the labeling from last Friday (the bearish scenario) has not yet been invalidated and is still supported by both D1 and H4 momentum, so I will continue to monitor this count.
Trading Plan
During complex corrective phases, when wave structures are not yet clear, I do not recommend trading solely based on Elliott Wave. For now, the prudent approach is to continue observing until more data becomes available.
If trading is necessary, it’s better to focus on short-term scalps rather than larger swing positions.

Gold Price Outlook – Trade Setup📊 Technical Structure
Gold (XAU/USD) is trading near $3,693, bouncing from the support zone at $3,688–$3,685. The chart highlights a bullish continuation setup, with price action aiming towards the resistance zone $3,703–$3,707. The strong rebound from support underlines sustained buyer interest, while momentum remains positive above $3,685.
🎯 Trade Setup
Entry: $3,688 – $3,685 (near support rebound)
Stop Loss: $3,684 (below support)
Take Profit: $3,703 / $3,707 (resistance zone)
Risk/Reward: ~1 : 4.98
🗝️ Key Technical Levels
Resistance Zone: $3,703 – $3,707
Support Zone: $3,688 – $3,685
Major Resistance Above: $3,716 all-time high
Key Support Below: $3,672
🌐 Macro Background
Gold remains supported after the Fed’s recent 25 bps rate cut, its first of 2025, which reflects rising concerns about labour market softness. While Fed Chair Powell stressed a cautious “meeting-by-meeting” approach to further easing, markets still expect additional cuts this year, reducing the opportunity cost of holding non-yielding assets like gold. Meanwhile, geopolitical tensions—ranging from Russia’s intensified military actions in Ukraine to persistent conflicts in the Middle East—continue to bolster gold’s safe-haven appeal. However, traders remain attentive to upcoming Fedspeak for fresh signals on policy direction, which could add volatility.
📌 Trade Summary
The technical setup favours a long entry around $3,685–$3,688, targeting the $3,703–$3,707 resistance area. The bias stays bullish above $3,685, but a break below could signal a deeper retracement towards $3,672.
⚠️ Disclaimer
This analysis is for reference only and does not constitute trading advice. Trading involves significant risk, and proper risk management is essential.

9/ 22: Trade Within 3718–3668 Range, Watch Support Near 3666Good morning everyone!
Following last week’s rate decision, gold retested support around 3630 and confirmed the level before reclaiming 3658 resistance. This week’s opening saw prices rally above 3690, approaching the 3700 psychological level.
⚠️ Key Levels to Watch:
If price holds above 3666 support, bulls may attempt another test of 3700, with potential to extend into the 3706–3712/3721 resistance zone. Long positions should manage risk carefully here and avoid chasing at highs.
If price breaks below 3666, monitor the 2H chart for possible signs of trend reversal.
📌 Trading Outlook:
Focus on the 3718–3668 range for intraday opportunities.
Near or above 3700, consider selling opportunities.
On a pullback below 3670, look for buying setups.

Gold Forecast for Next WeekGold prices are currently hovering around the 3684 level and have generally been trading within a high-range consolidation zone. Focus on the resistance zone between 3700 and 3710.A breakout above this level is expected to open up room for a new round of upward movement.
Next week, attention should be paid to the following scenario: if gold prices retrace to around 3660 and stabilize there, and a bottoming pattern forms on smaller timeframes, consider going long with a light position. Set TP 3710 and 3720, with a SL 3650.Currently, gold prices are in a phase of bull-bear rivalry, and the 3680 area is crucial as a central price level. From a personal perspective, short-term operations should focus on buying low and selling high within the 3630 – 3700 range. Medium and long-term investors may wait for a clear directional signal before making positioning decisions.
Daily-updated accurate signals are at your disposal. If you run into any problems while trading, these signals serve as a reliable reference—don’t hesitate to use them! I truly hope they bring you significant assistance
GOLD INTRESTED NEXT WEEK IN BULLISH OR BEARISH ? Obviously Bullish 📌
Gold Buy Zones
OB+ 3622 Buying Area To Hold For Much Profitsss
Targets 100 Pips
Targets 500 Pips
Good Luck With Your Trading 🤞

Gold has returned to its upward trendCurrently, the bulls in the gold market have the upper hand. The recent short - term pullback in gold prices is merely an adjustment and does not signal a real trend reversal. After gold broke through the short - term downward trend line on the chart, it rebounded upwards again. As a result, the 3660 level has now transformed into a support level. Any retracement of gold to above 3660 presents an opportunity to go long on dips.
Given that the gold bulls have managed to reverse the situation after multiple downward probes and the price has ultimately continued to rise, it indicates that the strength of the gold bulls is more dominant. Gold has returned to its upward trend, and the short - term adjustment may have ended. Therefore, on any retracement, it is still an opportunity to go long along the trend.

Gold Forecast: Liquidity Zones Mapped | Bullish or Bearish ReverGoldRush_Traders institutional forecast.
Price closed at 3684.975, compressing under ATH (3707).
Stacked supply zones remain valid between 3707 and 3686 — each serving a different purpose: sweep trap, blow-off top risk, and rejection base.
🔺**Bullish Path:**
• Hold 3665–3672 or sweep 3638
• Break above 3695 → 3707
• Clean ATH break = 3720–3732 possible
🔻 **Bearish Path:**
• Fail at 3686–3700 zone
• Drop to 3665 → 3638
• Break of 3628 = opens flush to 3605 or 3582
⚠️ Zones are stacked with no gaps — each has distinct algorithmic purpose.
This is a **provisional forecast** pending any weekend news shifts.
🔱 Liquidity-based | ICT/SMC inspired

Weekly Market Review For GoldGold has recently been in a high-level consolidation phase. After a consecutive pullback on the daily chart, it turned bullish on Friday, indicating significant support at the lower end. The current key pivot levels lie at the resistance level around 3700 and the support level near 3620; the wide trading range has increased operational difficulty, requiring patience to wait for opportunities.
Technically, the 4-hour chart has broken above the short-term downtrend line, with the 3660 level shifting from resistance to a key support. The short-term trend leans bullish, so strategically, one can look to enter long positions within the 3650–3660 range when opportunities arise.
In the medium to long term, while the weekly chart deviates from the moving average and needs time for consolidation, the underlying logic of the fundamentals remains solid. Although the market has priced in the Fed’s first interest rate cut, the probability of further rate cuts in October and December remains high. The subsequent expectation-driven rally will continue to provide support for gold prices. With the core of the long-term uptrend support gradually moving higher, there are insufficient conditions for a sharp decline, and the overall trend will remain in a consolidative upward pattern.
