Brief Review Yesterday, gold rallied before pulling back, fluctuating after hitting a new all-time high, as the market turned cautious ahead of the Fed policy decision. For the day, the probability of range-bound consolidation or a technical correction is high; focus on the support level of 3650-3635 and resistance level at 3710,with the short-term overbought pattern needing to be repaired.
Key attention should be paid to the interpretation of the Fed's dot plot, Powell's speech and the trend of the U.S. Dollar Index. Powell described the 25% rate cut as a "risk-management cut," aimed at addressing downside risks in the labor market. He emphasized that future policies will be "highly data-dependent" and rate cuts will be gradual and cautious.
Employment and inflation data are critical: Weak data will strengthen rate-cut expectations, boosting gold; resurgent inflation will dampen such expectations, weighing on gold.
Daily-updated accurate signals are at your disposal. If you run into any problems while trading, these signals serve as a reliable reference—don’t hesitate to use them! I truly hope they bring you significant assistance
Xauusdidea

GOLD Support Below!
HI,Traders !
#GOLD is trading in an
Uptrend and is
Now making a local bearish
Correction to retest the
Horizontal support below
Around 3658.62 from where
We will be expecting a
Further bullish move up !
Comment and subscribe to help us grow !

Don’t blindly shortFrom the 4-hour chart analysis, the support level remains solid. Today if prices pull back, stick to this level for bullish trades.
As we mentioned earlier, it is advisable not to blindly follow short positions; wait for the Fed to confirm the interest rate cut.
Daily-updated accurate signals are at your disposal. If you run into any problems while trading, these signals serve as a reliable reference—don’t hesitate to use them! I truly hope they bring you significant assistance

FOMC GOLD UPDATE !Gold Structure Buying In H1
Buy From FVG
Buy From Order Block
Buy From Breaker Block
Buy From MSS FVG
Follow Us For More Trades

XAUUSD Analysis todayHello traders, this is a complete multiple timeframe analysis of this pair. We see could find significant trading opportunities as per analysis upon price action confirmation we may take this trade. Smash the like button if you find value in this analysis and drop a comment if you have any questions or let me know which pair to cover in my next analysis.

ANFIBO | XAUUSD on 09.17.2025 and is this a major breakthrough?Here's Anfibo. With my yesterday's plan, our sell OANDA:XAUUSD order reached more than 200 pips, the buy order was 30 pips short of matching the entry and missed 150 pips short. But that's okay, I have a new plan today for everyone to follow:
💚 SUPPORT ZONES: 3676 - 3660
❤️ RESISTANCE ZONES: 3694 - 3700 - 3705 - 3719 - 3745
✅ BUY SCALP: 3675 - 3677, SL 3674, TP 3694 - 3700 - 3719
❌ SELL SCALP: 3719 - 3721, SL 3723, TP 3700 - 3675 - 3660
- - - - - - - - - - - - -
✅ SWING BUY: 3550 - 3560, SL 3540, TP 3625 - 3675 - 3700 - OPEN
❌ SWING SELL: 3790 - 3801, SL 2820, TP 3700 - 3570 - 3450 - OPEN
Hope is right lol! xoxo

17/9/68 : XAUUSD ( US Session )Using it from US Session until 11.00AM , I'll new analysis and update at 12.00PM
Resistance
3697-3703
3687-3692
3677-3682
3671
Support
3661
3651-3656
3640-3646
3630-3635

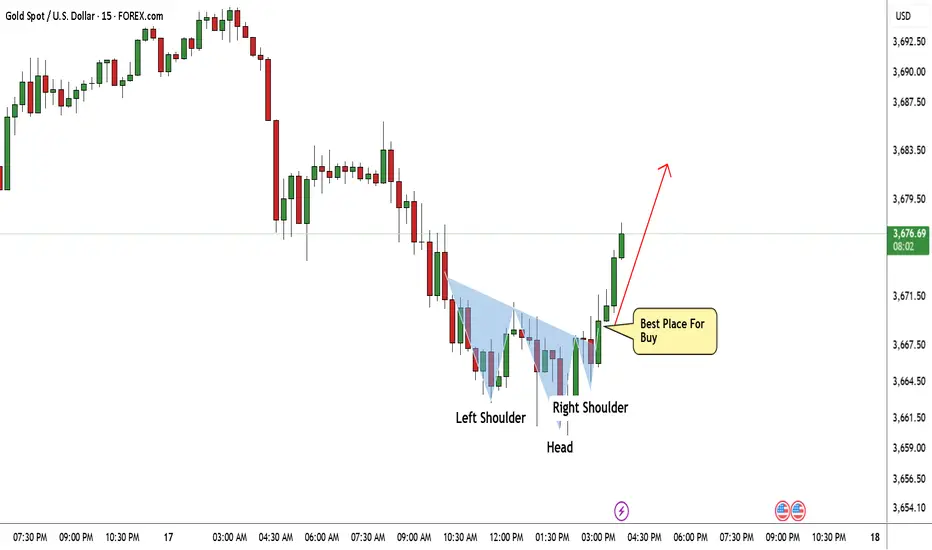
Gold Made A Clear Reversal Pattern , Long Setup To Get 200 PipsHere is my 15 Mins Chart On GOLD , The price creating a very clear reversal pattern ( Reversal head and shoulders pattern ) and the price made a very good bullish price action now and the price above my neckline. so we can enter a buy trade After the price go back to retest my broken neckline . For this trade we can be targeting from 100 : 150 pips with a decent stop loss.
Reasons To Enter :
1- Perfect Touch For The Area .
2- Clear Bullish Price Action .
3- Bigger T.F Giving Good Bullish P.A .
4- The Price Take The Last High .
5- Perfect 15 Mins Closure .
6- Reversal Pattern .
17/9/68 : XAUUSD ( Europe / London Session )Using it from Europe Session until 7.00PM , I'll new analysis and update at 8.00PM
Resistance
3703-3708
3691-3697
3686
Support
3676
3665-3670
3654-3660

Elliott Wave Analysis XAUUSD – September 17, 2025
Momentum
• D1 timeframe: Momentum is currently rising. As of today, the upward move has lasted for 3–4 daily candles. Therefore, in the next 1–2 days, momentum is likely to enter the overbought zone.
• H4 timeframe: Momentum is in the oversold area and starting to reverse. Once confirmed, we can expect at least 4–5 bullish H4 candles.
• H1 timeframe: Momentum is already in the oversold zone and has turned upward, suggesting an immediate short-term rally.
Wave Structure
• D1 timeframe: Price is moving within black wave v. Since black wave iii was extended, black wave v is likely to be approximately equal in length to black wave i.
• H4 timeframe: Inside black wave v, we expect a 5-wave green structure to form. Currently, green wave 1 seems to have completed, and price is correcting within green wave 2.
• H1 timeframe: Within green wave 1, a 5-wave black structure has been completed. Price is now developing a corrective black ABC pattern.
Target zones for black wave C:
• Target 1: 3675
• Target 2: 3657
Note: Wave 2 usually retraces to the 0.618 Fibonacci level of wave 1, which coincides with the 3657 zone. This is the key level to consider for a buy setup.
Trading Plan
• Buy Zone: 3658 – 3655
• Stop Loss: 3645
• Take Profit (TP1): 3677

Fed Cuts Could Ignite a Breakout Above $3,700?📊 Technical Structure
Gold (XAU/USD) is trading near $3,682 after bouncing from the support zone at $3,678 – $3,679. The chart highlights a bullish setup, with potential continuation towards the resistance zone $3,691 – $3,695. The short-term trendline break also supports renewed upside momentum, while buyers remain in control above the support base.
🎯 Trade Setup
Entry: $3,678 – $3,679 (near support zone)
Stop Loss: $3,677 (below support)
Take Profit: $3,691 / $3,695 (resistance zone)
Risk/Reward: ~1 : 7.17
🗝️ Key Technical Levels
Resistance Zone: $3,691 – $3,695
Support Zone: $3,678 – $3,679
Major Resistance Above: $3,700 psychological barrier
Key Support Below: $3,674
🌐 Macro Background
Gold is firming up as markets await the FOMC decision, with traders widely expecting a 25 bps Fed rate cut—the first in 2025. The prospect of further cuts later this year supports gold as a non-yielding asset. However, easing US-China trade tensions and improved risk sentiment could limit haven flows in the short run.
📌 Trade Summary
The technical setup favours a long entry near $3,679, targeting the $3,691–$3,695 resistance area. The bias remains bullish while gold holds above $3,678 support. Watch for volatility around the Fed decision later today.
⚠️ Disclaimer
This analysis is for reference only and does not constitute trading advice. Trading involves significant risk, and proper risk management is essential.

GOLD FALL TIME Lets Goo , Gold Selling Now
Reason SMT & BEARISH FVG
And Buy Setup Gold From OB / DEMAND ZONE
LETS GOO , HIGH PROBABILITY SETUP
FOLLOW US FOR MORE TRADES

9/17: Ahead of Rate Decision, Trade Within 3668–3706 RangeGood morning, everyone!
Yesterday, after breaking above 3682, the price reached the 3692–3702 area before pulling back. Those of you who carefully followed the strategy should have caught this move.
At the moment, the price is near support. Ahead of the interest rate decision, the main support lies around 3670–3658, while resistance is in the 3700–3706/3712 area. Trading can be focused within the 3706–3668 range.
The key today is the interest rate decision. If the price falls before the news, then buying opportunities may arise during the announcement. If the price rises beforehand, look for selling opportunities after the news.
I’ve marked today’s intraday trading range on the chart for reference. You can plan trades based on the price area. If anything is unclear, feel free to leave me a message.

XAUUSD Analysis todayHello traders, this is a complete multiple timeframe analysis of this pair. We see could find significant trading opportunities as per analysis upon price action confirmation we may take this trade. Smash the like button if you find value in this analysis and drop a comment if you have any questions or let me know which pair to cover in my next analysis.

16/9/68 : XAUUSD ( US Session )Using it from US Session until 11.00AM , I'll new analysis and update at 12.00PM
Resistance
3719-3724
3707-3713
3702
Support
3691
3681-3686
3671-3676

Gold Trade Set Up Sep 16 2025www.tradingview.com
Gold has broke PDH and has came in a prime price of 3700 where a lot of traders will try to short so if we see price close under this current key zone with a retest to a 5m OB/supply i will look for sells down to the next key zone or 1h FVG

“Gold Shines Bright | Bullish Momentum Targeting $3,700🔎 Technical Analysis – XAU/USD (1H Chart)
Trend: Strong bullish trend confirmed, with price making higher highs and higher lows.
Buy Zone: Around 3,590 – 3,600 USD, where buyers stepped in aggressively.
Short-Term Target 🎯: 3,650 – 3,700 USD (already highlighted on chart).
Key Support Levels:
3,561 USD (near-term support)
3,490 USD (major support, bullish structure invalidation if broken)
📌 Outlook: As long as price holds above the buy zone, momentum favors bulls with potential continuation toward 3,700+ USD.
🌍 Fundamental Drivers for Gold Bullishness ✨
Federal Reserve Rate Cuts Expectations 🏦⬇️ – If the Fed signals easing or holds a dovish stance, real yields fall → Gold strengthens.
Weakening US Dollar (DXY) 💵📉 – A softer dollar makes gold more attractive to global investors.
Geopolitical Risks 🌍⚠️ – Rising global tensions increase demand for safe-haven assets like gold.
Central Bank Demand 🏦🔒 – Many central banks are adding gold reserves to hedge against currency risks.
Inflation Hedge 📊🔥 – Gold remains attractive when inflationary pressures stay elevated.

Gold Breaks Records: Is This the Start of a New Super Cycle?Hi traders! Gold (XAU/USD) broke out strong, gaining 1.1% on September 15, 2025, to close at $3,680.80/oz after hitting a historic peak of $3,685.39/oz. Last week, gold climbed 1.6%, supported by a weaker USD (down 0.3% to a one-week low) and falling US government bond yields. The market is almost certain the Fed will cut interest rates by 0.25% on September 17, with some even anticipating a larger 0.5% move (according to the CME FedWatch Tool). Global tensions and potential gold import liberalization in China continue to fuel the rally. Let's analyze and find some trading setups! 💰
Fundamental Analysis: Gold Shines in Uncertainty 🌟
Fed Rate Cuts: US economic data from last week showed the August Consumer Price Index (CPI) rose at its fastest pace in seven months, but recent jobs data pointed to a weakening labor market. This supports the Fed’s move towards a rate cut, a first since December 2024. A lower interest rate environment weakens the US Dollar and makes non-yielding assets like gold more attractive.
Geopolitical Tensions: The upcoming Fed meeting is under unusual political pressure, with leadership disputes and President Donald Trump pushing for greater influence. The US Senate is also considering allowing his economic advisor, Stephen Miran, to join the rate-setting committee to vote on September 17. Gold typically acts as a safe haven during such instability.
China's Demand: Reports from last weekend suggest China may ease gold import/export rules and boost its purchasing activity. Strong official and private demand from a major consumer like China is a key driver for gold's upward momentum.
Technical Analysis: Breaking Records & Finding Opportunities 📉
Gold has decisively broken above the Fibo 2.618 level and established a new all-time high (ATH). Pullbacks have been shallow, typically moving only about $10 before the rally continues. This indicates strong buying pressure, making it difficult for sellers to gain ground. We should look to buy on dips and consider selling only at key resistance levels.
Resistance: $3704, $3714, $3724
Support: $3694, $3686, $3674, $3666
Trading Setups (Use Strict Risk Management):
Buy Scalp:
Zone: $3688 - $3686
SL: $3682
TP: $3691 - $3696 - $3701 - $3706
Buy Zone:
Zone: $3667 - $3665
SL: $3657
TP: $3675 - $3685 - $3695 - $3705 - $3715
Sell Scalp:
Zone: $3704 - $3706
SL: $3710
TP: $3701 - $3696 - $3691 - $3686
Sell Zone:
Zone: $3724 - $3726
SL: $3734
TP: $3716 - $3706 - $3696 - $3686 - $3676
Gold is at an all-time high—be cautious of liquidity traps around the upcoming Fed news! Above $3694, the next target is a new high; below, we could test $3666. Manage your risk tightly ahead of the September 17 volatility! Will you buy the dip or sell the top? Share your strategy below! 👇
#Gold #XAUUSD #Fed #RateCuts #CPI #TradingView #MarketUpdate #Forex #Investing #TechnicalAnalysis #GoldTrading #Finance #Geopolitics #CentralBank

Gold Facing Strong Resistance – Bearish Move Towards Support ?Analysis:
Resistance Zone: Price is struggling to break above the $3,645–$3,650 area, which has acted as a strong resistance multiple times.
Support Levels: Immediate support lies around $3,620 and $3,614, with the major support zone at $3,580.
Price Action: Repeated rejections from resistance indicate weakening bullish momentum. Sellers are gaining control near the resistance zone.
Bearish Outlook: A potential downward move is projected, with price likely to test $3,580 support if resistance continues to hold.
Risk Management: A break and close above $3,650 would invalidate the bearish scenario and could trigger a bullish continuation.
✅ Bias: Bearish below $3,650
🎯 Targets: $3,620 → $3,614 → $3,580
🛑 Invalidation: Above $3,650

Gold XAUUSD: Anticipating a Retracement for Continuation Long📊 Currently watching Gold (XAUUSD), price has been pushing aggressively higher in a strong bullish trend. However, the market is now reaching into areas of thin liquidity, appearing somewhat overextended.
🔎 I’m anticipating a potential retracement toward the 50% equilibrium level of the previous price swing. Within an ongoing uptrend, the Fibonacci 61.8% retracement often acts as a prime entry zone 🏹 for continuation trades.
⚖️ If price pulls back and establishes support, followed by a bullish break of market structure, that would provide a high-probability opportunity. If the setup fails to materialize, then there’s simply no trade — patience is key.
⚠️ Disclaimer: This is educational analysis only and not financial advice. Always manage risk appropriately.

Gold's new round of upward momentum continuesGold ushered in another new round of rallies. In the early, the price slightly touched 3674, but now rebound to around 3687. For the trend, an upward move is highly likely. As we mentioned earlier, the resistance at 3700 remains, and the current upward move is a result of traders' early bets on interest rate cuts. Maybe it’s just a matter of whether the 3700 is broken today or tomorrow. However, it’s not advisable to be too aggressive in trading operations. For the downside, we can temporarily focus on the support at 3660, which is the starting point of the accelerated upward move. We can buy when the price pulls back to this level; if the pullback doesn’t present, it’s better to wait and see for now
Buy 3660 - 3670
TP 3680 - 3690 - 3700
Daily-updated accurate signals are at your disposal. If you run into any problems while trading, these signals serve as a reliable reference—don’t hesitate to use them! I truly hope they bring you significant assistance

16/9/68 : XAUUSD ( Europe / London Session )Using it from Europe Session until 7.00PM , I'll new analysis and update at 8.00PM
Resistance
3705-3710
3695-3700
3690
Support
3679
3668-3673
3657-3663

Elliott Wave Analysis XAUUSD – September 16, 2025
Momentum
• D1: Momentum is currently in an uptrend, suggesting that price may continue to rise for the next 5–6 days.
• H4: Momentum is turning downward, indicating the possibility of a correction today.
• H1: Recently showed a bullish reversal signal, but now there are signs of weakening again. This suggests that the downward move on H1 may not yet be complete.
Wave Structure
• D1: Yesterday’s daily candle created a new high, which indicates that wave iv (black) has likely been completed. The market is now developing in wave v (black).
• H4: Wave iv (black) is likely finished. With H4 momentum turning lower, wave 1 of wave v (black) may already be completed, and the market is now entering a corrective phase.
• H1: Wave v (black) is unfolding into a 5-wave structure (green). Combined with weakening H4 momentum, there are two possible scenarios:
1. This is wave 4 (green), with a maximum correction level around 3662.
2. This is wave 2 of wave v (black – D1), with a potential correction target around 3657.
Since both scenarios point to a similar price zone, we select 3662–3660 as the buy entry zone.
Trading Plan
• Buy Zone: 3662 – 3660
• SL: 3650
• TP: 3698
