Gold Bulls vs Bears! Who Will Win the $XAUUSD Battle?🏆 "The Golden Layer Cake Strategy" - XAU/USD Bullish Swing Plan 🎯
✨ Calling all savvy traders! ✨
Ready to layer into a potential Gold breakout? This systematic approach is designed to capitalize on bullish momentum while managing risk through strategic entry layers.
Here’s the detailed blueprint: 📜
🔑 Key Details:
Asset: XAU/USD (Gold)
Bias: Bullish
Style: Swing Trading / Position Building
Strategy: Multi-Layer Limit Order Entry
⚡ Entry Strategy (The Layering Method):
To optimize your average entry price, consider using multiple BUY LIMIT orders at key support levels:
Layer 1: 3420.00
Layer 2: 3440.00
Layer 3: 3460.00
Layer 4: 3480.00
You can adjust the number of layers and prices based on your personal risk management and market conditions.
🛑 Stop Loss:
A conservative stop loss can be placed below a significant support zone at 3370.00.
Disclaimer: Always adjust your stop loss based on your individual risk tolerance, account size, and trading strategy.
🎯 Take Profit:
We are targeting a strong resistance zone around 3600.00. A more ambitious target sits at 3650.00 for those who wish to trail their stops. Secure profits on the way up!
📊 Market Context & Rationale:
This plan is based on identifying potential value areas on the pullback for a continued bullish move. The layered entry allows us to build a position gracefully without chasing the market.
📊 XAU/USD Real-Time Data Report
🤝 Retail & Institutional Sentiment
Retail Traders
Long (Bullish): 28% 😊
Short (Bearish): 72% 😟
Institutional Traders
Bullish positions increasing, showing confidence in gold as a safe-haven asset. 🏦
😨💸 Fear & Greed Index
Mood: Neutral → leaning Greedy
Markets expect Fed rate cuts, boosting gold demand.
🌍 Fundamental Score
Rating: 7/10 (Positive)
Key Drivers:
Weakening US Dollar from expected Fed cuts 📉
Geopolitical tensions supporting safe-haven demand ⚠️
Ongoing central bank gold buying 🏦
📈 Macro Score
Rating: 6.5/10 (Moderately Bullish)
Factors:
High probability of US rate cut in September (~85%) 📅
Rising bond yields may cap gains 📈
Global economic uncertainty 🌎
🐂🐻 Overall Market Outlook
Bias: Bullish (Long) 🚀
Gold remains in a strong uptrend, supported by fundamentals, macro drivers, and institutional flows.
✨ Summary
Gold is bullish 📈 with strong support from fundamentals and macro conditions. Retail traders lean bearish 😟, but institutions and sentiment favor upward momentum. Any dips are seen as buying opportunities 🤑
⚠️ Risk Warning & Disclaimer:
This is not financial advice. Always do your own research (DYOR).
High-impact news events can cause increased volatility—manage your risk accordingly.
Past performance is not indicative of future results.
Only risk capital you are willing to lose.
Xauusdidea

Gold Price Forecast: XAU/USD Eyes $3,650 Ahead of CPI 📊 Technical Structure
Gold (XAU/USD) may rebound from the support zone $3,627–3,630, and buyers are gradually regaining control. Price action now challenges the resistance zone $3,642–3,647, with a breakout paving the way toward $3,650+.
🎯 Trade Setup (15M Chart)
Entry (Long): $3,630–$3,627
Stop Loss: $3,625
Take Profit: $3,642 / $3,645
🌐 Macro Background
Gold stays supported by Fed rate cut bets, a weaker USD, and geopolitical tensions. US August PPI came in softer, reinforcing rate cut expectations ahead of Thursday’s CPI release (forecast 2.9% headline / 3.1% core). Meanwhile, safe-haven demand is lifted by Poland shooting down Russian drones and Israel’s Doha strikes. While event risk remains, the broader backdrop continues to favour gold upside momentum.
🔑 Key Technical Levels
Resistance: $3,642 / $3,645 / $3,650
Support: $3,630 / $3,627
📌 Trade Summary
Gold maintains bullish traction above $3,630, with scope for a move toward $3,642–$3,645, though traders should stay cautious ahead of US CPI.
⚠️ Disclaimer
This analysis is for reference only and does not constitute trading advice. Trading involves significant risk, and proper risk management is essential.

Elliott Wave Analysis XAUUSD – September 10, 2025🌀
🔹 Momentum
• D1 timeframe: Momentum is showing signs of a bearish reversal → the market may enter a corrective decline, possibly lasting through the end of this week.
• H4 timeframe: Momentum is turning upward → a short-term recovery could appear today, pushing the indicator into the overbought zone.
• H1 timeframe: Momentum is already in the overbought area and turning down → a short-term decline is likely.
________________________________________
🔹 Wave Structure
• D1: Price has reached the projected target of wave iii (black). With D1 momentum reversing downward, wave iv (black) may be forming. Since wave ii (black) was relatively long, there is a possibility that wave iv (black) could unfold more quickly.
• H4: Yesterday’s decline may suggest that wave v (purple) has temporarily completed. If this scenario plays out, price could move into a corrective phase toward the wave iv target area. The correction may develop as a Zigzag, Flat, or Triangle.
• H1: Price is consolidating within the liquidity zone 3657 – 3631. With H4 momentum hinting at correction, one possible scenario is sideways movement here to complete wave B, followed by a decline into wave C.
o If price breaks and closes below 3631 → the liquidity zone at 3595 may act as the next support.
o Potential targets for wave C:
3595 (aligned with 23.8% Fibonacci retracement).
Or 3556 – 3528 (aligned with 38.2% Fibonacci retracement).
________________________________________
🔹 Trade Scenarios (for reference only)
• Sell Zone: 3657 – 3659
o SL: 3667
o TP1: 3631
• Buy Zone 1: 3596 – 3594
o SL: 3585
o TP1: 3669
• Buy Zone 2: 3557 – 3555
o SL: 3547
o TP1: 3597
📌 Note: The Sell setup at 3657 should be considered with small position size as it goes against the main trend. If price reaches 3595, this Sell scenario could lose validity.

GOLD READY FOR FALL ! Ready To Fall The Gold !
It’s Enough ATH We Are Going To Drop Soon 3500 / 3400
Gold Respect The Resistance A Strong Resistance Its Now We Are Expecting Gold Bearish Momentum

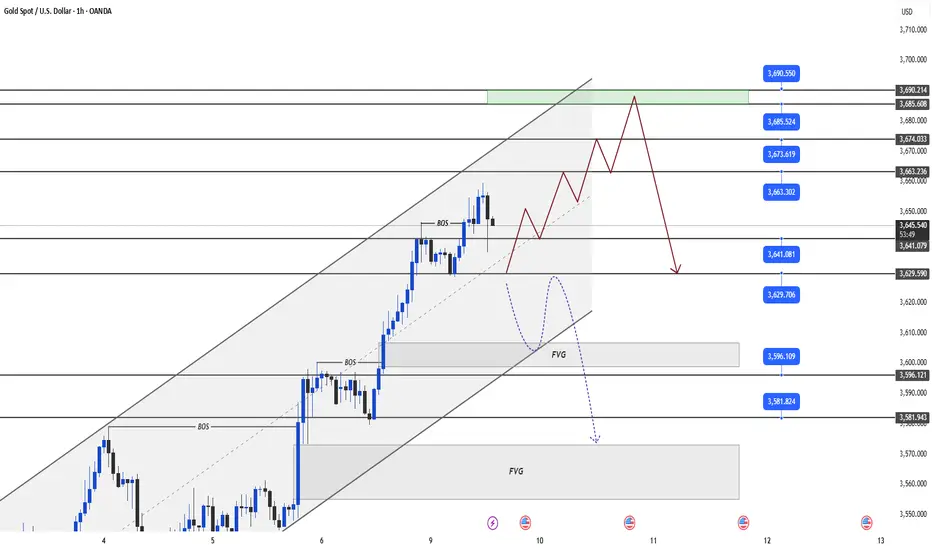
XAUUSD – 1H | OB / POC / Golden Zone Scenarios Price now: 3647
📍 Key Levels:
🟦 1H FVG / Support: 3610 – 3600
🟩 Developing POC Daily: 3565 – 3550
🟨 Golden Daily Zone: 3500 – 3480
Scenario 1 – Shallow Pullback (Most bullish):
If price holds 3610–3600, I’ll look for long setups targeting 3680 – 3700.
Invalidation: clean 1H close below 3600.
Scenario 2 – Deeper Retest:
Break below 3600 brings us toward the 3565–3550 POC Daily zone.
From there, bullish CHoCH/BOS on LTF (3–5m) will be my entry trigger.
Target remains 3640 – 3680.
Scenario 3 – Deep Liquidity Sweep:
If even POC Daily fails, last strong buy zone sits at 3500–3480 Golden Daily.
This level aligns with previous demand and could be the launchpad for a new rally toward 3700+.
Execution: I won’t enter blindly – waiting for confirmation in 3–5m TF.
📊 ProfitaminFX | Gold, BTC & EUR/USD
📚 Daily setups & educational trades

A Healthy Market Breathes. Gold Hasn’t Exhaled Yet.I remain bullish on Gold overall — that’s not in question.
On 24 August, I even shared a complete cross-market outlook arguing that acceleration to the upside could be the next big move. And indeed, we got it.
But here’s the paradox of markets: sometimes, the stronger the rally, the more fragile it becomes.
________________________________________
Why I Warned About a Steep Correction
• Yesterday, I flagged the risk of a sharp pullback. My stop loss was triggered, yes, but my conviction hasn’t changed. If anything, the higher Gold pushes, the more probable and violent the correction could be.
• The daily chart says it all: since the local bottom around 3300, Gold has moved almost vertically higher.
• From 26 August onward, with the sole exception of the 4 September red candle, every single day closed green — and not just small gains, but +1% or more.
This type of move is powerful, but also unsustainable.
________________________________________
Market Psychology at Work
Markets move in cycles of fear and greed, tension and release. A one-sided move — especially a vertical one — compresses tension like a coiled spring. Traders get trapped:
• Late buyers rush in from FOMO, convinced “it will never stop going up.”
• Sellers get squeezed, forced to cover, adding fuel to the fire.
• But eventually, when there’s no one left to buy at higher prices, even a small wave of selling can cascade into a steep correction.
This is why not even Bitcoin, in its glory days, could sustain vertical rises for long. The pattern was always the same: euphoric rise → brutal drop . Gold is no different.
________________________________________
Where We Stand Now
• At the time of writing, Gold trades at 3647, after touching 3660 and marking a new ATH.
• Is this the local top? Hard to say with certainty. But in my book, until we see a strong correction, there is no valid buy trade here.
________________________________________
My Trading Plan
Today, I will look to sell again. Not because I doubt the long-term bullish trend, but because the short-term imbalance is glaring.
A healthy market breathes, and Gold hasn’t exhaled yet.
🚀 Long term: bullish.
⚠️ Short term: vulnerable.
🎯 Until a correction resets the board, my play is on the short side.

Gold Price Analysis (XAU/USD): Key Levels and Market OutlookThe price of Gold (XAU/USD) has shown strong upward momentum in recent sessions, crossing above the $3,600 mark and briefly touching the $3,674 level, which represents a strong bullish push supported by significant trading volume (over 581K at that peak).
Current Market Overview
Current Price: $3,646.74 (as of the latest 4H candle)
Resistance Level: $3,674 (recent swing high)
Support Level: $3,640 (recent pullback low)
RSI Indicator: Around mid-range (60), showing neither overbought nor oversold conditions.
The Zig Zag indicator highlights the recent correction after reaching $3,674, where the price retraced slightly to $3,640 before consolidating. The market now trades sideways between these two levels, indicating a short-term indecision.
1. Resistance Zone:
Gold needs to break and sustain above $3,674 to confirm the continuation of the bullish trend. If this happens, the next target could be around $3,700 – $3,750.
2. Support Zone:
On the downside, if the price fails to hold the $3,640 level, a deeper correction towards $3,600 – $3,550 cannot be ruled out.
3. Momentum Indicators:
The RSI is currently neutral, suggesting room for both upside and downside moves. Traders should watch for RSI crossing above 70 (bullish continuation) or dropping below 50 (bearish pressure).
Trading Strategy
Bullish Bias: If Gold holds above $3,640 and breaks $3,674, traders may look for long positions targeting $3,700 and above.
Bearish Bias: A break below $3,640 could trigger short positions, with downside targets near $3,600 and $3,550.
Conclusion
Gold remains in a bullish structure but faces short-term resistance at $3,674. Traders should watch closely for a breakout or breakdown from this consolidation range to determine the next major move.

Gold Trade Set Up Sep 10 2025OANDA:XAUUSD
www.tradingview.com
Price is currently making LH/LL on the 1h so id want to see how price reacts at the current key level. If it hold and can make internal structure on the 5m i will look for buys back to PDH but if price closes under the key level on the 15m and retest it i will look for sells towards 4h FVG

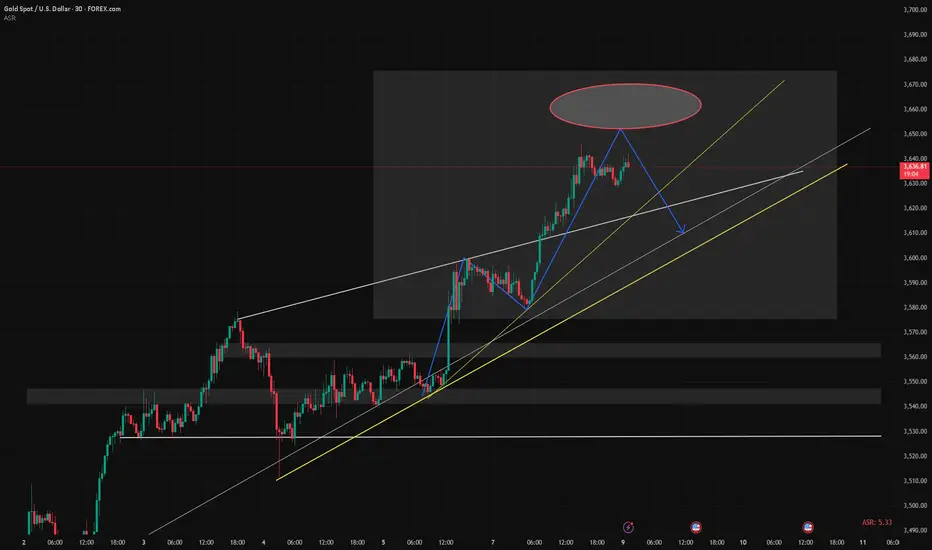
Gold Analysis – Correction Not Yet Over (IMO)Yesterday, after printing a new ATH at 3674, Gold sold off aggressively and overnight reached a low of 3620.
Now the key question: Is Gold done correcting?
👉 My answer: Not yet.
Here’s why:
1. The 550 pip drop from the top is barely scratching the surface compared to the 3500 pip rally in the last two weeks.
2. Yesterday’s daily candle is a bearish pin bar. While this pattern is weaker in strong uptrends, it can still trigger continuation.
3. Structurally, the market looks like it’s forming an ABC correction. The current rebound may be wave B, with wave C expected to target the 3570 zone.
4. Confluence supports act like magnets once corrections begin. The zone I’m watching aligns with the 23% Fibonacci retracement, which fits perfectly with the correction scenario.
📌 Trading Plan:
As long as 3675 holds, I remain bearish in the short term. The best strategy is to sell rallies against the ATH, targeting deeper retracement levels.
10/9/68 : XAUUSD ( Europe / London Session )Using it from Europe Session until 7.00PM , I'll new analysis and update at 8.00PM
Resistance
3664-3669
3654-3659
3649
Support
3638
3628-3633
3617-3622

ANFIBO | I think XAUUSD on 09.09.2025 ???Currently, gold is moving within a clearly defined upward trend channel. Our strategy for today should focus on monitoring key resistance and support zones in order to identify potential entry points for both scalp trades and swing trades. The levels I consider noteworthy are as follows:
>> SELL SCALP: 3650 - 3660, SL 3670, TP 3600
>> BUY SCALP: 3598 - 3603, SL 3595, TP 3680 - 3690
>>> SWING BUY: 3560 - 3570, SL 3550, TP 3680 - 3690 - OPEN
>>> SWING SELL: 3790 - 3801, SL 2820, TP 3680 - 3570 - 3450 - OPEN
Have fun!!!

Gold - Buy or Sell this week??? (08-12/09)With the sustained accumulation over the past five months, gold has experienced a strong breakout from the $3,300 sideways range and reached a new all-time high around $3,600. The upward trend is clearly established. Therefore, we can consider buying and selling at the following price levels:
>>> SELL ZONE: 3684 - 3679
SL: 3689
TP: 3618 - 3596 - 3578 - 3565 - 3515
>>> BUY ZONE: 3560 - 3570
SL: 3550
TP: 3618 - 3678
Have a good day. Good luck buddies! :)

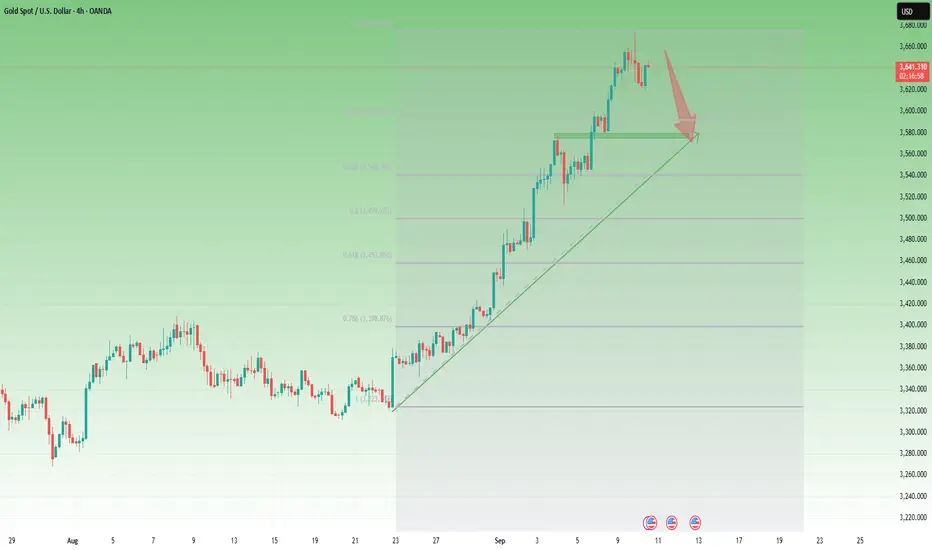
Gold Breaks $3,600/oz: Fed Rate Cut Hype & Trading Setups!Hello traders! Gold (XAU/USD) soared past $3,600/oz for the first time on Monday (08/09/2025), hitting a new all-time high as weak US jobs data cemented expectations for a Fed rate cut next week. With a 38% YTD surge following a 27% rally in 2024, gold’s unstoppable—driven by a weak USD, central bank buying, easing policies, and global uncertainty. Let’s break down today’s (09/09/2025) market and uncover trading setups! 💰
Fundamental Analysis: Why Gold’s Rally Keeps Charging? 🌟
Historic Surge: Weak US jobs data (August growth slowed, unemployment at 4.3%) has markets pricing in an 88% chance of a 0.25% rate cut and 12% for 0.5% in September, per CME FedWatch. Low rates make non-yielding gold shine! 📈
Expert Insight: Peter Grant from Zaner Metals predicts gold could hit $3,700–$3,730/oz short-term, with short pullbacks as buying opportunities. Ongoing labor market weakness and Fed easing into 2026 provide solid support.
Global Drivers: China’s central bank extended its gold-buying streak to 10 months in August. A falling USD and 10-year Treasury yields near a 5-month low boost gold’s allure.
Key Data Ahead: Watch US PPI (10/09) and CPI (11/09) for more Fed policy clues. Geopolitical and tariff tensions further fuel gold’s safe-haven appeal.
Gold’s red-hot—can it conquer new highs?
Technical Analysis: Breakout Mode with Traps—Prioritize BUY! 📉
Gold’s relentless rally smashed through 3600, showing no signs of slowing. Keep an eye on the Fibo 2.618 level at 3685 as a potential pause point. Strong bullish momentum favors BUY setups, but beware of FVG traps from rapid surges. Focus on 3641: a break below could trigger a pullback to 3600, while holding above keeps bulls in charge, targeting 3685.
Key Resistance: 3663 - 3673 - 3685 - 3690
Key Support: 3641 - 3629 - 3596 - 3581
Trading Opportunities:
Sell Scalp: 3673 - 3675
SL: 3679
TP: 3670 - 3665 - 3660 - 3655
Sell Zone: 3684 - 3686
SL: 3694
TP: 3676 - 3666 - 3656 - 3646 - Open
Buy Scalp: 3641 - 3639
SL: 3635
TP: 3644 - 3649 - 3654 - 3659
Buy Zone: 3605 - 3603
SL: 3595
TP: 3613 - 3623 - 3633 - 3643 - Open
Gold’s in breakout territory, but traps are lurking—wait for confirmations at key levels! If supports hold, bulls could charge to 3685. 📊💡
#Gold #XAUUSD #Fed #USJobs #TradingView #MarketUpdate #Forex #Investing #TechnicalAnalysis #GoldTrading #Finance #Crypto #CentralBanks
Gold Trade Set UpOANDA:XAUUSD
www.tradingview.com
price broke structure on the 30m and 15m to, retested the zone and pushing bearish. So i am targeting 4h FVG or lower key zone

Gold Trade Set Up Sep 2025OANDA:XAUUSD
www.tradingview.com
Gold is still making HH/HL on the 1h so i am bullish. i will look for buys when price closes above HH and pulls back into a 5m-15m FVG

Short sellers' exit strategy and outlook for the marketGold has been rising recently and has deviated from technical analysis in the short term. Out of fear of heights and to avoid the potential risks brought about by chasing high prices, I have been trying to short gold at the top recently.
Unfortunately, it is difficult for gold to get an effective pullback in the short term. Even if the account has a certain amount of funds to resist risks, the short orders held in the short term are still facing great pressure. After increasing our short positions near 3620 yesterday, we originally expected gold to at least retreat to 3605-3595, so that we can turn losses into profits in one fell swoop, reverse the temporary losses in our hands, and realize profits completely. However, gold did not give an ideal opportunity in the evening, and even rose to around 3645 at one point, which forced us to try to short gold again by touching the top. However, the pullback last night was limited and failed to effectively fall below 3633, so we can only hold positions again and wait for trading opportunities in the Asian session.
After the opening of the Asian session in the morning, there was only a slight pullback. As the gold price continued to rise, the short-term support moved up. In addition, considering that gold had difficulty falling below 3633 last night, the buying funds below were too strong. In order to better protect the safety of account funds, I had to close all short orders in my hands near 3630 and start creating long orders to execute hedging transactions.
Since we managed the number of trading lots in our account relatively properly and the number of low-level trading lots was small, it did not cause too much loss to my account. But this doesn't mean I have lost confidence in future shorts. As I said before, as long as the market remains stuck in the sentiment of buying expectations and selling facts, gold is bound to fall sharply. Just now I closed my long orders and am ready to short gold again.
The preliminary value of the benchmark change in non-farm employment in the United States in 2025 will be announced tonight. If it falls short of expectations, gold may still fall back. Although there is no good reference point for the weekly and daily lines, the monthly line is suppressed near the 3700 line. As long as it fails to break through effectively, gold will definitely fall. Therefore, in the short term, I am still optimistic about shorting gold, and I am determined to short at 3660-3700.

9/9/68 : XAUUSD ( Europe / London Session )Using it from Europe Session until 7.00PM , I'll new analysis and update at 8.00PM
Resistance
3675-3680
3665-3670
3660
Support
3649
3638-3643
3628-3633

Elliott Wave Analysis XAUUSD – 09/09/2025🌀
————————————-
🔹 Momentum
• D1 timeframe: Momentum is still rising but occurs in the overbought zone → the upside potential is limited.
• H4 timeframe: Momentum is also in the overbought zone and starting to reverse. Although H4 candles are still pushing up, a divergence is forming → signaling weakening bullish strength.
• H1 timeframe: Momentum remains in the overbought zone → no expectation for an extended bullish leg.
————————————-
🔹 Wave Structure
• D1 timeframe:
o Price is in the final stage of wave iii (black) and preparing for wave iv (black).
o By principle, it is better to stay patient and wait for wave iv to complete before looking for Buy entries into wave v (black), rather than trying to catch the top of wave iii.
o Current price is approaching the 2.618 Fibonacci extension of wave i (black).
• H4 timeframe:
o Price is currently within wave v (purple).
o Since it has already broken above wave iii (purple), a reversal could happen anytime.
o Completion of wave v (purple) will also complete wave iii (black).
• H1 timeframe:
o Inside wave v (purple), a full 5-wave structure (green) can be counted.
o The potential confluence zone for the end of wave 5 (green), wave v (purple), and wave iii (black) is 3669 – 3678.
o After this zone, price is expected to correct into wave iv (black), which often develops sideways and shallow.
➡️ Once wave iv (black) is complete, the market is expected to continue higher into wave v (black).
➡️ High liquidity zones highlighted by the Volume Profile will act as support, preventing a deep decline and providing momentum for wave v (black).
• Wave iv usually retraces back to the wave 4 of a smaller degree. Currently, we have two key areas:
o Wave 4 (green) around 3597
o Wave iv (purple) around 3552 – 3530
————————————-
🔹 Trading Plan
1. Buy Zone 1: 3598 – 3596
o SL: 3588 (or 3579 for wider risk tolerance)
o TP1: 3669
2. Buy Zone 2: 3553 – 3550
o SL: 3540
o TP1: 3597

Gold - Intraday Long Setup (5M TF) | Smart Money + Elliott Struc# 🟢 Gold - Intraday Long Setup (5M TF) | Smart Money + Elliott Structure
**Pair:** Gold Spot / USD
**Timeframe:** 5M
**Session:** London / NY Overlap
**Type:** Intraday Long Idea
**Concepts:** Smart Money, Supply & Demand, Wave Analysis, SSL Confirmation
---
## 🔍 Market Context
The market is currently reacting inside a **key Demand Zone** on the 5-minute timeframe, following a strong bearish move during the London session. The structure suggests a corrective **ABC wave formation**, where the **(c) point** appears to be forming a potential higher low at demand.
- Point **(a)**: Marked the first impulse down
- Point **(b)**: Rejection at minor **Supply Zone**
- Point **(c)**: Retest of **POI at Demand**, showing signs of exhaustion in selling pressure
---
## 📈 Technical Confluences
- 🟦 **Demand Zone** active and respected
- 📏 Potential BOS (Break of Structure) upon break of the recent high
- 📊 **Vol %ile** = 83% → Above average participation
- ⚠️ Risk Level: High (tight structure, requires confirmation)
- 🧭 Entry Distance: Near
---
## 🔧 Indicators Status (SSL Hybrid)
| Indicator | Status |
|--------------------------|----------|
| SSL Channel | ✅ Bullish cross (supporting reversal)
| RSI (50) | ✅ Holding above midpoint
| MACD | ✅ Bullish crossover (early signal)
| BB Oscillator / HT / RQK | ❌ Still bearish (lagging)
---
## 🎯 Trade Idea
**Bias:** Long
**Trigger:** Break above **minor Supply** and formation of BOS
**Target Zones:**
1. **TP1:** 3,370
2. **TP2:** 3,378 (supply edge)
3. **TP3:** 3,385 (upper supply zone)
**SL:** Below point (c) @ **~3,357**
---
## 🧠 Notes
This setup is valid as long as price holds above the Demand Zone and confirms a bullish shift via BOS. Wait for clear confirmation before entering.
_This is an educational idea based on Smart Money + Elliott Wave principles – not financial advice._
---
#gold #smartmoney #supplydemand #elliottwave #sslhybrid #intraday #5mtf #tradingview

9/9: Expect a Main Pullback Today, Likely to Drop Below 3600🌅 Good morning everyone!
🔹 Key Support Levels
30M : 3632 / 3615–3598
1H : 3626 / 3614–3588
2H : 3608–3590 / 3560
4H : 3613–3598 / 3681–3664
1D : 3564 / 3507–3498
🔹 Key Resistance Levels
3650–3670
🔹 Intraday Trading Strategy
Sell on rallies, especially near 3650 and above
Buy on pullbacks at support, focus on the 1H support zones
Trade mainly in short-term swings, quick in and out, secure profits early
Yesterday, gold pulled back to around 3577 before rebounding strongly. Currently, the 30M chart shows a bullish alignment. In the short term, watch 3650 as a key resistance. If broken, price may extend to 3658–3670.
🎯 Overall Outlook: Buy the dips, sell the highs. Focus on key support and resistance levels, avoid holding positions too long.
Gold Tests Key Reversal Zone – Bears on WatchGold ( OANDA:XAUUSD ) completed the move as I expected in my previous idea , both the down and up moves I expected.
Gold is currently moving in the Potential Reversal Zone(PRZ) .
Also, we can see the Regular Divergence(RD-) between Consecutive Peaks .
In terms of Elliott wave theory , it looks like Gold is completing the 5th microwaves of the main wave 3 .
I expect Gold to start correcting in the coming hours and drop to at least $3,593(First Target) .
Second Target: $3,583
Stop Loss(SL): $3,634
Gold Analyze (XAUUSD), 1-hour time frame.
Be sure to follow the updated ideas.
Do not forget to put a Stop loss for your positions (For every position you want to open).
Please follow your strategy; this is just my idea, and I will gladly see your ideas in this post.
Please do not forget the ✅ ' like ' ✅ button 🙏😊 & Share it with your friends; thanks, and Trade safe.

XAUUSD – Breakout in Action, Next Liquidity Zones AheadMarket View:
Gold (XAUUSD) has just broken out of consolidation, confirming bullish momentum. After the accumulation phase, price surged strongly, showing buyers remain in control. The focus now shifts to the next liquidity zones above, with upside momentum still dominant.
Key Levels (H1/H15):
Immediate Resistance: 3621 – 3633
Next Liquidity Sell Zone: 3649 – 3650
Extended Target: 3669 – 3678
Support: 3595 – 3580 – 3572
Technical Outlook:
Breakout confirms continuation of the bullish trend.
As long as price holds above 3595, the structure stays intact.
A clean break through 3621–3633 opens the path towards 3649–3669.
Trading Plan:
BUY (preferred):
Buy on retest around 3595–3600
SL: 3580
TP: 3621 → 3633 → 3649 → 3669+
SELL scalp (alternative):
Only if strong rejection occurs at 3632 – 3634
SL: 3640
TP: 3625 → 3630 → 3620
Summary:
✅ Breakout confirmed, bullish momentum remains strong.
👉 Watch 3621–3633 and 3649–3650 closely for the next trading opportunities.
Follow MMFLOW TRADING for more updates and execution setups!

Gold Trade Set Up Sep 8 2025OANDA:XAUUSD
www.tradingview.com
Price broke structure on the 15m then came down and formed MSS, came higher and formed a rejection block, tested 50% of the RB now im targeting equal lows/low range liquidity
But on the higher time frames we are still bullish so i want to see a pull back before going higher
