Gold Trade Set Up Nov 3 2025Price is making HL/HH on the 1h and is now testing 15m Supply so i will only be looking for buys if price continues to make a HH but if price can respect this supply and make bearish internal structure on the 5m-15m i will look for sells down towards SSL
Xauusdidea

XAUUSD/GOLD 1H BUY PROJECTION 03.11.25🟩 Technical Summary:
Structure: Price has broken out of a 1H downtrend line, signaling a potential bullish reversal.
Pattern Confirmation: A Bullish Engulfing candle confirms buying momentum.
Zones Marked:
Resistance R1: Around 4,020 zone
Resistance R2: Around 4,030–4,035 zone
4H Target Price: ~4,075–4,080 zone
Support Zone: Near 3,995–4,000 (Stoploss area).
📈 Projection Logic:
Price breaks 1H downtrend.
Retests near the trendline breakout zone (~4,000–4,010).
Pushes towards R1 and R2.
Final 4H target projected near 4,075–4,080.
🎯 Buy Setup Example:
Buy Entry: 4,005 – 4,010 (after retest)
Stoploss: 3,985 – 3,990
Target: 4,075 – 4,080
Risk–Reward: Roughly 1:3+

XAUUSD is on Rangebound currently market is bullish biased and Rangebound from 3995-4040 -zone.
Although it's upside at 3998 was to quick.
What are my conditions For This setup?
- I'm waiting for buy from 3990-3980 area & expecting the reversal move towards 4028- 4047 target although currently I took bu6 from 3995-3990 area and holding till my Targets
- Second if H1-H4 candle closes above 4045 area I will straight Buy and target 4070-4090 .
✳️Secondly if H4-H1 candle closes below 3975-3970 our buying will be compromised

XAU/USD Daily Structure – Bullish Reversal Targeting BPR ZoneA potential bullish reversal after a recent pullback, aiming for a retest of higher price levels.
Prior Price Action: The price experienced a strong uptrend (sequence of large green candles) leading up to the mid-October high, followed by a sharp pullback (red candles) which broke below a previous low, labeled as BOS (Break of Structure). This BOS confirms a short-term bearish shift or the start of a deep correction within the larger uptrend.
Current Price Level: The price is currently near $4,008.10, having shown recent bullish momentum (the last green candle) off a recent swing low.
Key Levels and Concepts:
D/FVG (Daily Fair Value Gap): There are two Fair Value Gaps marked on the chart.
The lower D/FVG (around $4,000 - $4,060) acted as an initial target or point of interest during the decline. The price has started to move up from this area.
The upper D/FVG (around $4,170 - $4,220) represents a future potential target.
BPR (Balanced Price Range): This blue area (around $4,160 - $4,180) is an area where a previous down move's FVG overlaps with a subsequent up move's FVG (or vice versa), suggesting a zone where the market might find temporary balance or resistance/support.
Projected Path: The black arrow illustrates a bullish projection. The price is expected to continue its upward move, potentially targeting the lower D/FVG for a re-entry/retest before making its way towards the BPR and the upper D/FVG as the final target of this short-term analysis.

GoldXAUUSD
- Bullish Channel as an corrective pattern in Short Time Frame
- RSI - Divergence
- Completed " 12345 " Impulsive Waves and " ABC " Corrective Waves
- Falling Wedge as an corrective pattern in Long Time Frame
- Order Block

Elliott Wave Analysis – XAUUSD | November 3, 2025
🔹 Momentum
D1 Timeframe:
Daily momentum is currently rising and approaching the overbought zone.
At the current pace, it is expected that within 2–3 more D1 candles, momentum will reach the overbought area — increasing the risk of a potential reversal.
However, in the short term, the bullish trend still dominates.
H4 Timeframe:
H4 momentum is reversing upward, and if a strong bullish candle breaks above the 4028 resistance level, it will confirm a bullish reversal, potentially leading to a 5-candle H4 uptrend within today’s session.
H1 Timeframe:
H1 momentum is preparing to turn downward, suggesting a short-term pullback may occur before the next upside continuation aligned with the broader H4 trend.
________________________________________
🔹 Wave Structure
D1 Timeframe:
Current data still supports the scenario that the market is forming Wave (4) in yellow.
However, more time is needed for a clear confirmation.
If D1 momentum enters the overbought zone without price creating a new high, that would give us additional confirmation of this wave count.
In the short term, price may continue rising for another 2 days.
H4 Timeframe:
The scenario of Wave (4) in purple within Wave (3) in yellow remains valid and has not been invalidated.
If price breaks above the 4379 high, it would confirm the formation of Wave (5) in purple, signaling the start of a strong bullish move.
At present, price movement remains choppy and overlapping, showing no clear trend direction — hence, we need to monitor price action closely.
With H4 momentum turning upward and resistance around 4028 forming a symmetrical triangle pattern, I expect a bullish move of 4–5 H4 candles today.
A decisive breakout above 4028 would further reinforce this bullish scenario.
H1 Timeframe:
The current H1 structure may be forming either:
• Wave X within the larger D1 structure, or
• Wave (5) in purple within the H4 structure.
In either case, we can expect a short-term upward move in line with H4 momentum.
Currently, price is hovering around the 4017 resistance zone, while H1 momentum is preparing to turn downward — therefore, a short-term correction toward the 3953 liquidity zone is expected.
This area will serve as a potential buy zone.
________________________________________
🎯 Trading Plan
• Buy Zone: 3954 – 3952
• Stop Loss: 3944
• Take Profit 1: 4050

technical analysis for your chart on Gold (XAU/USDEUREX:FDAX1! EUREX:FDXS1! EUREX:FDXM1! ICEEUR:NCF1! ICEEUR:Z1! ICEEUR:RC1! EUREX:FGBX1! EUREX:FXXP1! ICEEUR:R1! ICEEUR:SOA1! Current Price: $4,002
Trend Structure: The pair is showing a potential reversal setup after a completed downward channel.
Recent Pattern: Price has broken slightly above the descending channel and is now retesting the breakout zone around the support level ($3,950–$3,980).
🔹 Key Technical Levels
Support Zone: $3,940 – $3,980
→ Strong accumulation area shown by multiple rejections and previous demand.
Immediate Resistance: $4,080 – $4,120
→ Minor resistance expected as the first hurdle after breakout.
Major Resistance (Target): $4,385
→ Marked as the final bullish target on the chart.
📈 Bullish Scenario
If price sustains above $4,000, we can expect:
A short-term retest of $4,080–$4,120.
Once momentum confirms above $4,120, bullish continuation toward $4,200 → $4,385 (main target).
✅ Buy Confirmation:
Break and close above $4,050 with volume.
Retest of $4,000 zone followed by bullish rejection candle.
🎯 Bullish Targets:
TP1: $4,080
TP2: $4,200
TP3: $4,385
📉 Bearish Scenario
If price rejects $4,000 and closes below the support zone ($3,950):
Downside may resume toward $3,880 – $3,820 range.
That would invalidate the bullish breakout and confirm channel continuation.
🚫 Sell Trigger:
3H close below $3,940.
🎯 Bearish Targets:
TP1: $3,880
TP2: $3,820
📊 Conclusion
Structure is shifting from bearish to bullish after a channel breakout.
The $3,950–$4,000 area is key — a stronghold for bulls.
Expect a bullish rally if support holds, targeting $4,385 in the medium term.

XAUUSD BEARISH REVERSAL SETUP FROM SUPPLY ZONE🔍 Key Observations:
1. Market Structure Shift:
A Change of Character (CHoCH) has occurred near the upper boundary of the ascending channel.
This indicates a potential shift from bullish to bearish momentum.
2. Liquidity & Supply Zone:
The red zone near $4,044 – $4,018 acts as a supply zone or bearish order block.
Price has reacted from this level, rejecting higher prices.
3. Entry & Targets:
Entry: Around $4,011 – $4,018 (current zone)
Stop Loss: Above the recent high near $4,044
First Target (TP1): $3,977 – local liquidity zone
Second Target (TP2): $3,930 – $3,915 major demand area / imbalance fill zone
4. Channel Breakdown Potential:
If the price closes below the lower trendline of the ascending channel, a strong bearish continuation toward the lower targets is expected.
5. Smart Money Concept (SMC) View:
The chart aligns with liquidity grab above highs, followed by CHoCH, suggesting smart money selling pressure.
A retracement to premium zones has already happened, and distribution is likely underway.
📉 Bearish Outlook Summary:
Bias: Bearish
Entry Zone: 4,011 – 4,018
Stop Loss: 4,044
Target 1: 3,977
Target 2: 3,930 – 3,915
Invalidation: Break and close above 4,045 would negate bearish setup.

GoldXAUUSD
- Resistance Level
- Bullish Channel as an corrective pattern in Long Time Frame
- RSI - Divergence
- Symmetrical Triangle as an corrective pattern in Short Time Frame
- Completed " 12345 " Impulsive Waves and " ABC " Corrective Waves

The gold price is still in the process of correcting Wave 4The gold price is still in the process of correcting Wave 4, and nothing has changed structurally.
Currently, the price continues to respect the corrective zone we have been monitoring, and the internal waves still support the complex WXY pattern. This tells us one thing:
⏳ The correction is not over.
Once Wave 4 is complete, the real opportunity will begin:
✅ First impulse up → confirms trend resumption
✅ Pullback (Wave 2) → optimal entry point
✅ Wave 3 → highest potential reward 🚀
If the price breaks above the current resistance zone from here, we will monitor the alternative count. However, as long as the structure hasn't confirmed it, we remain patient.
Remember:
Corrections are designed to test patience.
Wave 4 is historically the most complex wave; triangles, flats, and complex structures are common.
Remain disciplined. Let the structure settle. The next leg up will be worth the wait.
gold await breakout to buy or sell#XAUUSD we await price to fall below 4017 on 2 times breakout before selling. The price is reforming a new trend.
Sell below 4017 2 times breakout, target 3982, stop loss 4028.
H1 closure above 4030-32 will continue bullish till 4050.
Await for breakout before trading

Gold Trade Set Up Oct 31 2025Price is bullish on the 1h and 15m making HH/HL and just broke structure to the upside on the 15m so i want to see a pullback into 15m FVG or sweep internal 5m SSl before looking for a continuation back up

XAUUSD Bearish Setup: Bear Flag Breakdown Toward 3,750XAUUSD’s 1D chart just cooled after a steep August–October advance, peaking near 4,333 before sliding under the 20-day MA (~4,091). Price is now coiling above 4,000, with a potential Bear Flag taking shape beneath the recent high. Resistance sits at 4,333, while short-term support is the pullback low at 3,988. Momentum has flipped soft: MACD crossed down and price is below the Bollinger midline, even as the broader trend (MA20 > MA60 > MA120) remains intact.
Primary path: a daily close below 3,988 confirms the Bear Flag and opens a continuation move toward 3,850, then the MA60/major demand around 3,750–3,740. For shorts triggered under 3,988, invalidation sits cleanly back above the consolidation high near 4,095; acceptance below 3,950 would add follow-through risk toward 3,745.
Alternative: if 3,988 holds and price reclaims the 20-day with a daily close above 4,100, buyers can press a squeeze toward 4,280 and a retest of 4,330–4,333. For longs above 4,100, a tight invalidation sits below 4,020; a decisive break over 4,333 would restore trend continuation.
Levels to watch: Resistance 4,333; supply near 4,280–4,333. Support 3,988; demand 3,750–3,740. Triggers: break-and-hold <3,988 (bearish) or daily close >4,100 (bullish). This is a study, not financial advice. Manage risk and invalidations

GOLD Very Near Perfect Place For See , 500 Pips Waiting !Here is My 30 Mins Gold Chart , and here is my opinion , we again Below 4050.00 With 4H Candle and the price come back to retest it ! and we have a 4H Candle closure below it And Perfect Breakout and this give us a very good confirmation , so we have a good confirmation now to can sell after the price go back to retest the broken area between 4050.00 : 4055.00 , and give us a good wicks as previous wicks ! and we can targeting 100 to 200 pips . if we have a daily closure above this area this mean this idea will not be valid anymore .
Reasons To Enter :
1- Perfect Touch For The Area .
2- Clear Bearish Price Action .
3- Bigger T.F Giving Good Bearish P.A .
4- Over Bought .
5- Perfect 30 Mins Closure .

GOLD ; How far down?Hello friends
Well, after the good rise we had, the price needed a correction, which happened with a double top pattern.
Now the main question is, how far will the fall go?
Well, in the short term, the price can fall to the specified limits, and if the support areas are broken, the fall will continue, and on the other hand, an important resistance has been created, which the price needs to break for the new ATH.
With this decline, it is unlikely that the price will suffer for a while and correct because it has grown a lot and everything will end one day...
Support levels can be good points for buying, of course with capital and risk management.
*Trade safely with us*

Gold Trade Set Up Oct 30 2025Price pushed up after failing to break and close below 4h swing lows and is making 1h and 15m HH/HL so internally i am bullish. If price can break and close above 15m LH and sweep 5m SSL i will look for buys to London highs and PDH but if price fails to close above 15m highs and closes below 15m and 1h swing low i will wait for a BSL sweep on the 5m to target PDL

GoldXAUUSD
- Fair Value Gap
- RSI - Divergence
- Completed " 12345 " Impulsive Waves and " ABC " Corrective Waves
- Demand Zone
- Bearish Channel as an corrective pattern in Short Time Frame

Elliott Wave Analysis – XAUUSD | October 30, 2025
1️⃣ Momentum
• D1 Timeframe:
D1 momentum remains entangled. Yesterday’s daily candle closed at its lowest point, rejecting all intraday bullish attempts. However, it has not yet broken the previous candle’s low — this suggests that the bearish trend is still intact, though weakening, and a potential reversal could occur within the next 1–2 days.
• H4 Timeframe:
H4 momentum is approaching the oversold zone, indicating a possible short-term recovery lasting around 4–5 H4 candles.
• H1 Timeframe:
The price is currently either consolidating or continuing its short-term decline.
If it continues to cling to the 3927 liquidity zone, a further breakdown is likely.
________________________________________
2️⃣ Wave Structure
• D1 Timeframe:
Price is now sitting near the 0.382 Fibonacci retracement of wave (3) in yellow — a typical correction level for wave (4).
Therefore, if the decline continues or the correction extends, it’s highly probable that we are in wave (4) of the yellow count, and the current drop is only the first sub-wave of this corrective phase.
• H4 Timeframe:
Currently, price is around the 0.872 extension of wave (3) in purple, which is not ideal for a completed wave (4).
When combining the D1 and H4 structures, both indicate that the market is likely forming a corrective wave (4) in yellow, and a recovery move may soon appear as D1 momentum begins to turn upward.
👉 If this scenario is confirmed:
o If price breaks above the previous wave (3) high (around 4400), it would confirm the start of a new impulsive wave upward.
o If price rises slowly and the highest target only reaches around 4400 before turning down again → this move is likely part of the corrective wave (4) before another bearish leg resumes.
• H1 Timeframe:
The current formation suggests a potential double zigzag structure.
To confirm this setup, price needs to break below 3892. This is a strong liquidity zone, so if price reaches it, a temporary bounce could occur.
Key liquidity zones above to watch: 3927 – 3953 – 3995.
If price fails to break above the previous red wave X, these zones may act as strong resistance levels, pushing the market lower again.
Target areas for the red wave Y are:
o 3814
o 3786
________________________________________
3️⃣ Trade Plan
Scenario 1:
• Buy Zone: 3815 – 3813
• SL: 3804
• TP1: 3892
Scenario 2:
• Buy Zone: 3787 – 3785
• SL: 3776
• TP1: 3892
________________________________________
📌 Summary:
D1 momentum is weakening and nearing the oversold zone → a potential bullish rebound could develop in the coming sessions.
The 3815 – 3785 area remains a key buy zone, while 3927 – 3995 should be closely monitored as resistance levels to confirm the next directional move.

Fomc Xauuusd quick buy Gold (XAU/USD) is showing bullish momentum after FOMC news, bouncing from support around 3951. Price targets are set near 4153 and the long-term target at 4376. A breakout above resistance could trigger a strong upward move.

gold on sell reverse#XAUUSD price have breakout the 4000 price on retracement. Now we await for 2 times breakout below 4013 before selling.
Below 4013 sell on 2 times breakout, target 3986-3959, stop loss 4027.
Buying can be valid if the Fed rates gives something good.

Gold Trade Set Up Oct 29 2025Price shifted to bullish structure, closing above 1h swing high and making HL/HH on all smaller time frames so i want to see a sweep of 15m SSL and/or tap into 15m demand followed by a 5m up close candle to target EQH above

Gold (XAU/USD) 4H Chart Analysis – Short-Term Reversal from ?Technical Overview:
Gold has recently rebounded from a High Demand Zone around the $3,900–$3,910 region, showing clear signs of buyer re-entry after a prolonged bearish correction. The candle structure suggests strong bullish intent, with higher lows forming and a potential continuation toward the next liquidity area.
Key Observations:
🔹 High Demand Zone: Price reacted strongly here, indicating institutional buying pressure.
🔹 High Prop POI (Point of Interest): Served as a key accumulation level before the breakout.
🔹 SMC Trap: Indicates a prior liquidity grab, trapping late sellers before the move up.
🔹 Bullish Momentum Building: Consecutive bullish candles after rejection from the demand zone strengthen the reversal bias.
Target Projection:
🎯 Immediate Target: $4,080 – $4,100 (aligned with local resistance and liquidity grab zone).
🛑 Support: $3,905 (must hold to maintain bullish structure).
💎 Extended Target (if momentum continues): $4,160 – $4,180 (previous major swing high zone).
Summary:
Gold is showing a short-term recovery phase within a broader bullish structure. A confirmed 4H close above $4,030 would likely propel price toward the $4,100 region, while a drop below $3,900 would invalidate the bullish setup.
📊 Suggested Title:
"Gold Rebounds from Key Demand Zone, Eyes $4,100 Resistance 🔥"

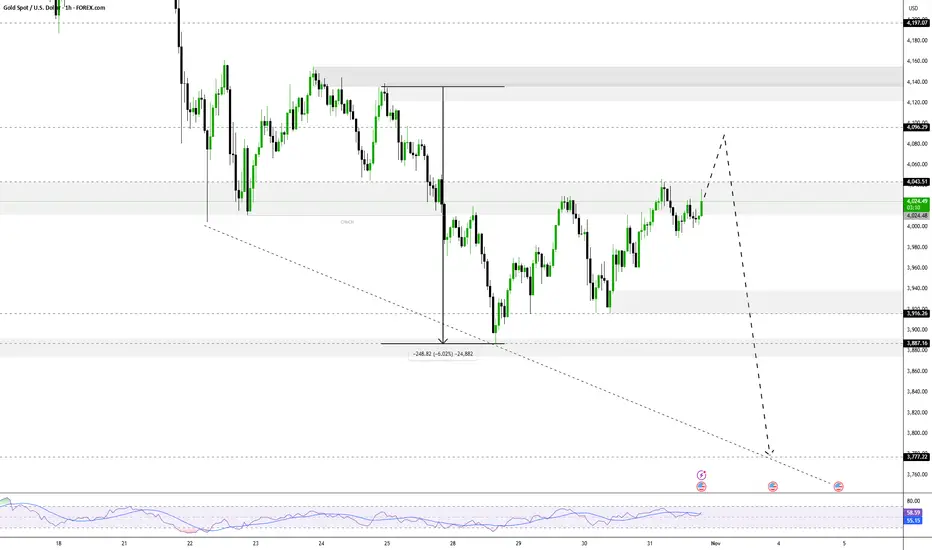
Gold Breaks Key Support Zone — Bearish Momentum Builds Below $4,Analysis:
The XAU/USD (Gold vs. USD) 45-minute chart shows a clear breakdown below the established support zone, indicating a shift in market sentiment from consolidation to bearish momentum.
The support zone around $4,050 – $4,000 had previously held multiple times, acting as a strong demand area.
The recent breakout below this zone confirms a potential trend continuation to the downside.
Price action suggests a bearish pattern with lower highs and lower lows forming before the breakout.
A retest of the broken support (now resistance) may occur before the next leg lower.
The next major target lies near $3,900 – $3,850, aligning with the projected measured move.
Technical Outlook:
If gold fails to reclaim the $4,050 level, further downside pressure remains likely. However, a close back above this level could invalidate the bearish breakout and signal a possible false break.
