ANFIBO | XAUUSD - What's next?Hello guys! It's me, Anfibo.
My previous OANDA:XAUUSD plan with the Sell entry at 3,670 – 3,674 delivered more than 400 pips in profit, confirming that the market reacted exactly as anticipated.
At present, observing the price structure, gold has completed a 5-wave Elliott impulse and is now transitioning into an ABC corrective phase. This is a classic scenario following a strong impulsive leg, where the market needs to rebalance before determining the next trend.
At the same time, the current price zone is also showing signs of forming a Head and Shoulders pattern, adding another layer of reliable technical confluence. This suggests that downside pressure remains in play, at least until the pattern is fully developed.
Key short-term resistance levels to watch are around 3,690 – 3,700.
Meanwhile, immediate support levels can be found near 3,630 – 3,620 – 3,615, with a deeper support at 3,590, which will be decisive for the longer-term bullish structure.
The preferred strategy is to wait for price reactions at these resistance confluence zones to look for short-term Sell signals, in line with the ongoing ABC correction.
Here's My Trading Plan
>>> BUY SCALP
Entry: 3,620 – 3,615
SL: 3,610
TP: 3,650 – 3,670
>>> SELL Scalp
Entry: 3,670 – 3,675
SL: 3,680
TP: 3,620 – 3,590
Always set your Stop-Loss on every trade! Wishing everyone successful trading. XOXO
Xauusdidea

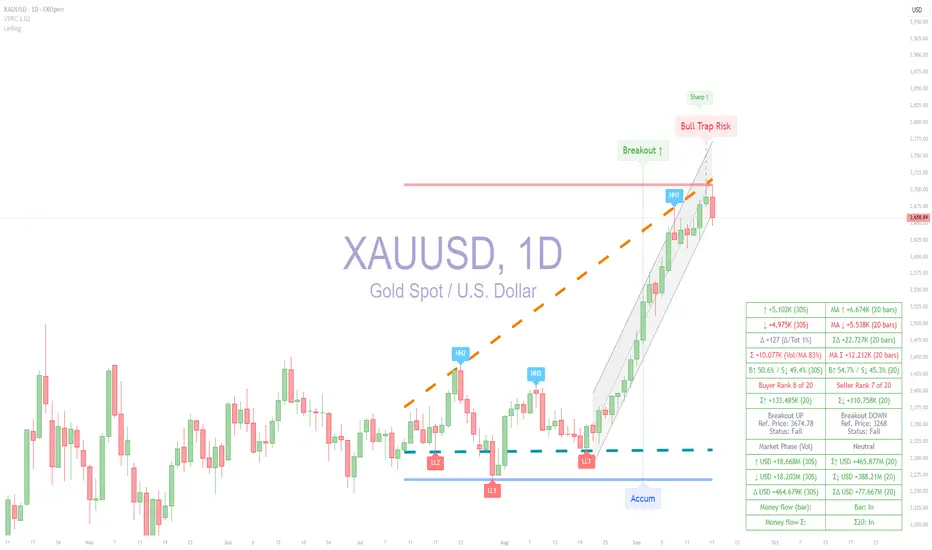
Gold Analysis using ATAI Volume Pressure AnalyzerIntroduction:
In this analysis, we use the ATAI Volume Pressure Analyzer indicator , which is based on the logic of separating buy/sell volume. The indicator retrieves volume data from a lower timeframe and reconstructs it on the host timeframe. This is achieved using the internal function, TradingView/ta/10 → tvta.requestUpAndDownVolume(lowerTF) , which extracts Up Volume, Down Volume, and Delta from the selected lower timeframe, enabling aggregation and evaluation of market pressure. One-tick data provides the highest precision but is limited in historical coverage; conversely, higher timeframes provide more historical depth but with relative accuracy.
In this daily chart, to calculate 20-period volume averages, the lowest timeframe that both preserved relative accuracy and provided sufficient historical data for 20 candles was 30 seconds , which was selected. This choice is reflected in the corresponding rows of the left and right columns of the HUD panel. It should be noted that in the gold market, the actual traded contract volume is not centrally available; therefore, the volume used in this method is based on tick volume (the count of price changes within each bar) . This serves as a proxy for activity and order flow intensity rather than absolute turnover. Accordingly, aggregates and deltas are interpreted on a relative basis and used to identify acceleration, volume spikes, and breakouts alongside price structure.
Trendlines and Market Direction
Beyond volume-based calculations, the indicator also visualizes directional bias through adaptive trendlines. The dotted orange and turquoise lines are drawn from successive pivot highs and lows over a 50-bar window, effectively capturing the slope of price movement. In the chart, these diagonals clearly reveal the transition: price has broken out of a mid-range accumulation zone and established a sequence of higher highs and higher lows, confirming a structural uptrend.
Complementing this, the blue horizontal line marks the base of the prior accumulation (support), while the red line highlights the resistance level at the top. The breakout above this framework, supported by bullish volume ratios shown in the HUD, validates that the market has shifted from neutrality into a sustained upward trend.
Labels and Market Conditions
The labels displayed on the chart — such as Accum, Breakout ↑, Sharp ↑, and Bull Trap Risk — are derived from explicit quantitative rules inside the indicator. These rules combine price levels, buy/sell volume deltas, and moving aggregates. Below, each label is explained with both its coding logic and its mathematical interpretation in plain language.
Accum (Accumulation)
Logic: |Δ| < ε ∧ Var(ΣV) → min
Meaning: The difference between buy and sell volume (Δ) is close to zero, and the variance of total volume ΣV is minimal over the chosen window. In simple terms, this marks a balanced market where buyers and sellers are matched, forming a neutral accumulation zone.
Breakout ↑
Logic: Pt > max(Pacc) ∧ Δ > 0 ∧ ΣV20 ↑
Meaning: The closing price Pt breaks above the maximum price of the accumulation zone (Pacc), while buy volume is greater than sell volume (Δ > 0), and the 20-bar aggregate volume ΣV20 is increasing. In simple terms, this confirms that buyers dominate and the market is breaking upward with sufficient volume support.
Sharp ↑
Logic: ΔP / Δt > θ
Meaning: The slope of price change (ΔP per unit time) exceeds a defined threshold θ. In simple terms, this indicates an accelerated move upward — a breakout with unusually strong momentum.
Bull Trap Risk
Logic: Pt < Pbreakout ∧ Δ ↓ ∧ ΣV20 ↓
Meaning: After an initial breakout, the price Pt falls back below the breakout level, while buy volume weakens (Δ decreases) and the 20-bar aggregate volume ΣV20 declines. In simple terms, this signals that the breakout has lost support and may have trapped buyers — hence the label Bull Trap Risk.
Trendlines and Guidance
The dotted trendlines are constructed from the slope of price and aligned with recent pivot highs (HH) and lows (LL). Mathematically, the slope is defined as:
m = (P_pivot2 − P_pivot1) / (t2 − t1)
where P_pivot are the price levels at successive pivots, and t are their bar indices. A positive slope (m > 0) indicates an upward trend, while m < 0 indicates a downward trend.
In this chart, the slope of the mid-band is clearly positive, and the label HH1 is printed at the breakout of the upper boundary. This confirms that the market has transitioned out of a ranging phase and into a structural uptrend characterized by higher highs and higher lows.
Horizontal Lines
The horizontal guidance lines (support and resistance) are calculated from the extremes over the last N = 50 bars:
S = min(P_t), R = max(P_t) for t ∈
The blue line marks support at the lowest low, and the red line marks resistance at the highest high. Together, these dynamic references highlight where order flow has historically concentrated and provide anchors for interpreting future price reactions.
Each of these labels therefore reflects a mathematical condition expressed both in code and in statistical terms. Together they describe a sequence of phases: balanced accumulation, directional breakout, acceleration, and potential failure traps. This structured approach translates raw volume and price data into actionable signals.
Conclusion: XAUUSD Market Outlook
The recent chart action combines signals from the ATAI Volume Pressure Analyzer with a secondary tool, the 20-period Linear Regression channel. This multi-tool perspective highlights the importance of cross-validation in market analysis.
Key Observations
- Volume Pressure Analyzer Signals: After a strong breakout and sharp upward momentum, the indicator has now triggered the label Bull Trap Risk . This label reflects weakening buy-side dominance, declining delta values, and a potential failure of the breakout to sustain order-flow support.
- Linear Regression (20-period): The regression channel illustrates a clear ascending path starting from the former accumulation zone. The latest red candle has closed outside the channel to the downside, confirming a loss of alignment with the prior uptrend.
- Structural Divergence: The combination of volume weakness (as flagged by VPRC) and structural channel break creates a divergence. Price remains elevated but lacks the necessary buy-side reinforcement, raising the probability of a correction or a full trend reversal.
Interpretation
This scenario indicates a transition risk: from a sharp bullish phase into either a corrective pullback or a potential distribution phase. The decisive factor remains the behavior of buyers and sellers in the next candles — whether buyers can reclaim the channel or sellers consolidate control.
Disclaimer
This XAUUSD analysis has been conducted using the ATAI Volume Pressure Analyzer indicator in conjunction with the supporting Linear Regression (20-period) tool. It does not constitute any form of financial advice regarding buying, selling, or holding positions. The analysis solely illustrates the dynamics of buyer and seller behavior in the market.
GOLD Resistance Cluster Above!
HI,Traders !
#GOLD made a bearish
Breakout of the support
Cluster of the rising and
Horizontal support levels
Which is now a resistance
Cluster round 3661$ then
Went down and made a local
Pullback on but we are bearish
Biased mid-term so we
Will be expecting a further
Bearish move down this week !
Comment and subscribe to help us grow !

ANFIBO | XAUUSD on my view today??? [09.18.2025]Hello traders! It’s me, Anfibo. As usual, I’d like to share my personal view on gold OANDA:XAUUSD for today’s session.
On the H4 chart, gold continues to hold firmly within the upward channel, showing no major signs of weakness. The latest H4 candle closed as a bullish hammer with a long lower wick and a strong body, indicating aggressive buying absorption and solid reactions around the trendline.
In my view, as long as price stays above 3,620 USD, the bullish structure on H4 remains intact, and buyers still maintain control.
On H1, price is currently trading around 3,671 USD, and I expect it to retest yesterday’s FOMC gap near 3,678 – 3,680 USD. This is a sensitive area because it aligns with multiple confluences:
> Fibonacci retracement 0.618.
> Trendline confluence.
> Fair Value Gap (FVG).
Together, these factors make 3,678 – 3,680 a strong short-term resistance, worth considering for a counter-trend sell scalp setup.
Here’s my personal plan today:
>>> BUY SCALP:
ENTRY: around 3.645
SL: 3,640
TP: 3,679 – 3,690
_________________
>>> SELL Scalp
(1) ENTRY: 3,670 – 3,674
SL: 3,676
TP: 3,655 – 3,650
(2) ENTRY: 3,678 – 3,680
SL: 3,685
TP: 3,650 – 3,645
My approach remains the same: buy at strong support, sell at confluence resistance, and never take trades without clear risk management in place.
Besides technicals, don’t overlook today’s Unemployment Claims data. This release could trigger volatility and potentially break through key levels. Personally, I’ll wait for the market’s reaction to the news before committing to larger positions.
>>> Final Thoughts:
- H4 trend: still bullish above 3,620.
- H1: likely retest of resistance at 3,678 – 3,680.
- Plan: BUY around 3,645 – SELL around 3,678 – 3,680.
- Stick to risk management, and stay mindful of U.S. news flow to avoid being caught off guard.
Goodluck guys! ;)

9/18: Trade Within 3674–3638 Range, Watch Resistance Near 3670Good morning, everyone!
Those who followed yesterday’s strategy should have made good profits—congratulations!
Currently, the price is hovering near the 3658 support. For today, the main resistance is around 3670–3680. If this level is broken and held, there’s potential to retest the 3700 area. If not, the bullish momentum may weaken.
On the 1H chart, if the next move forms a strong bullish candle (medium/large green candle) to break through, the probability of further upside will increase, giving bulls more opportunities. However, if the price continues to face heavy resistance without breaking, watch out for bears who may launch an attack. Key supports to watch are 3647 and 3636–3632. If these levels break, the 1D trend will show a reversal, with a drop below 3600 very likely, and deeper corrections possibly extending to the 3560 area.
Intraday strategy:
Trade within the 3674–3638 range.
If the 3680 resistance is broken strongly, look for buying opportunities on a pullback or consider selling near 3688 or higher.
If 3650 breaks, look to sell on rebounds near resistance, or consider buying opportunities below 3630.
Adjust trades flexibly according to market changes.

GOLD NEXT MOVE 3500 or 3700 ?Gold Have A Resistance And Support
Support 3656 / 3653
If Gold Break The 3653 Then Next Target 3500
Resistance 3671 / 3669
If Gold Break 3671 Next Target 3700
Follow Us For More Trades

Gold Analysis (XAU/USD)Two key buy levels are in play:
First level: 3613
Second level: 3591
If a valid signal forms at either level, I’ll be looking to go long ✅.
My plan remains the same:
If a level breaks, I’ll wait for a pullback and take the opposite side.
No frustration, no changing strategy.
Losses are part of the game—what matters is risk management and sticking to the plan 🎯.
📖 Remember: trading is about flowing with the market, not fighting it.

Gold's Reversal: Analyzing the Fed's Surprise MoveThe gold market's movements last night were unpredictable and far from simple. After hitting a new historical peak of $3,707.40/oz, gold unexpectedly turned around and fell to $3,681.39/oz, despite the Fed cutting interest rates by 0.25% as expected! So, what exactly happened?
Fundamental Analysis: The Fed's Decision and Powell's "Cold Shoulder"
Rate Cut as Expected: The Fed cut interest rates by 0.25%, marking the first reduction this year after three cuts in 2024. This move, along with the forecast for two more cuts this year, met market expectations and initially sent gold soaring.
USD and Bond Yields Fell: Lower interest rates weaken the USD and reduce bond yields, making gold more attractive. This was the initial reason for gold's new peak.
Powell's "Hawkish" U-Turn: Everything changed when Fed Chair Jerome Powell spoke. He made surprisingly "hawkish" comments, suggesting the Fed doesn't need to rush its rate cuts and that today's action was just a "risk management" move.
The Aftermath: This statement poured cold water on expectations for a more aggressive rate-cutting path. Powell was clever—he both met market expectations and appeased political pressure (especially from the Trump administration), but he also kept investors in a state of caution and uncertainty. As a result, bond yields and the USD bounced back, putting selling pressure on gold.
Outlook: This shock might be temporary. Fundamentally, the Fed's start to a loosening cycle is still a positive long-term signal for gold. Gold may be impacted in the short term, but the bullish trend remains intact.
Technical Analysis: Volatility and Key Levels
Gold showed unpredictable swings after the news. After a quick drop to the $363x area, it bounced back very quickly. This shows that buying power at strong support levels is still robust.
Key Support: $3624, $3612, $3600, $3584, $3569
Resistance: $3667, $3675, $3686, $3700
Today's Key Level: The $364x range. If gold holds above this level by the end of the European session, we will favor long positions for the US session.
Trading Setups (Strict Risk Management is Advised):
Buy Scalp
Zone: $3639 - $3637
SL: $3633
TP: $3642 - $3647 - $3652 - $3657 - $3667
Buy Zone
Zone: $3606 - $3604
SL: $3596
TP: $3614 - $3624 - $3634 - $3644 - $3664
Sell Scalp
Zone: $3674 - $3676
SL: $3680
TP: $3671 - $3665 - $3660 - $3655 - $3645
Sell Zone
Zone: $3686 - $3688
SL: $3696
TP: $3678 - $3668 - $3658 - $3648 - $3628
Note: The market is highly volatile. Be cautious with every trade. Will gold continue its rally or correct further? Share your thoughts below! 👇
#Gold #XAUUSD #Fed #GoldAnalysis #TradingView #InterestRates #FinancialMarkets #TechnicalAnalysis #GoldTrading #Powell #CMEFedWatch
XAUUSD Movement and Trading Strategy todayYesterday, gold prices traded in a pattern of "first fluctuating downward then surging to break through key levels". After completing a correction during the daytime session, prices continued to rise in the evening, broke through the all-time high, and finally stabilized at the critical level of 3707.
From the current trend, although prices are in a pullback correction phase, the bullish trend has not undergone a fundamental change. After the short-term correction ends, the upward momentum is still expected to continue. On the daily chart, focus on the support zone around 3630.
Buy 3655 - 3660
TP 3670 - 3680 - 3690
Daily-updated accurate signals are at your disposal. If you run into any problems while trading, these signals serve as a reliable reference—don’t hesitate to use them! I truly hope they bring you significant assistance

My XAUUSD Trading View for TodayToday, my stance is to go long on a pullback—I am bullish on gold but advise against chasing the rally. The key lies in observing whether the 3610 level is broken down; only a breakdown below this level will prompt me to shift my strategy.
This is not stubbornness. The end of an uptrend is always confirmed by the breach of a support level, rather than by speculating or predicting the peak.
Daily-updated accurate signals are at your disposal. If you run into any problems while trading, these signals serve as a reliable reference—don’t hesitate to use them! I truly hope they bring you significant assistance

Elliott Wave Analysis XAUUSD – September 18, 2025
Momentum
• D1: Currently, D1 momentum is declining, therefore a downward move is likely to extend over the next 4–5 days.
• H4: Momentum is falling, so today we may see further downside to push momentum into the oversold zone before a potential reversal.
• H1: Momentum is still heading down, suggesting the bearish move is likely to continue.
________________________________________
Wave Structure
• D1: With momentum turning lower, it is highly probable that wave v black has completed and price has entered a corrective ABC phase. If this is the case, the correction will likely last for at least more than one week.
• H4: A 5-wave structure (1–2–3–4–5) within wave v black has been completed. The current decline could be wave A of the correction. We need to observe closely to confirm whether wave A is done. Note: during corrective phases, trading becomes more difficult; targets beyond 500 pips are rarely achieved as price tends to overlap. Toward the end of corrections, price often compresses and whipsaws both sides, so trade with smaller positions and manage risk carefully.
• H1:
o Scenario 1: Wave 1 of wave (5) black has formed, and the market is now in wave 2. This scenario is invalidated if price breaks below 3626.
o Scenario 2: Wave v black has already completed with a 5-wave structure. Price is now in a larger corrective phase (i–ii–iii–iv–v black on the D1). In this case, the correction will likely last longer than previous waves ii and iv – an important guide to prepare for an extended bearish or sideways phase.
On H1, the current drop is steep and impulsive, likely part of a 5-wave structure. The recovery was capped at the 38.2% Fibonacci retracement, which indicates:
• If this is wave 4 of the decline, price will break below 3649, with wave 5 of A projected toward 3632 → Buy zone.
• If price breaks above the minor high at the 38.2% Fibonacci level, it is more likely wave B of an ABC correction. In that case, the upside targets would be 3677 or 3694 → Sell zones.
⚠️ Note: Once price hits one target, the opposite entry setup will be canceled.
________________________________________
Trading Plan
Buy Zone:
• Entry: 3633 – 3630
• SL: 3620
• TP: 3649
Sell Zone 1:
• Entry: 3676 – 3679
• SL: 3686
• TP: 3657
Sell Zone 2:
• Entry: 3693 – 3696
• SL: 3703
• TP: 3677

18/9/68 : XAUUSD ( Europe / London Session )Using it from Europe Session until 7.00PM , I'll new analysis and update at 8.00PM
Resistance
3675-3680
3665-3670
3660
Support
3649
3639-3644
3628-3634

Gold Price Outlook – Bearish Trade Setup (XAU/USD)📊 Technical Structure
Gold (XAU/USD) is consolidating near $3,657 after a sharp pullback from its recent highs. The chart shows clear resistance around $3,665–$3,667, where repeated rejections have capped upside attempts. Price is now testing below intraday trendline support, signalling bearish momentum building up. A move back into the support zone at $3,650–$3,648 looks likely if sellers maintain control.
🎯 Trade Setup
Entry: $3,665 – $3,667 (near resistance rejection)
Stop Loss: $3,668 (above resistance zone)
Take Profit: $3,650 / $3,648 (support zone)
Risk/Reward: ~1 : 5.23
🗝️ Key Technical Levels
Resistance Zone: $3,665 – $3,667
Support Zone: $3,650 – $3,648
🌐 Macro Background
Gold remains volatile after the Fed’s 25 bps rate cut, which was seen as less dovish than markets expected. Chair Powell struck a cautious tone, noting limited support for deeper cuts, prompting a USD rebound and a pullback in gold from record highs near $3,707. While longer-term dovish expectations (further cuts in October and December) support bullion, short-term positioning suggests further profit-taking is likely. Any stronger US data (like jobless claims) could extend downside pressure.
📌 Trade Summary
The setup favours a short entry near $3,665–$3,667, targeting the $3,650–$3,648 support zone. Momentum remains bearish below $3,668 resistance, though broader uptrend expectations remain intact as long as gold holds above $3,643.
⚠️ Disclaimer
This analysis is for reference only and does not constitute trading advice. Trading involves significant risk, and proper risk management is essential.

Brief Review Yesterday, gold rallied before pulling back, fluctuating after hitting a new all-time high, as the market turned cautious ahead of the Fed policy decision. For the day, the probability of range-bound consolidation or a technical correction is high; focus on the support level of 3650-3635 and resistance level at 3710,with the short-term overbought pattern needing to be repaired.
Key attention should be paid to the interpretation of the Fed's dot plot, Powell's speech and the trend of the U.S. Dollar Index. Powell described the 25% rate cut as a "risk-management cut," aimed at addressing downside risks in the labor market. He emphasized that future policies will be "highly data-dependent" and rate cuts will be gradual and cautious.
Employment and inflation data are critical: Weak data will strengthen rate-cut expectations, boosting gold; resurgent inflation will dampen such expectations, weighing on gold.
Daily-updated accurate signals are at your disposal. If you run into any problems while trading, these signals serve as a reliable reference—don’t hesitate to use them! I truly hope they bring you significant assistance

GOLD Support Below!
HI,Traders !
#GOLD is trading in an
Uptrend and is
Now making a local bearish
Correction to retest the
Horizontal support below
Around 3658.62 from where
We will be expecting a
Further bullish move up !
Comment and subscribe to help us grow !

Don’t blindly shortFrom the 4-hour chart analysis, the support level remains solid. Today if prices pull back, stick to this level for bullish trades.
As we mentioned earlier, it is advisable not to blindly follow short positions; wait for the Fed to confirm the interest rate cut.
Daily-updated accurate signals are at your disposal. If you run into any problems while trading, these signals serve as a reliable reference—don’t hesitate to use them! I truly hope they bring you significant assistance

FOMC GOLD UPDATE !Gold Structure Buying In H1
Buy From FVG
Buy From Order Block
Buy From Breaker Block
Buy From MSS FVG
Follow Us For More Trades

XAUUSD Analysis todayHello traders, this is a complete multiple timeframe analysis of this pair. We see could find significant trading opportunities as per analysis upon price action confirmation we may take this trade. Smash the like button if you find value in this analysis and drop a comment if you have any questions or let me know which pair to cover in my next analysis.

ANFIBO | XAUUSD on 09.17.2025 and is this a major breakthrough?Here's Anfibo. With my yesterday's plan, our sell OANDA:XAUUSD order reached more than 200 pips, the buy order was 30 pips short of matching the entry and missed 150 pips short. But that's okay, I have a new plan today for everyone to follow:
💚 SUPPORT ZONES: 3676 - 3660
❤️ RESISTANCE ZONES: 3694 - 3700 - 3705 - 3719 - 3745
✅ BUY SCALP: 3675 - 3677, SL 3674, TP 3694 - 3700 - 3719
❌ SELL SCALP: 3719 - 3721, SL 3723, TP 3700 - 3675 - 3660
- - - - - - - - - - - - -
✅ SWING BUY: 3550 - 3560, SL 3540, TP 3625 - 3675 - 3700 - OPEN
❌ SWING SELL: 3790 - 3801, SL 2820, TP 3700 - 3570 - 3450 - OPEN
Hope is right lol! xoxo

17/9/68 : XAUUSD ( US Session )Using it from US Session until 11.00AM , I'll new analysis and update at 12.00PM
Resistance
3697-3703
3687-3692
3677-3682
3671
Support
3661
3651-3656
3640-3646
3630-3635

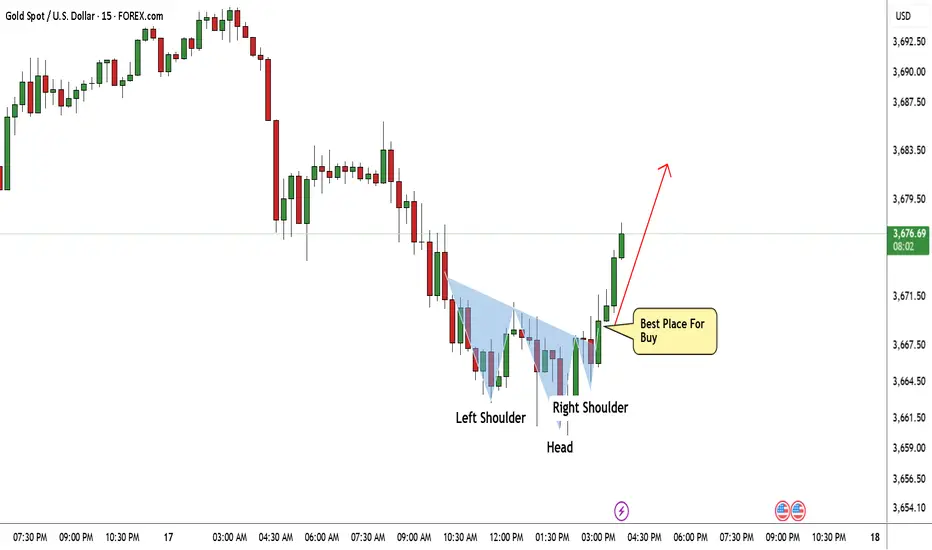
Gold Made A Clear Reversal Pattern , Long Setup To Get 200 PipsHere is my 15 Mins Chart On GOLD , The price creating a very clear reversal pattern ( Reversal head and shoulders pattern ) and the price made a very good bullish price action now and the price above my neckline. so we can enter a buy trade After the price go back to retest my broken neckline . For this trade we can be targeting from 100 : 150 pips with a decent stop loss.
Reasons To Enter :
1- Perfect Touch For The Area .
2- Clear Bullish Price Action .
3- Bigger T.F Giving Good Bullish P.A .
4- The Price Take The Last High .
5- Perfect 15 Mins Closure .
6- Reversal Pattern .
17/9/68 : XAUUSD ( Europe / London Session )Using it from Europe Session until 7.00PM , I'll new analysis and update at 8.00PM
Resistance
3703-3708
3691-3697
3686
Support
3676
3665-3670
3654-3660

Elliott Wave Analysis XAUUSD – September 17, 2025
Momentum
• D1 timeframe: Momentum is currently rising. As of today, the upward move has lasted for 3–4 daily candles. Therefore, in the next 1–2 days, momentum is likely to enter the overbought zone.
• H4 timeframe: Momentum is in the oversold area and starting to reverse. Once confirmed, we can expect at least 4–5 bullish H4 candles.
• H1 timeframe: Momentum is already in the oversold zone and has turned upward, suggesting an immediate short-term rally.
Wave Structure
• D1 timeframe: Price is moving within black wave v. Since black wave iii was extended, black wave v is likely to be approximately equal in length to black wave i.
• H4 timeframe: Inside black wave v, we expect a 5-wave green structure to form. Currently, green wave 1 seems to have completed, and price is correcting within green wave 2.
• H1 timeframe: Within green wave 1, a 5-wave black structure has been completed. Price is now developing a corrective black ABC pattern.
Target zones for black wave C:
• Target 1: 3675
• Target 2: 3657
Note: Wave 2 usually retraces to the 0.618 Fibonacci level of wave 1, which coincides with the 3657 zone. This is the key level to consider for a buy setup.
Trading Plan
• Buy Zone: 3658 – 3655
• Stop Loss: 3645
• Take Profit (TP1): 3677
