Gold Bulls or Bears — Who Wins the Next Move on XAU/USD?🏴☠️ XAU/USD “Gold Heist Layer Plan” 💰🔑 (Day/Scalping Trade)
Dear Money Bandits & Thief OG’s, 🎭💎
The vault is open, and today’s Gold vs U.S Dollar (XAU/USD) robbery plan is set!
🎯 Thief Plan: Bullish
We rob the market with layered entries — not one bullet, but multiple shots at the vault.
👉 Thief Strategy = Layering 🎯 (multiple buy/sell limits stacked like laser traps).
Entry (Layered Loot):
💰 3370.0
💰 3360.0
💰 3350.0
(Add more layers based on your pocket size — the deeper you stack, the fatter the loot)
Stop Loss (Thief Exit Door):
🛑 @3320.0 (Adjust your SL with your own thief instincts & bankroll).
Target (Escape Point 🚓):
Police barricade spotted at 3440.0 🛑🚨
Our team escapes before that with bags full at 3430.0 🎒💸
🔐 Thief Notes:
This isn’t one single smash & grab. We layer the vault with limit orders — building positions slowly, stealing piece by piece.
Day traders & scalpers: only ride with the bullish getaway car 🚗💨.
Manage your loot with trailing SL — don’t let the cops take it back.
📢 Stay sharp, thieves:
Markets change fast. Keep eyes on fundamentals, news traps & sentiment shifts 📰⚡.
💎 If you vibe with this Thief Robbery Plan, smash that ❤️ & 🚀 Boost button — join the Thief Gang and let’s steal profits together, one layer at a time. 🏆💸
Xauusdidea

2/9/68 : XAUUSD ( Europe / London Session )Using it from Europe Session until 7.00PM , I'll new analysis and update at 8.00PM
Resistance
3519-3524
3509-3514
3503
Support
3491
3481-3486
3471-3476

Gold (XAU/USD) – 2 Sept 2025With spot gold anchored at $3493, today’s price action is unfolding within a well-defined technical framework. Institutional flows continue to dominate, and liquidity engineering in recent sessions has created precise execution zones. Below is the validated map of opportunity for the day, built upon a multi-timeframe confluence model.
🔹 Primary Buy Zone – $3472 to $3480
The most compelling area of interest sits between $3472 and $3480, an untouched 4H demand zone that aligns seamlessly with the Fibonacci golden pocket retracement of the prior bullish impulse. Liquidity was engineered below New York session lows, and this pocket now rests just above anchored VWAP support.
Stop Loss: $3466 (beneath order block invalidation)
Take Profits: 3493 / 3503 / 3513 / 3523 / Open trail
Zone Strength: 9/10 – Institutional Grade (Golden Zone)
This area represents today’s highest-probability setup. Should price hold above $3472, we anticipate continuation into $3520+ with strong order flow participation.
🔹 Secondary Buy Zone – $3450 to $3456
A deeper liquidity pocket exists around $3450–$3456, where Asia accumulation lows and equal-lows liquidity converge. This zone coincides with a 4H bullish order block and weekly anchored VWAP.
SL: $3442
TPs: same as above
Strength: 7/10 – Executable
This is a backup zone, valid only if the market aggressively hunts liquidity below the Golden Zone before resuming higher.
🔹 Primary Sell Zone – $3510 to $3518
On the upside, supply remains stacked at $3510–$3518, an unmitigated 4H supply block sitting above last week’s NY high. The zone also aligns with a 78.6% Fibonacci retracement and an ATR exhaustion band.
SL: $3525
TPs: 3500 / 3490 / 3480 / 3470 / Open
Strength: 8/10 – Strong Zone
If bulls overextend, this pocket offers a high-probability short back into mid-range liquidity.
🔹 Secondary Sell Zone – $3530 to $3538
A broader liquidity cluster rests higher at $3530–$3538, defined by a daily supply zone, weekly VAH/POC, and liquidity pools above equal highs at $3535. With speculative positioning heavily net-long in COT data, this area may serve as a distribution zone.
SL: $3544
TPs: same as Primary Sell Zone
Strength: 7/10 – Executable
⚜️ Executive Summary
Today’s Golden Zone is the Primary Buy Zone ($3472–$3480). With multi-timeframe demand, engineered liquidity sweeps, VWAP confluence, and Fibonacci overlap, this zone stands out as an institutional-grade opportunity (9/10).
Execution should remain patient and disciplined: wait for price to tap the Golden Zone, confirm via BOS/CHoCH on lower timeframes, and then scale profits progressively at each 100-pip interval.
In short: $3472–$3480 defines today’s battleground. If defended, bulls control toward $3520+. If breached, deeper liquidity hunts await at $3450 and $3530.

GOLD M15 DIRECTION Hello Welcome Back 🙏
Gold Selling Area > 3485
Reason > Strong Resistance & CRH Strategy
Gold Buying Area > 3354, 3345
Reason > Bullish FVG , CISD Strategy
Hope You Got It , Dont Forget To Follow Us And Boost The Post

GOLD UPDATE After hitting the target for the buy position , I will sell from the price of 3478 to target the price of 3448, which is a sell position with the presence of a pin bar on the hour, which is a RRR 1:1 because it is against the market trend .
Good Luck

1/9/68 : XAUUSD ( US. Session )Using it from US Session until 11.00AM , I'll new analysis and update at 12.00PM
Resistance
3491-3496
3481-3486
3475
Support
3465
3454-3459
3444-3449

Gold Trade Set Up Sep 1 2025OANDA:XAUUSD
www.tradingview.com
Price has been a strong bullish trend making HH/HL and respected a 4h FVG so the target is HH or BSL which is also all time highs

1:2 RR Trade on gold NOW📊 Gold Trade Idea – 1:2 Risk-to-Reward Setup
You're eyeing a clean 1:2 RR trade on gold (XAU/USD), likely based on a high-probability setup. Here's a crisp breakdown for your TradingView post:
🟡 Trade Setup Summary
- Entry Zone: Near recent support or breakout level
- Stop Loss: Tight, just below structure or key moving average
- Target: 2x the risk, aligned with resistance or Fibonacci extension
- Bias: Momentum favors bullish continuation (or reversal, if countertrend)
- Confirmation: Price action + volume spike or indicator confluence (e.g., RSI, MACD)
💬 "Executing a disciplined 1:2 RR trade on gold. Clean structure, tight risk, and clear target. Let’s see how it plays out."

XAUUSD ideaWe are waiting for our asset to reach our action zone, and based on the reaction, we’ll decide on our next moves.ALWAYS WAIT FOR A CONFIRMATION TO SEE IF THE PRICE VALIDATES THE ZONE.and you what is your vision of the EURUSD its interests me! i wait you in the commentar
Gold (XAU/USD) 1st September 2025🔎 Market Context
Gold continues to trade within a high-liquidity environment, driven by ongoing flows between equity risk sentiment, real yields, and dollar positioning. With the $3500 psychological level acting as a liquidity magnet above, and demand clusters building in the $3440 region, today’s structure offers both sides of opportunity.
Our institutional framework layers multiple confluences across Daily → 4H → 1H, blending Smart Money Concepts (SMC), ICT, supply/demand, VWAP, and Fibonacci arrays. This ensures only the highest-probability zones are highlighted for execution.
🟢 Buy-Side Liquidity Zones
Primary Buy Zone – $3438 to $3446 (Golden Zone)
Why This Matters:
Daily demand + fresh 4H Order Block.
NY session low sweep + Asia accumulation base.
Fibonacci 61.8% retracement cluster.
Hidden RSI bullish divergence + anchored VWAP support.
Execution Plan:
Entry: $3440 – $3444
SL: $3432
TP1: $3476
TP2: $3490
Strength Score: 9/10 (A+ Institutional)
Secondary Buy Zone – $3410 to $3418
Why This Matters:
Deep daily demand retest.
Weekly VWAP lower band + 78.6% retracement.
Sweep of last week’s low + $3415 round magnet.
Execution Plan:
Entry: $3412 – $3416
SL: $3402
TP1: $3442
TP2: $3470
Strength Score: 6/10 (Medium Zone)
🔴 Sell-Side Liquidity Zones
Primary Sell Zone – $3488 to $3496
Why This Matters:
4H supply aligned with 1H bearish OB.
Daily swing high liquidity resting at $3492.
Volume Profile POC + $3490 magnet.
Overbought RSI with bearish divergence on 1H.
Execution Plan:
Entry: $3490 – $3494
SL: $3504
TP1: $3460
TP2: $3446
Strength Score: 8/10 (Strong Zone)
Secondary Sell Zone – $3518 to $3526
Why This Matters:
Higher-timeframe supply continuation.
Liquidity sweep of quarterly highs near $3520.
Options expiry gamma cluster in $3520s.
Execution Plan:
Entry: $3520 – $3524
SL: $3532
TP1: $3490
TP2: $3465
Strength Score: 5/10 (Medium Zone)
🏆 Golden Zone of the Day
👉 Primary Buy Zone ($3438 – $3446)
Best alignment across institutional confluences.
High conviction zone with clear liquidity sweep and macro alignment.
Execution favors long positioning with SL $3432 | TP1 $3476 | TP2 $3490.
📌 Final Bias
Longs favored on dips into $3440 Golden Zone.
Sells only valid if liquidity sweeps extend into $3490/$3520 zones.
Maintain disciplined risk with tight stops below liquidity pockets.

1/9/68 : XAUUSD ( Europe / London Session )Using it from Europe Session until 7.00PM , I'll new analysis and update at 8.00PM
Resistance
3495-3500
3485-3490
3480
Support
3470
3460-3465
3449-3454

Go long after gold fluctuates and pulls back#XAUUSD
Against the backdrop of the "de-dollarization" trend, gold's position as the preferred safe-haven asset has gradually become more prominent.🌈
Influenced again by news this morning, gold retreated slightly before continuing its short-term bullish trend.📈 The current gold price is consolidating around 3375, with bulls dominating the day.📊
All short-term technical indicators are overbought, and there is a need for a technical correction. The short-term upward pressure is focused on the 3490-3500 range.🥅 However, it is worth noting that the U.S. market is closed today and there is a lack of sufficient capital flow during the NY session. ⚖️If the upper resistance cannot be effectively broken through in the Asian and European sessions, there is a possibility of a shock correction during the day.📉
It encountered resistance and pressure on the upper 3490-3500 level for the first time during the day. 📉You can consider shorting with a light position and wait for a pullback.🐻 Focus on the effectiveness of the support level of 3355-3345 below. You can go long if it retraces but does not break through.🐂
This week's data is relatively concentrated, and interest rate cuts may trigger unilateral market trends at any time. Independent traders must trade with caution, strictly follow the plan, and avoid the uncontrollable risks brought about by frequent trading.📰

Elliott Wave Analysis – XAUUSD (01/09/2025)
Momentum
• D1 timeframe: Momentum has been stuck in the overbought zone for the past 4 days, showing strong buying pressure. However, this also creates noise since extended overbought conditions can reverse at any time.
• H4 timeframe: Momentum is about to turn down in the overbought zone. Once an H4 candle closes with confirmation, we can expect a correction lasting around 4–5 H4 candles.
• H1 timeframe: Momentum is heading into the overbought zone. Within 1–2 more H1 candles, a short-term pullback is likely.
________________________________________
Wave Structure
• D1 timeframe:
Price has risen sharply and steeply, with momentum staying overbought for a long time. This suggests that wave 4 has likely completed, and the market is entering a long-term uptrend. The minimum target is 3684 (equal to the length of wave W).
• H4 timeframe:
Price is currently in red wave 3. We expect a correction into red wave 4, which aligns with H4 momentum preparing to turn down.
• H1 timeframe:
o Wave i (green) is labeled as a leading diagonal, even though wave ii (green) did not retrace as deeply as expected.
o Price is now in an extended wave iii (green).
o Within wave iii (green), a 5-wave structure 1-2-3-4-5 (red) is unfolding. Red wave 3 has already completed with its internal 5-wave (black).
o The target for black wave 5 was achieved at the Fibonacci 0.618 projection of black waves 1–3 → confirming that red wave 3 has completed and price is now correcting into red wave 4.
• Red wave 4 outlook:
Likely to take shape as a zigzag, flat, or triangle. Two retracement zones are identified:
1. 3462 – 23.6% retracement of red wave 3.
2. 3447 – 38.2% retracement of red wave 3.
Considering the guideline that wave 4 often returns to the territory of wave 4 of a smaller degree, and that H4 momentum needs more time to move into the oversold zone, we select 3447 as the primary target for a sell setup.
________________________________________
Trade Plan
• Buy Zone: 3448 – 3446
• Stop Loss: 3438
• Take Profit:
o TP1: 3485
o TP2: 3521

𝐌𝐓𝐗 | Buy-Side Sweet Spot in Gold’s Correction📌 From previous analysis:
• We anticipated corrective pullbacks and highlighted reversal zones.
• Focus was on 436–432 as the first critical support/resistance area.
⸻
1️⃣ Key Reversal Levels
There’s two scenarios in this rally:
A)
• 436 – 432 → First potential bullish reversal zone.
• 4H close above 435 → upside continuation toward 442 → 447 → 452.
B)
• 4H close below 432 → decline into 420.
• 420 – 415 is the strongest weekly demand zone (high-probability bullish bounce).
⸻
2️⃣ Continues Bullish Scenario
• 4H close above 454 → opens the way to 467.
• Stabilization above 467 → next major upside target 484.
✴️Plus Tip:
Daily closes above 420-415 zone supports the bullish momentum.
⸻
⚖️ Summary:
Gold is starting the month at a decisive zone (436–432). Holding above 435 favors further upside toward 452, while losing 432 puts the strong 420–415 demand zone into play. A confirmed breakout above 454 could accelerate the rally toward 484.

Gold (XAU/USD) – 4H AnalysisGold (XAU/USD) – 4H Analysis
🔹 Key Structure
If price respects the white line at point c, a potential Head & Shoulders formation may develop, signaling a possible bearish reversal.
However, if the orange dynamic line acts as a liquidity-driven trendline, then price could follow the red projection, pushing the market higher toward ATH (All-Time High) levels.
---
🔹 Break of Descending Trendline
On Friday, the descending resistance line was broken to the upside.
This break could be interpreted as a fake breakout if the market fails to hold above it.
For confirmation of a true breakout, we need to see continuation and acceptance above the broken trendline.
---
🔹 Bearish Scenario (Head & Shoulders Valid)
If the c-leg completes and rejects the white line:
Expect a Head & Shoulders pattern.
Price may retrace toward 3,360 → 3,344.
A close below 3,344 would strengthen bearish continuation.
---
🔹 Bullish Scenario (Liquidity Trendline Active)
If the orange liquidity trendline holds, buyers may push price higher.
Breaking above 3,420 – 3,446 with strength could target ATH extension zone above 3,500.
---
🔹 Trading Plan
Wait for confirmation: Avoid premature entries as current breakout might be fake.
Bearish bias: Valid if rejection occurs at point c with H&S pattern confirmation.
Bullish bias: Valid if orange line holds as liquidity dynamic and price sustains above 3,420.
---
✅ Bias: Neutral → Waiting for confirmation (H&S vs Liquidity Push)
🎯 Key Levels: 3,344 (bearish confirmation) / 3,420–3,446 (bullish breakout)
❌ Invalidation: Strong close above ATH zone

Gold bullish surge With weekly high pierced I'm looking to take a buy around 3423.5 - 3430 area where there is previous support, I should be targeting 3467.03 area. i will not jump on the shorting band wagon, will observe price action and will take it from there. but initial bias is long
But if the price does not respect my buy area, I have another zone to take a long from, the area is 3414.871 - 3420 respectively. The market does whatever it wants so let's observe and be patient.

GOLD XAUUSD - Pullback Expected before the Next Leg UpGold (XAUUSD) has been on a solid bullish run, consistently pushing higher after each minor retracement. Now, we’re eyeing a potential pullback toward a key support zone at 3420–3400, where buying interest is likely to resurface.
If price action confirms a bounce from this zone, we could see a continuation of the uptrend toward 3450, and if momentum holds, possibly stretching to 3490–3500.
🔻 Trade Setup – Long Opportunity on Pullback
Entry: Buy Gold (XAUUSD) at 3420
Add-on Dip: 3400
Targets: 3450, then 3490–3500 (marked on chart)
Invalidation: Daily close below 3385
📌 Risk/Reward Outlook
This setup presents a tight risk with attractive upside potential. As always, stick to solid risk management and size your positions based on your personal trading plan.
👍 Agree with this view?
Drop a like, leave your comments, and let’s discuss this setup together!
Your feedback keeps the community sharp and growing. 🔥
Happy Trading,
– The InvestPro Team

XAU/USD – Bullish Breakout: Buy Dips Toward $3,409 Target📊 XAU/USD (Gold) – 2H Analysis
Gold has just broken out of its descending channel, showing a clear change of character (CHOH) around the $3,348–$3,358 support zone. This breakout suggests bullish momentum is taking control after weeks of compression.
Key Observations:
✅ Support Zone: $3,348–$3,358 is now a strong demand zone (previous rejection area flipped to support).
✅ Moving Averages: Price is above both the EMA 70 ($3,342) and EMA 200 ($3,346), strengthening the bullish bias.
✅ Projection: A potential continuation rally toward $3,409 (major liquidity target).
⚠️ Risk: If the support zone fails, price could re-test $3,334 or even $3,326.
Trading Plan (Short-Term):
Entry (Buy): Around $3,358–$3,348 (support retest).
Stop Loss: Below $3,342 (under EMAs).
Target 1: $3,390
Target 2: $3,409
👉 In summary: Gold is in a bullish reversal phase, and buying dips into the support zone offers the best risk-reward setup.

XAUUSD Weekly Outlook – Bullish Breakout or Healthy Pullback?OANDA:XAUUSD continues to trade within a strong long-term bullish channel, currently hovering around $3,450. Price action is compressing between the ascending green channel and the red resistance trendline, suggesting that a decisive move is near. The weekly close will be the main trigger to validate one of two scenarios.
🔶 Scenario 1 – Bullish Breakout
If gold secures a weekly close above the red resistance line, bullish momentum is likely to continue with buyers regaining control. This would confirm a breakout from consolidation and align with the broader bullish trend.
First upside target: $3,600 – $3,650 (upper channel resistance)
Next extension target: $3,750 – $3,800, if momentum remains strong and buyers sustain pressure
This scenario would confirm the continuation of the strong uptrend that started in 2023.
🔶 Scenario 2 – Rejection & Correction
If next week’s candle closes below the red resistance line, then rejection is confirmed and a corrective phase becomes more probable. This would signal that sellers are still defending the resistance zone and gold may retrace toward lower support levels.
First downside target: $3,320 – $3,305 (major horizontal + EMA support)
Deeper correction zone: $3,160 – $3,100 (aligned with EMA cluster and channel midline)
Extreme support: $3,025 if bearish pressure accelerates
This would represent a healthy correction within the long-term bullish structure, offering potential re-entry zones for swing traders.
The weekly close is critical. A confirmed breakout above resistance will likely push gold into new highs, while a rejection sets up a pullback toward deeper support levels.
Which scenario will play out ? 1 or 2 ? Let me know with a comment !

From Rally to Reversal: Gold Near PRZ, Bears Prepare!As I expected in the previous idea , Gold started to rise with the help of Powell's words and reached my targets(Full Target) .
Gold is currently entering the Potential Reversal Zone(PRZ) and is also moving near the Resistance zone($3,451-$3,406) and Resistance line .
In terms of Elliott Wave theory , Gold appears to be completing microwave 5 of the main wave C . The wave structure is a Zigzag Correction(ABC/5-3-5) .
I expect Gold to drop to at least $3,363 after entering the Potential Reversal Zone(PRZ) .
Second Target: $3,351
Third Target: Support lines
Note: Stop Loss (SL) = $3,416(Worst)
Gold Analyze (XAUUSD), 2-hour time frame.
Be sure to follow the updated ideas.
Do not forget to put a Stop loss for your positions (For every position you want to open).
Please follow your strategy; this is just my idea, and I will gladly see your ideas in this post.
Please do not forget the ✅ ' like ' ✅ button 🙏😊 & Share it with your friends; thanks, and Trade safe.

Gold Trade Set UpOANDA:XAUUSD
www.tradingview.com
Price has been making HH/HL so im overall bullish above this 15m high. I want to see a close above, and retest to target PDH/HH

XAUUSD – 1H | OB / CCH map Green = Buy OB, Red = Sell OB. Current price ~ 3410.7.
Key zones I’m tracking:
CCH / 1H supply: 3415–3422
HTF HIGH supply: 3435–3448
1H OB (near): 3382–3372
1H OB (deeper): 3334–3320
Scenario 1 – Rejection from supply (sell):
If price sweeps into 3415–3422 (CCH) or pushes into 3435–3448 (HTF HIGH) and 3–5m closes fall back below 3420, I’ll look for shorts targeting 3382–3372 first, then the 3334–3320 OB. Invalidation for the idea is sustained acceptance above 3450.
Scenario 2 – Mitigation then continuation (buy):
If price pulls back to 3382–3372 (1H OB) and prints a bullish shift (3–5m BOS/CHoCH), I’ll look for buys back to 3415/3422, and, if accepted above 3420, continuation into 3435–3448. If the first OB fails, the next buy zone is 3334–3320 (reaction-only with confirmation).
Execution: entries on 3–5m, always require a clear shift; no blind orders.

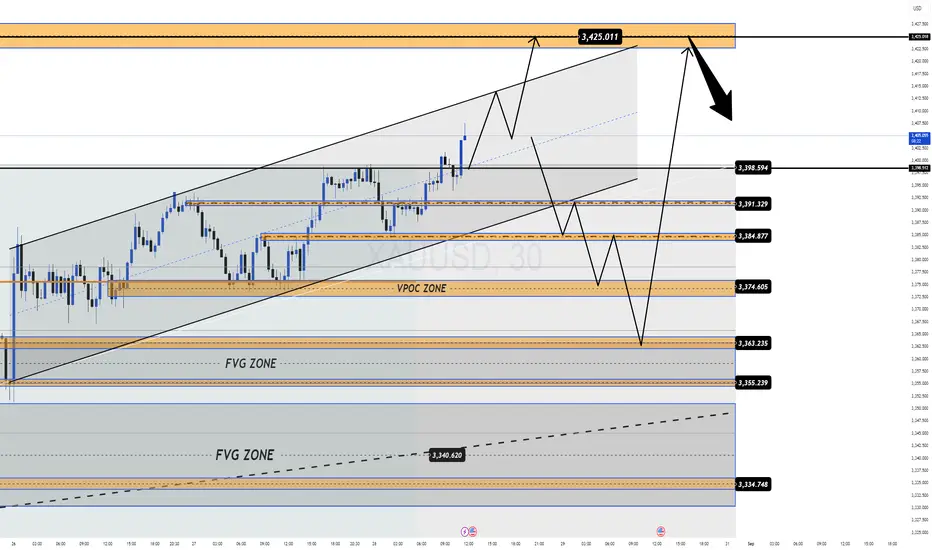
XAU/USD — All Eyes on US Data, Gold Ready for a Big Move!
Gold continues to hold strong buying pressure despite the recovery of the USD (DXY). The market is now waiting for today’s key US economic releases during the New York session:
📊 USD Prelim GDP q/q → Forecast: 3.1% (Prev. 3.0%)
📊 USD Unemployment Claims → Forecast: 231K (Prev. 235K)
🔎 Possible Scenarios
1️⃣ If US data comes out strong → Gold could break down from the rising channel, targeting the VPOC 3374, and with heavier pressure even dip towards the 335x zone (though this might be harder to achieve).
2️⃣ If US data is weak / neutral → Gold is likely to continue its bullish leg, aiming at 3392 – 3398 and potentially extending to 342x – 343x to retest the previous ATH.
📌 Key Levels to Watch
Resistance: 3398 – 3400 → breakout could fuel a quick rally into 342x – 343x
Support: 3374 → break below opens room to 335x
Buy Zone: Watching for a sharp dip into 335x – 337x for clean long setups
🎯 MMFLOW Strategy
👉 Priority remains: wait for a liquidity grab / sharp dip to BUY in line with the broader trend.
👉 Be cautious — with this being the main economic release of the week, volatility can spike aggressively when the numbers hit.
🔥 What do you think?
Will Gold break higher into new ATHs, or will we see a liquidity sweep first before the next leg up?
💬 Share your view in the comments — let’s trade smart together!