Gold: Yesterday’s Surge & Today’s Session StrategyDuring yesterday’s U.S. trading session, gold surged to around 3390 🚀, driven by a series of tariff-related remarks from Trump, Fed personnel changes, and market expectations that the probability of a September rate cut has risen to 91% ⚡️. We successfully took profit near 3355 yesterday, locking in close to maximum gains 💰.
Today’s trading strategy:
Go short at highs during the Asian session 📉
Go long at lows during the European session 📈
Go short at highs again during the U.S. session 📉
⚡️⚡️⚡️ XAUUSD ⚡️⚡️⚡️
🚀 Sell@ 3390 - 3380
🚀 TP 3375 - 3366 - 3356
Daily updates bring you precise trading signals 📊 When you hit a snag in trading, these signals stand as your trustworthy compass 🧭 Don’t hesitate to take a look—sincerely hoping they’ll be a huge help to you 🌟 👇
Xauusdidea
Elliott Wave Analysis – XAUUSD August 6, 2025📊
________________________________________
🔍 Momentum Analysis
• D1 Timeframe:
Daily momentum is showing signs of a potential bearish reversal. However, we need to wait for today’s candle to close to confirm the signal. While waiting for confirmation, price may still experience a minor upward move on lower timeframes, but the current bullish momentum is weak and unlikely to extend far.
• H4 Timeframe:
Momentum is also preparing to reverse. We need to observe the current H4 candle for confirmation. Notably, the reversal signal is forming just below the overbought zone, suggesting there may be one more upward push before a potential decline.
• H1 Timeframe:
Momentum is approaching the oversold zone. It may take 1–2 more bearish candles before a short-term bullish rebound occurs.
________________________________________
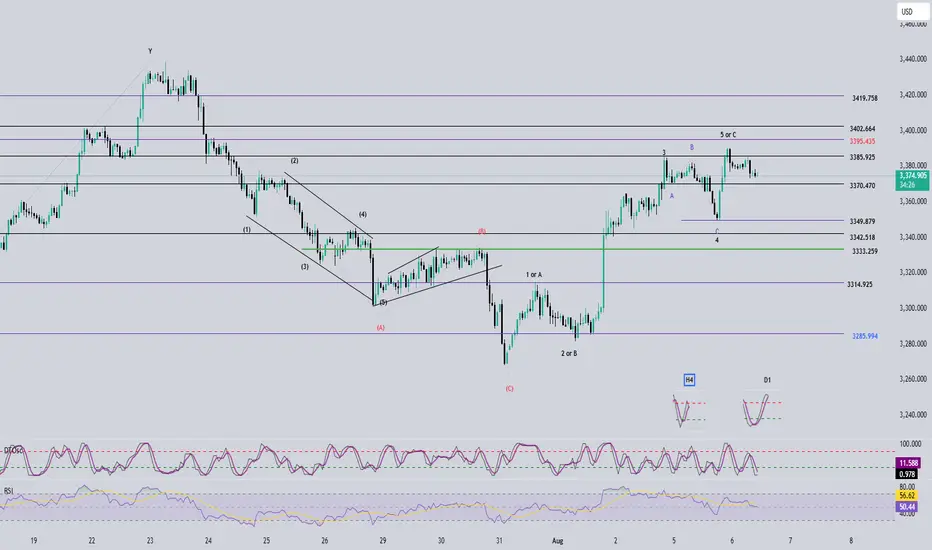
🌀 Elliott Wave Structure Update
Yesterday’s bullish move was disappointing — instead of pushing directly to the 3402 or 3419 target zones to complete Wave 5, price only broke slightly above 3385 before reversing. This behavior complicates wave analysis by introducing conflicting possibilities.
We currently consider two main scenarios:
Scenario 1: Wave 5 is not yet complete
• Given that D1 momentum is preparing to reverse downward, it’s unlikely that the current move is Wave 1 of Wave 5. A more likely scenario is that Wave 3 of Wave 5 has completed and price is currently in Wave 4.
• The current corrective structure has stopped at the 0.382 Fibonacci level. As long as price remains above 3370 (the 0.5 Fib level), this strengthens the case for a Wave 4 retracement before another leg up in Wave 5.
• Since bullish strength appears limited, we now focus on two main target zones for Wave 5: 3395 and 3402, instead of the previous high at 3419.
Scenario 2: Full 5-wave structure is complete – now in correction
• If the 5-wave pattern has already finished, the current decline marks the beginning of a corrective phase.
• With current momentum conditions, this is still a viable scenario. However, due to the remaining upside possibility, we recommend waiting for today’s D1 candle to confirm momentum before taking any trade.
________________________________________
📌 Trade Plan
For experienced traders:
• Wait for price to reach the 3395–3402 zones.
• Look for reversal signals in those areas to enter short positions.
Suggested trade plan for newer traders:
• Sell Zone: 3395 – 3398
• Stop Loss: 3408
• Take Profits:
o TP1: 3385
o TP2: 3370
o TP3: 3349
________________________________________
✅ Note:
This trade plan should be reassessed after today’s D1 candle closes for confirmation of the momentum shift.
8/6: Watch for a Potential Double Top FormationGood morning, everyone!
Yesterday, gold experienced its first significant supply pressure around the 3386 level, but with support near 3350—helped by positive data—prices rebounded and climbed back toward 3390, resulting in solid overall gains.
From the 1-day chart (1D) perspective, the technical structure remains bullish, with MA20 providing firm support. Although short-term moving averages are currently converging, the overall bias remains towards a bullish divergence, suggesting further upside potential. There's a possibility for price to test the 3400–3420 zone in today’s session.
That said, the 3386–3398 region may still pose minor selling pressure, although it is not expected to be particularly strong. Key intraday support is seen in the 3378/3372–3362 range. If the market encounters another wave of heavy selling that damages the daily bullish setup, then the 3343–3348 area will become a critical battleground between bulls and bears.
📌 Trading Strategy for Today:
Maintain a sell-on-strength approach, especially if prices approach the 3418–3438 resistance area, where short opportunities become more attractive;
If a pullback occurs, monitor the aforementioned support zones for potential buy-on-dip opportunities, contingent on stability.
⚠️ Market Risk Reminder:
There will be key economic speeches during the US session, which could trigger heightened volatility. Ensure proper risk management and stop-loss settings are in place.

gold on sell#XAUUSD price third range have been broken, now we wait for reverse below 3355.
Sell from 3375-3373 on H1 closure, target 3355, SL 3384
If price touch 3371 and reverse back close, bullish range between.

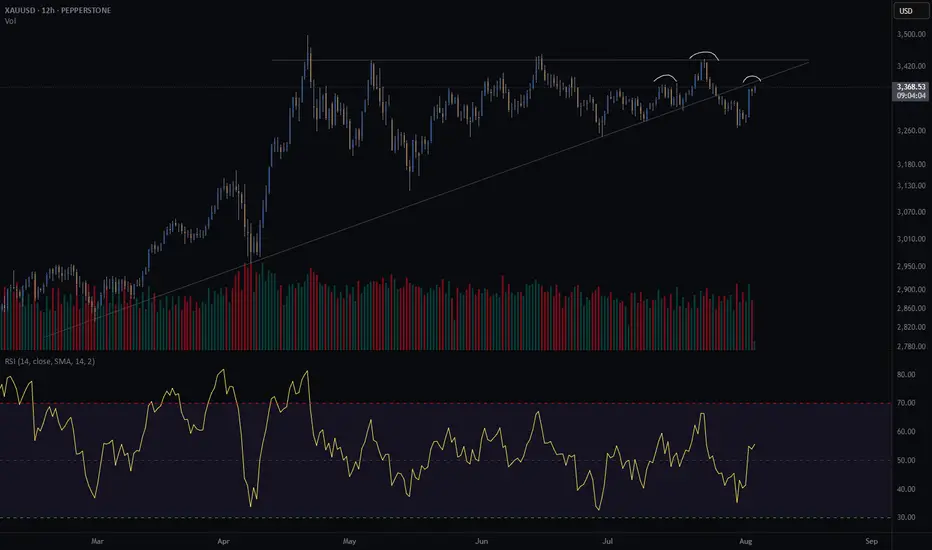
XAUUSD The beginning of large-scale growthCurrent picture and structure
The instrument is trading in a narrow range of $3,360-3,375, demonstrating low volatility - ADX is at the low of 2025, which confirms consolidation
The price is held inside a long-term ascending channel, with an increase of about 27% since the beginning of 2024
Indicators and signals
RSI (14): around 58-59, indicates moderate overbought, but remains in the bullish momentum zone
Stochastic (%K ~61%) and MACD (value ~3.8): Buy signals - short-term upward momentum is confirmed
ADX (14): around 23-24 - range, weak trend without a clear direction
Moving averages on different timeframes give a common signal indicator "Strong Buy" in daily and weekly frames
Support and resistance levels
Key support:
$3,360 — current lower stop range
$3,330–3,293 — swing low zone, critical for short-term sales
Main resistance:
$3,400–3,415 — profit acceptance zone and possible reversal pressure
$3,450 — psychological and technical barrier upon breakout of current zone
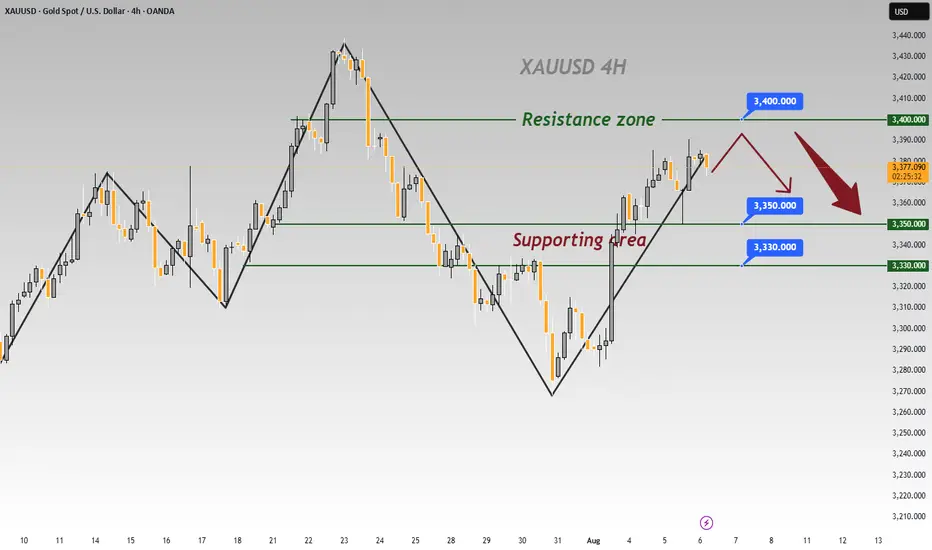
Gold crash (SHORT) - head and shouldersGold is at an interesting crossroad.
It broke through its diagonal support on Friday the 25th of July.
Price is retesting previous support. Does it turn into resistance?
Further confluence is a head and shoulders of the H8 and H12, with the right shoulder coinciding with the retest of the diagonal.
Since I am long gold with my investments, I am hesitant to short gold through my trading business. However, if my pattern is available, I take the trade. This will be a very short term trade - a few days at most if the trade goes in my favour.
Risk/reward = 12.6
Entry price = 3382.5
Stop loss price = 3396.2
Take profit level 1 (50%) = 3230
Take profit level 2 (50%) = 3181
The risk reward is exceptionally high. However, I have taken a more conservative approach with my entry because of my apprehension to short gold. For this trade I will enter at the extreme end of the range in which I will look for entries. This is the reason for such a high RR. It might result in me missing an entry.
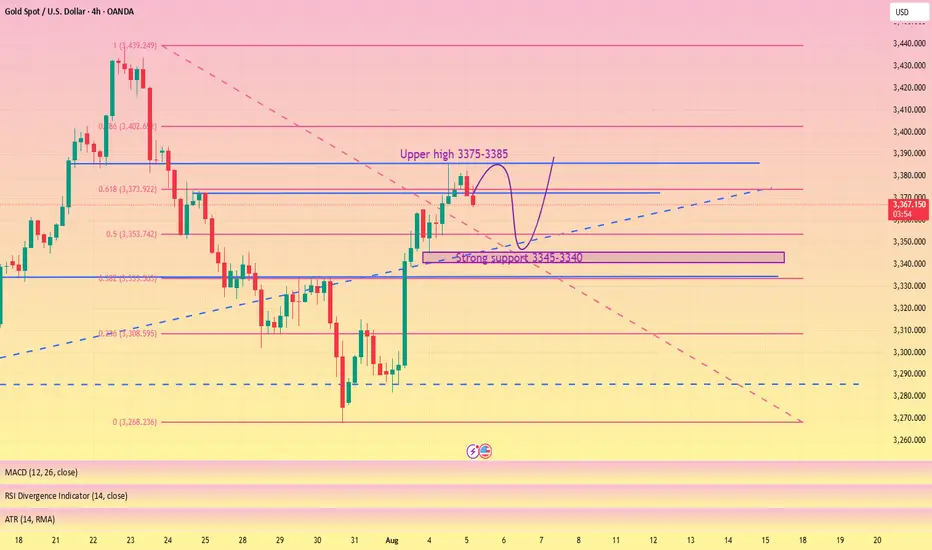
Wait for a pullback and then test the previous high#XAUUSD
The gold market closed positively on the daily chart, with strong support near 3345-3340 below. The market trend is still dominated by bulls,🐂 but the daily moving average support is too far from the high point. It is not ruled out that it may retreat to the moving average support near 3345-3340,📊 and then rise again.🚀
From the monthly chart, 🌙although the monthly chart closed positive, the market is generally converging at a high level. Upper resistance remains, and a breakout is unlikely without breaking through this resistance level (no further discussion will be given).📉
Judging from the weekly chart, the Bollinger Bands have shrunk, and the MACD indicator has formed a death cross with large volume, indicating weak fluctuations at the weekly level.😩
Judging from the daily chart, 📊the current technical indicators are tending to the zero axis, and the rapid upward correction of the smart indicator indicates that the price fluctuation tends to rebound. The current focus is on yesterday's high around 3385. It is expected to break through 3430. The lower support Bollinger band middle track and moving average tend to stick together around 3346-3340.🌈
Judging from the hourly chart and 4H chart, 📊the overall rhythm tends to fluctuate and fall. The short-term pressure from above is around 3375-3385, and a break above will definitely lead to an increase.📈
On the whole, pay attention to yesterday's NY starting point near 3365-3360, and the strong support below is 3346-3340. The hourly and 4H charts tend to fluctuate and fall, so for short-term trading we need to short on rallies. 📉
Intraday trading suggestions are as follows:
1. Consider going long currently around 3365-3360📈, targeting 3374-3380🎯. If it breaks through, look for 3400.
2. Go long if it retraces below 3355-3340, targeting 3375-3385. Wait for further adjustments.🐂
3. If the price first reaches the resistance level of 3375-3385 and holds, consider going short with a small position and anticipate a pullback towards 3365-3355.🐻
GOLD Breakout Done , Long Setup Valid To Get 150 Pips !Here is My 15 Mins Gold Chart , and here is my opinion , we finally above 3350.00 and we have a 30 Mins Candle closure above it And Perfect Breakout , so i`m waiting the price to go back and retest this res and new support and give me a good bullish price action to can enter a buy trade and we can targeting 100 to 150 pips .
Reasons To Enter :
1- New Support Created .
2- Bullish Price Action .
3- Bigger T.F Giving Good Bullish P.A .
4- Clean Breakout .

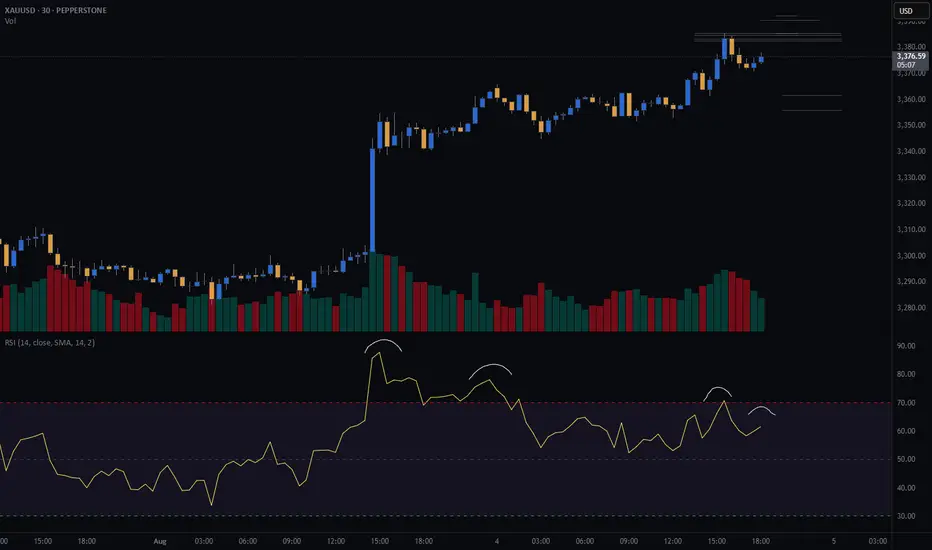
GOLD (XAU) SHORT - Double top 30minRisk/reward = 2.8
Entry price = 3382.5
Stop loss price = 3390.5
Take profit level 1 (50%) = 3361.7
Take profit level 2 (50%) = 3356
I am considering a short on gold.
Still need some variables to fall into place before I enter the trade.
There is nice RSI negative divergence showing declining momentum.
Further confluence:
- Potential head and shoulders on higher time frame
- At area of previous diagonal support which could be turned into resistance if the 30min double top plays out
Next movement is so critical The next movement of the gold will make the last decision , 1h fram above the 3352 will make the next target 3360/3380/3400
Be careful and chill !
Breaking the 3348 may see rejection on 3344 3340 as said in the morning ! Will follow up with it

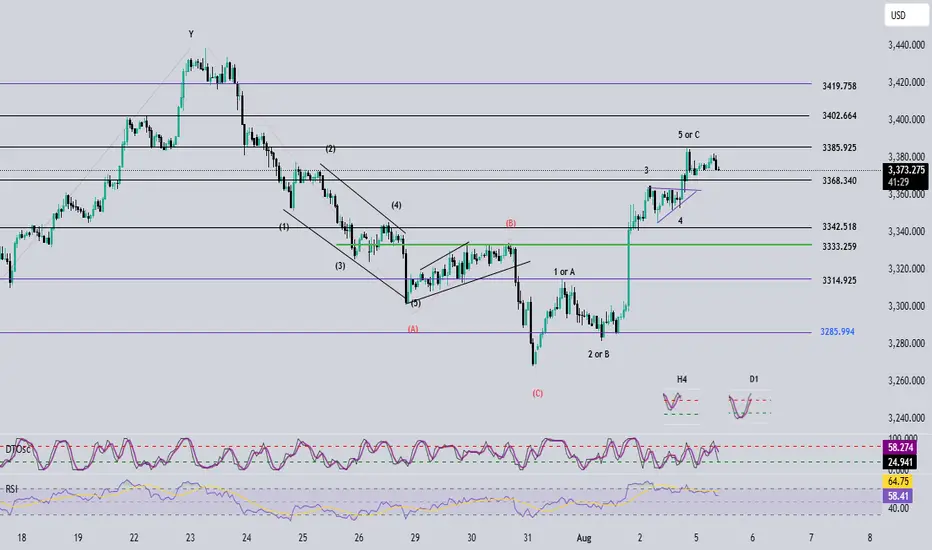
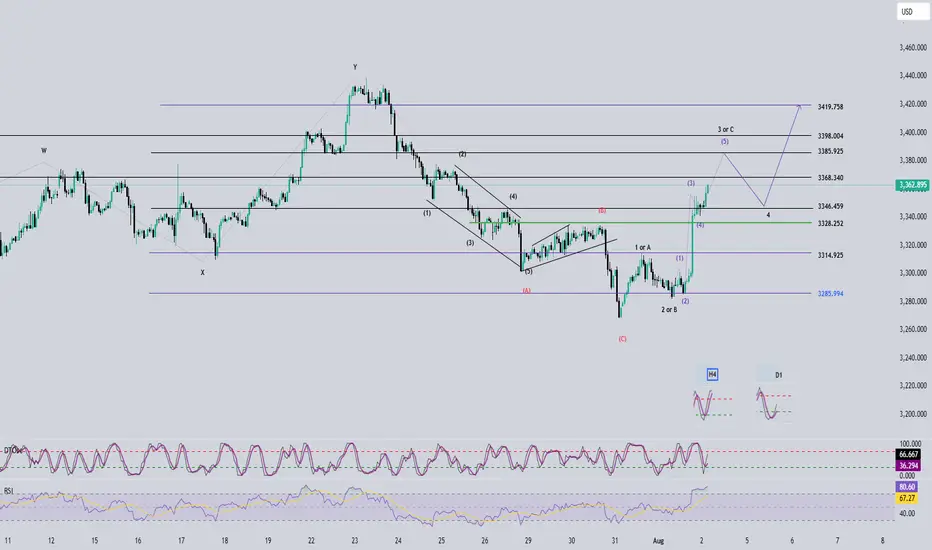
Elliott Wave Analysis – XAUUSD, August 5, 2025📊
________________________________________
🔍 Momentum Analysis:
• D1 Timeframe:
Momentum has entered the overbought zone. As anticipated in previous plans, we've seen four consecutive bullish days, and the current overbought condition signals that bullish momentum is weakening.
• H4 Timeframe:
Momentum is reversing downward → We expect a potential pullback today, at least until the US session.
• H1 Timeframe:
Momentum is also turning down → This supports the possibility of a short-term pullback on the H1 chart.
________________________________________
🌀 Wave Structure Analysis:
Currently, there are two key scenarios to consider:
✅ Scenario 1 – ABC Correction Structure (black labels):
• If this is a C wave completing an ABC correction, the current bullish move is likely over.
• In this case, price may break below the 3315 support zone, resuming the medium-term bearish trend.
✅ Scenario 2 – Impulse Wave 12345 (black labels):
• If this is wave 5 of a 5-wave impulse, the uptrend may not be complete yet.
• Currently, wave 5 has reached its first target at 3385, however, we must still watch for an extended target around 3402.
• Notably, wave 4 took the form of a triangle. According to Elliott Wave theory, when wave 4 is a triangle, wave 5 typically travels a distance equal to the triangle’s maximum height → This makes 3385 a highly probable peak area.
________________________________________
🧭 Trade Plan (Reference Only):
🔹 Sell Setup #1 – Near Potential Wave 5 Top:
• Sell Zone: 3375 – 3378
• Stop Loss: 3387
• TP1: 3365
• TP2: 3344
• TP3: 3333
🔹 Sell Setup #2 – In Case of Extended Wave 5:
• Sell Zone: 3400 – 3402
• Stop Loss: 3410
• TP1: 3385
• TP2: 3368
• TP3: 3333
Technical indicators are bullish across the boardInfluenced by the NFP data, gold prices rose strongly, fully recovering last week's losses. The current gold market has broken the previous bull-bear equilibrium and remains in a strong upward trend. We are currently bullish but will not chase the rise. We will wait for gold to fall back and stabilize before trying to go long. Gold is currently in a sideways consolidation. If gold touches the upper short-term resistance of 3365-3370 again in the European session and encounters resistance and pressure, you can consider shorting with a light position and waiting for a pullback. If the gold price breaks up strongly, pay attention to the key suppression level above 3375-3385.
As the price of gold continues to rise, the support has moved up. Pay attention to the short-term support of 3345-3330 below. If it retreats and stabilizes, you can consider going long. Independent traders must strictly implement trading plans, and those who are not sure about the market must set stop-loss orders.
OANDA:XAUUSD

8/5: Watch for Short Opportunities Near 3400Good morning, everyone!
On Wednesday, gold held above the key support area at 3343–3337, and subsequently broke through the 3372–3378 resistance zone, leading to a strong bullish move and solid long-side gains.
Today, attention should shift to the major resistance around 3400. If bullish momentum continues, price may approach the secondary resistance near 3420. However, from a technical perspective, signs of bearish divergence have begun to emerge. Should price continue rising while momentum weakens, the risk of a short-term correction increases accordingly.
Key levels to monitor:
Primary resistance zone: 3404–3416
Intermediate supply area: around 3398
Crucial support zone: 3372–3363 (a hold here could support further upside)
⚠️ Cautionary Note:
The US PMI data release during the New York session could introduce volatility. Be sure to maintain strict risk management and stop-loss discipline during periods of increased uncertainty.
🔁 Trading Bias for Today:
Prefer selling into strength near resistance, while cautiously considering buying on dips near support.
The 3343–3337 area continues to serve as the primary support zone, and price action around this level will be critical in determining the next directional move

XAUUSD Intraday Signal Analysis – Gold Price Momentum & RSI SetuIn today’s 1-hour chart of XAUUSD (Gold vs USD), we observe a strong upward momentum supported by technical indicators, suggesting a well-defined bullish trend in the short term. Traders looking to capture short-term profits may find this chart setup especially favorable. Here's a breakdown of the price action and what it could mean for intraday traders.
Price Action Overview
The price of gold has surged past the $3,320 mark, showing a clear bullish breakout with a series of higher highs and higher lows. Currently, the market is trading near the $3,378 level, consolidating slightly after a strong upward movement.
The SMA 9 (Simple Moving Average) is providing dynamic support, curving upward and closely hugging the candlesticks. This is typically a sign that buyers are actively pushing the price higher and dips are being bought up quickly.
Additionally, the spread between the Buy ($3,378.78) and Sell ($3,378.51) prices is extremely narrow, suggesting tight liquidity and fast execution potential — ideal conditions for scalpers and short-term traders.
RSI Analysis
The RSI (Relative Strength Index) 14 is hovering around the 68–70 level, which traditionally indicates the asset is approaching overbought territory. However, it hasn’t crossed into the 70+ danger zone yet, which implies there could still be room for further upside.
One key observation is the RSI divergence forming on the right-hand side. While price has been climbing steadily, RSI has started to curve down slightly — this could hint at a minor pullback or consolidation phase before the next big move. Smart traders may consider watching for bullish RSI bounces or hidden divergences before re-entering long trades.
Trade Idea
Trend: Bullish
Support: $3,360 / $3,340
Resistance: $3,400 / $3,420
Signal: Wait for a minor pullback toward the SMA, and look for bullish candlestick confirmation near $3,360 before entering long.
Conclusion
This XAUUSD 1H chart presents a strong case for continued bullish momentum with cautious optimism due to RSI nearing overbought levels. A pullback could offer fresh entry opportunities before a push toward the next resistance zone. Intraday traders and swing traders alike can benefit from closely monitoring price action around the SMA 9 line.

XAUUSD:BUYThere is no need to worry about holding long orders mentioned last Friday. Gold prices continued to rise this week after a pullback. The price has risen to 3372. According to the research team of our swing trading analysis team, the bullish trend will continue.
Earlier I informed members that some buy orders were closed at high levels. At that time, the short-term high was around 3370. After closing the long orders, the price subsequently fell. This is the advantage of swing trading. You can use accurate trading signals to trade in batches in the short term, thereby creating opportunities for quick profits.
After the pullback, there is still good room for buying and opportunities.

Maintain the bullish theme and go long on pullbacks#XAUUSD
Gold fell to a low of around 3345 during the day and then rebounded rapidly. It is currently repeatedly testing the 3355-3353 line.👨💻
Although Federal Reserve Chairman Powell has not given clear instructions, the market is generally optimistic about the September interest rate cut. 📈The bullish sentiment in the market still exists, and the moving average continues to spread upward, laying a solid foundation for market bulls🐂
If gold cannot effectively fall below 3355-3353 during the European session, then gold is expected to rise again during the NY session. First, if the gold price breaks through the intraday short-term high of 3365,🚀 the gold price may reach a rebound of 61.8%, which is around 3373. 🎯
If the European session hits the resistance level of 3365 and is rejected,🙅♂️ it may trigger a small pullback to 3345-3340 to provide long trading opportunities.🐂 Once it falls below 3340, 🐻it is necessary to stop loss in time and pay attention to the first-line defense situation of 3333

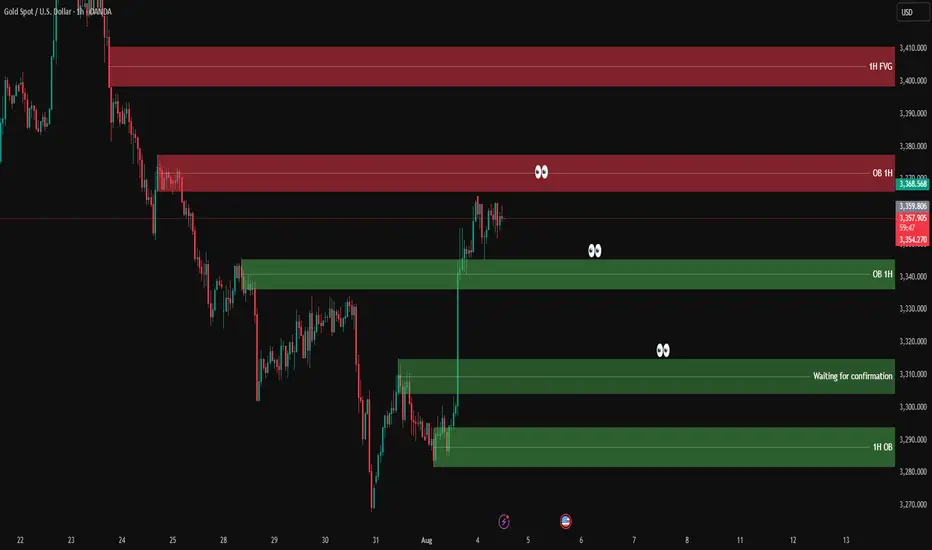
XAUUSD analysis - 1H FVG and OB setupsOn the 1H chart, price has made a sharp bullish move from the lower 1H OB zone (3,275 – 3,285) and is now hovering just below the 1H supply zone.
🔴 1H Supply Zone (OB):
3,354 – 3,368 → Price is consolidating here with no strong rejection yet.
🟢 1H Demand Zone (OB):
3,337 – 3,344 → First area to watch for potential bullish reaction.
👁 Mid-level support zone (waiting for confirmation):
3,310 – 3,320 → If price pulls back here and gives confirmation on lower timeframe, we’ll look for long setups.
📌 Trade scenarios:
1️⃣ Bullish: Wait for a retracement into 3,310 – 3,320, and if confirmed on LTF (3M–5M), go long.
2️⃣ If price drops deeper into the lower OB zone 3,275 – 3,285 and gives strong bullish reaction → potential long setup again.
3️⃣ Bearish: If price rejects the current OB zone (3,354 – 3,368) with confirmation → short entry targeting the green zones below (~3,320 or 3,310).
✅ Entry only after confirmation on lower timeframe
❌ No confirmation = no trade
Elliott Wave Analysis – XAUUSD, August 4, 2025📊
🔍 Momentum Analysis:
D1 Timeframe: Momentum continues to rise strongly. It's expected that the price will keep rising for at least two more trading days, pushing the momentum indicator into the overbought territory, reinforcing the current bullish trend.
H4 Timeframe: Momentum is showing signs of a potential bearish reversal, indicating a possible corrective pullback during Monday’s trading session.
H1 Timeframe: Momentum is strongly bullish, especially evident from the powerful upward move on Friday. Price may continue rising at the open of the Asian session, potentially creating a Gap. However, caution is advised, as this Gap could signal exhaustion.
📌 Wave Pattern Analysis:
Given Friday's strong price action, the primary scenario currently favors wave 3 within the 5-wave bullish structure (12345 – black). However, we cannot entirely eliminate the possibility that this is wave C within an ABC corrective structure (black).
Presently, the price is forming a smaller 5-wave bullish structure (blue), likely in the final wave 5. Attention should be paid to two critical target zones:
🎯 Blue Wave 5 Targets:
• Target 1: 3368
• Target 2: 3385
⚠️ Next Scenario:
Upon completing the blue 5-wave structure, a corrective move downward will occur.
• If the correction does not break below 3315, the larger 5-wave bullish structure (12345 – black) is confirmed, and the price will continue upward to complete black wave 5.
• If the correction breaks below 3315, the structure shifts to an ABC corrective pattern (black), increasing the likelihood of a deeper decline to complete the larger corrective wave C (red).
🧩 Combining Momentum & Wave Analysis:
• D1 momentum strongly supports the continuation of the bullish trend.
• H4 momentum forecasts a short-term bearish correction on Monday, aligning with the formation of wave 4 correction.
• H1 momentum suggests the possibility of a Gap at Monday's Asian session open, marking the beginning of a corrective pullback as momentum reverses.
🎯 Short-term Trading Plan:
We will trade the current blue wave 5 with the following limit order plan:
✅ Sell Limit Zone: 3385 – 3387
⛔️ Stop Loss (SL): 3399
🎯 Take Profit (TP1): 3368
🎯 Take Profit (TP2): 3355
📌 Note:
The detailed trading plan for capturing the larger wave 4 correction (black) will be updated once sufficient evidence confirms the completion of the blue wave 5.
Happy trading, everyone! 🚀
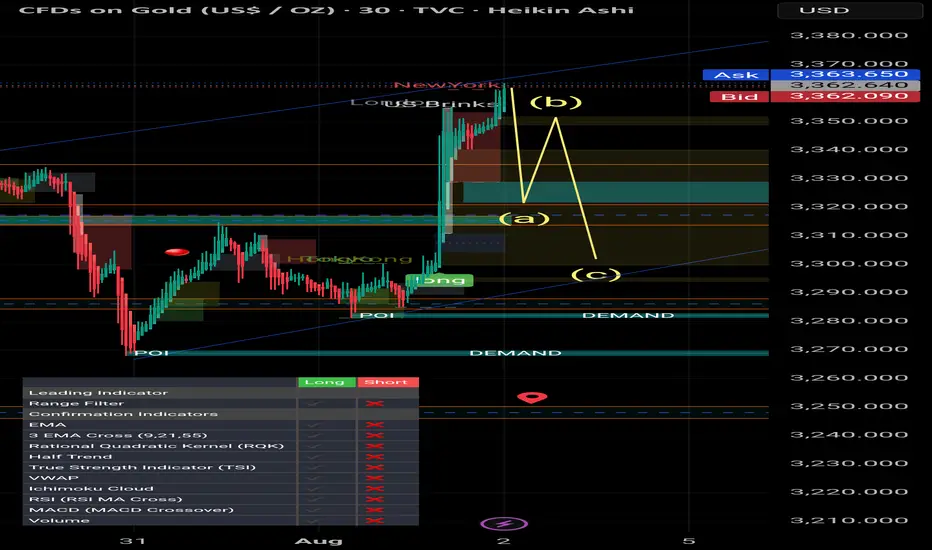
Smart Money / Price Action 5min scalping road map# 📈 ABC Pattern Explained for TradingView (Smart Money / Price Action)
The **ABC pattern** is a 3-leg corrective move in market structure, commonly used in price action, Elliott Wave, and Smart Money trading. It's mainly used to identify **pullbacks** or **correction zones** before a continuation of the main trend.
---
## 🔹 Structure of the ABC Pattern:
- **Point A**: The beginning of the move — often the end of a strong impulsive wave.
- **Point B**: The first retracement or pullback from Point A.
- **Point C**: The second corrective move that often goes beyond A, forming the completion of the correction phase.
The ABC legs can be:
- **A to B**: Impulsive or corrective.
- **B to C**: Generally a counter-trend retracement.
---
## 🔸 How to Identify on Chart:
1. **Find a strong trend** (uptrend or downtrend).
2. **Look for the first correction** — mark it as Point A to B.
3. **Next wave** that attempts to continue the trend but fails — mark the end as Point C.
4. **Use Fibonacci tools** to measure:
- **B retracement of A** (typically 50%–78.6%)
- **C extension** of AB (typically 127.2%–161.8%)
---
## 🔧 How to Draw on TradingView:
> You can use the `Trend-Based Fib Extension` tool or draw manually using the `Path` or `ABC pattern` tool.
### Step-by-Step:
1. Select the `ABC Pattern` tool from the **left toolbar** under “Prediction and Measurement Tools”.
2. Click on **Point A** (3320$).
3. Click on **Point B** (3350$).
4. Click on **Point C** (final corrective wave 3300$ ).
5. TradingView will automatically plot the shape with labels.
---
## 🧠 Pro Tips:
- Look for **liquidity sweep** or **order blocks** near Point C.
- Entry opportunity is often **after C**, targeting a **continuation** of the main trend.
- ABC is often part of **larger structures** like **complex pullbacks** or **smart money retracements**.
---
## ✅ Example Use:
- **Buy Scenario**:
- Strong uptrend → Price drops from A to B (retracement).
- Then price rises to C, failing to break above A → Possible new higher low formed.
- Enter long if price breaks above Point B again.
- **Sell Scenario**:
- Strong downtrend → A to B is a pullback.
- C attempts new high, fails → short entry after break of B.
---
## 📌 Settings Tip for Mobile Users:
- Zoom in for better point control.
- Use “Lock” feature to prevent accidental move.
- Customize color and label visibility in the style tab.
---
## 🔍 Keywords:
`ABC Pattern`, `Elliott Correction`, `Smart Money`, `Liquidity Grab`, `Break of Structure`, `Trend Continuation`, `Price Action Trading`, `Market Structure`
---
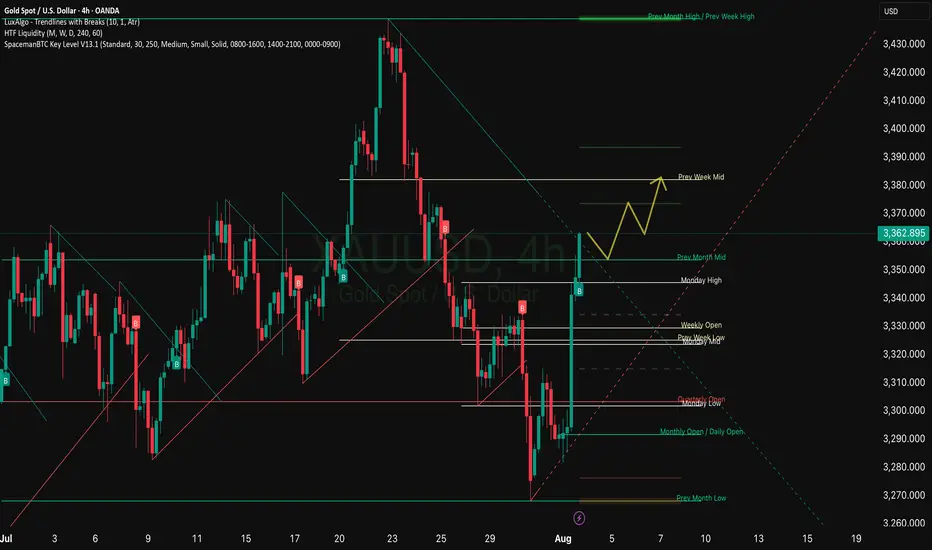
XAUUSD (GOLD): Bullish Impulsive Move Up Friday! Wait For Buys!In this Weekly Market Forecast, we will analyze the Gold (XAUUSD) for the week of Aug 4 - 8th.
Gold is bullish on the Monthly, Neutral on the Weekly, Bullish on the Daily.
The aggressive move higher after bad job numbers caused a shift in the market from bearish to bullish on the D1 time frame.
Be wary of the pullback, as that move is likely to be corrected, but that would set up a great long opportunity!
Enjoy!
May profits be upon you.
Leave any questions or comments in the comment section.
I appreciate any feedback from my viewers!
Like and/or subscribe if you want more accurate analysis.
Thank you so much!
Disclaimer:
I do not provide personal investment advice and I am not a qualified licensed investment advisor.
All information found here, including any ideas, opinions, views, predictions, forecasts, commentaries, suggestions, expressed or implied herein, are for informational, entertainment or educational purposes only and should not be construed as personal investment advice. While the information provided is believed to be accurate, it may include errors or inaccuracies.
I will not and cannot be held liable for any actions you take as a result of anything you read here.
Conduct your own due diligence, or consult a licensed financial advisor or broker before making any and all investment decisions. Any investments, trades, speculations, or decisions made on the basis of any information found on this channel, expressed or implied herein, are committed at your own risk, financial or otherwise.

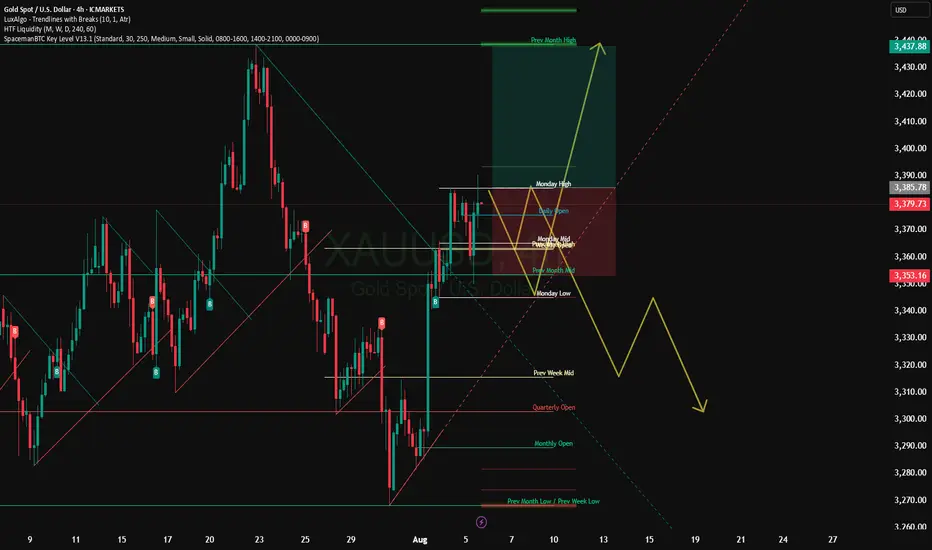
XAUUSD to the moon Current situation: price around $3360, short-term targets — rebound to $3415–3420 or fall to $3330–3300.
Trend: moderately bullish, but consolidation is possible in the quarter. Sustainable growth is possible with lower rates and increased geo-risks.
Tactics: consider buy on dip positions around $3330–3350 with a target of $3400+, or sell on rise in the $3415+ zone with signs of indicator reversal or dollar growth.
Monday's market forecast and related layout#XAUUSD
Judging from the monthly chart, although July closed with a large positive line, there is still great resistance above 3439-3501. Possible gold price trends for next week are as follows:
1. If gold prices open higher, focus on the previous highs of 3375-3385. If resistance and pressure are encountered, consider shorting, aiming for a volatile decline, retracing Friday's gains.
2. The market is volatile and sideways, so wait and see.
3. Gold fell back. Referring to Friday’s trading strategy, you can consider going long around 3335 to bet on a short-term rebound. Leave yourself some room for participation (the possibility of touching 3338 again and rebounding is not ruled out)

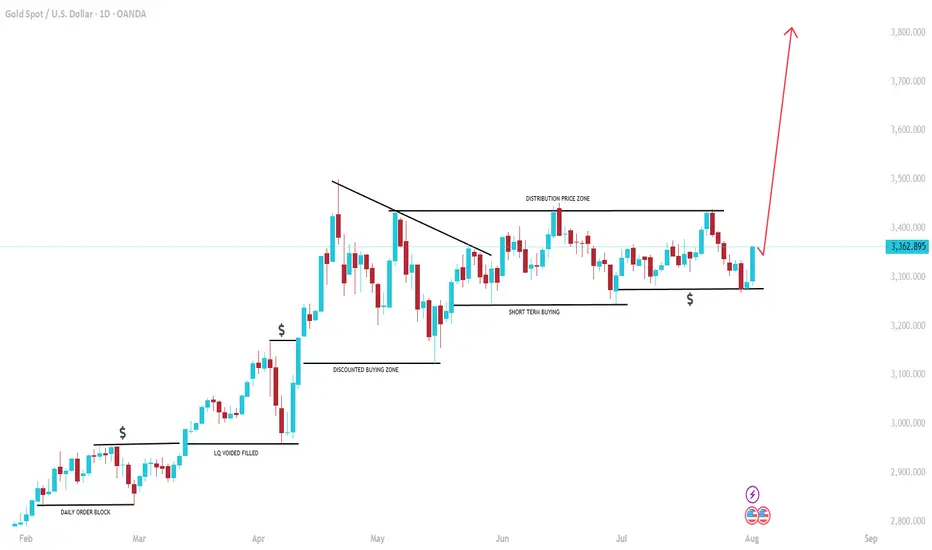
GOLD: $4000 on the way! Bulls has the controlGold is on the way hitting a record high since the global tension rising we can see gold creating another record high. Please note that it is a swing trades and may take weeks and months to hit the target or it may not even reach the target itself. This is prediction only so do your own due diligence.