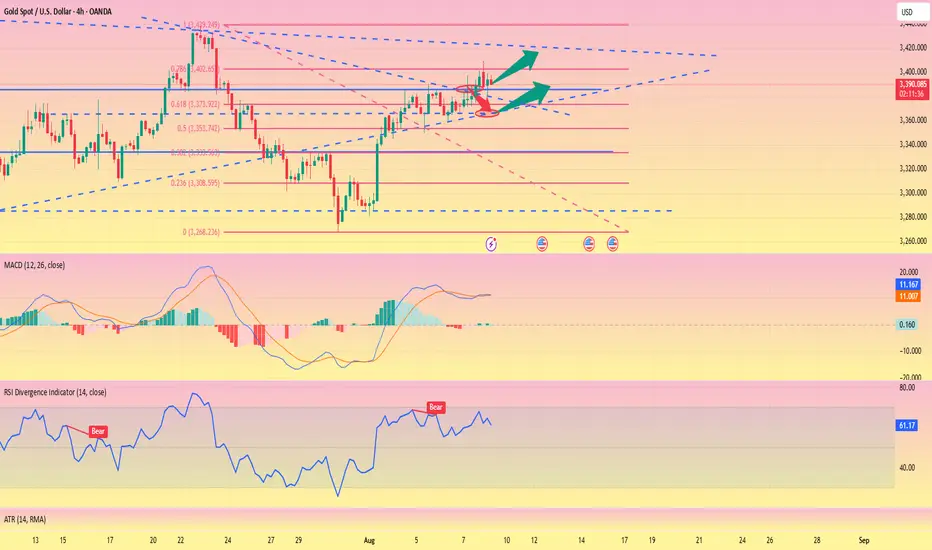
8/8: Continue to Focus on Selling, Watch Support at 3372–3366Good evening, everyone!
Today, after breaking above the 3400 level, gold experienced a pullback. The current structure shows dense support below, with previous resistance levels at 3378, 3372, and 3366 now turning into support.
On the daily chart (1D), price remains above the MA20, and the MA5 (~3382) serves as key short-term support. The candlestick formation still reflects a bullish structure for now.
However, the 4-hour chart (4H) reveals significant upward resistance, and unless the 4H structure is repaired, the market may favor a corrective or consolidation phase in the near term.
🔍 Trading Outlook:
For the remainder of today’s session and early next week, the strategy should primarily focus on selling into strength.
If the 4H chart corrects via a direct price retracement, gold could potentially test the 3348–3337 support zone.
Prior to that, closely monitor the 3372–3366 area as the primary short-term support and pivot zone.
Xauusdidea

XAUUSD - The bullish backdrop remains strongOverall Market Sentiment
The bullish background remains strong: the dollar index is putting pressure on gold, while geopolitical tensions and expectations of a rate cut by the Fed are increasing demand for the safe-haven asset
Direction by indicators: on Investing.com — 9 “Buy” signals against 3 “Sell” signals on moving averages and a neutral overall state
Support and resistance levels
Key support levels: $3,320 and $3,368–$3,340. A rebound from this zone could serve as a starting point for growth
Resistance: it is important to break $3,400 — a psychological and technical barrier, above which a directional move to $3,450 and beyond will open
Short-term scenario (LiteFinance): gold is testing resistance in the $3,380–$3,391 zone; a drop from there could lead to $3,330 → $3,268, and a breakout to the upside would accelerate growth to $3,493–$3,515
Union traders are noting the movement after the breakout of $3,375: possible targets are $3,390, $3,402.56 and $3,416.39. A breakout below $3,374.91 could send gold to $3,358.25, $3,350.01 and $3,341.18
1H chart analysis: Gold confidently broke through the $3,350 level, opening a bullish scenario, confirmed by macro dynamics and expectations of monetary policy easing

XAUUSD Ascending Channel Run to Supply Trade IdeaGold (XAUUSD) remains in a bullish trend 📈, forming higher highs and higher lows within a well-defined ascending channel ↗️. Price is approaching a recent swing high near resistance 🧱, and I’m watching for a short-term pullback into channel support 🔄 before a potential continuation higher toward the supply zone above 🎯.
This structure aligns with Wyckoff’s markup phase ⚡, where pullbacks serve as tests (LPS) before further upside. As long as price holds above the channel’s lower boundary 🛡️, the bullish bias remains intact — a break below would invalidate the setup ⚠️. Not financial advice.

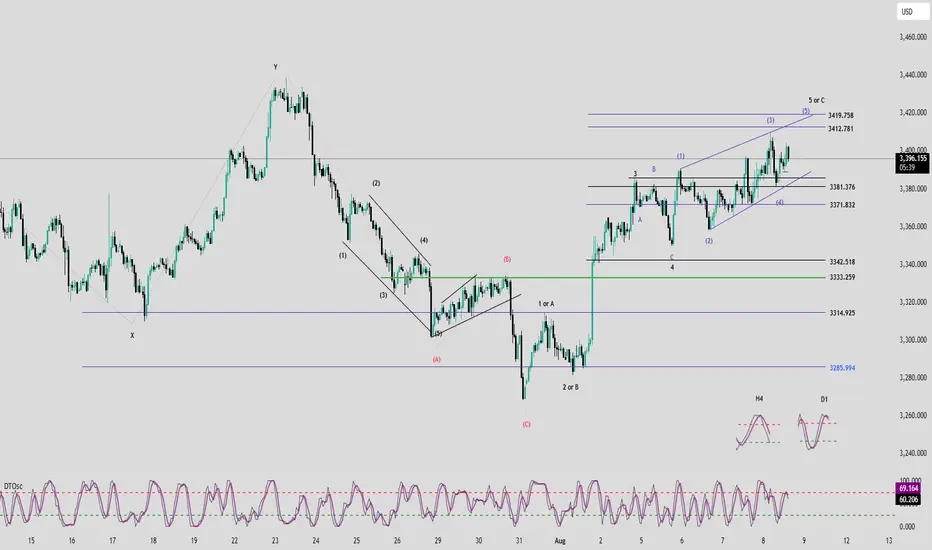
Elliott Wave Analysis – XAUUSD August 8, 2025📊
🔍 Momentum
• D1 Timeframe: Daily momentum is currently turning down, limiting the potential for a long-term rally in the current bullish wave. This also suggests that the top may already have formed around the 3,409 level.
• H4 Timeframe: Momentum is still declining and needs about one more H4 candle to reverse upward. For now, the downward move is likely to continue, so caution is advised.
• H1 Timeframe: Showing early signs of a short-term bearish reversal. This decline is important and will be analyzed further after the wave structure review.
🌀 Wave Structure
The current price action suggests a potential Ending Diagonal formation. Once completed, this pattern is typically followed by a sharp and sudden drop.
So far, no sharp decline has occurred, meaning the ending diagonal may not be finished yet. The ideal completion zones for Wave 5 are around 3412 or 3419.
Ending diagonals tend to develop in a complex manner, so a safer approach is to enter trades after price breaks below the lower boundary of the diagonal.
👉 Additional Scenario: If H1 momentum reverses downward and price breaks below 3381, it is likely to drop toward 3371. This area could be considered for a Buy setup.
Conversely, if price does not break below 3381 and instead rises toward 3412, it may indicate that Wave 5 is completing at that level.
📈 Trading Plan
• SELL Zone 1: 3412 – 3414
o SL: 3417
o TP1: 3393
o TP2: 3372
• SELL Zone 2: 3419 – 3421
o SL: 3429
o TP1: 3395
o TP2: 3372
The trend has not changed, go long and look for new highs#XAUUSD
Gold fluctuated at a high level in the Asian session, and the market has not yet taken a clear direction. Despite the current market conditions being extremely flat, caution remains regarding the potential for wider volatility after a breakout above key levels. The current short-term resistance area above gold is 3400-3410. With the breakthrough of yesterday's high today, the short-term support level will also move up. The middle track of the Bollinger band at the hourly level below has also risen to around 3390. The focus of the European session is whether gold can effectively break through the short-term suppression. If the European session is under pressure and encounters resistance, then gold may have a correction. It can be considered to retreat to the 3390-3378 area below and stabilize before lightly long gold to see new highs. Be wary of potential black swan events on Friday.
Gold (XAU/USD) 4H Institutional Outlook — August 8, 2025Overview
As of writing, XAU/USD is trading around $3,392.30 in the 4-hour session, holding firmly above the $3,370–$3,380 support shelf. The recent price action reflects ongoing bullish momentum, driven by escalating geopolitical risks, weak U.S. labor market data, and renewed safe-haven flows after the announcement of U.S. tariffs on gold bars.
This analysis outlines the primary institutional Buy and Sell Zones for the day, based on Smart Money Concepts (SMC), ICT methodology, Order Block/FVG confluence, and 4H price structure. All zones presented are execution-ready and supported by multi-layered validation from institutional frameworks.
✅ Current Price Context
Live Price (XAU/USD): $3,392.30 (as of ~03:00 UTC)
Structure: Bullish (Higher Highs and Higher Lows)
Bias: Bullish, with continuation toward $3,420+ likely if key support holds
Recent High: ~$3,410
Key Support Base: $3,375–$3,385
The bullish market structure remains intact with strong institutional displacement legs to the upside and well-defined liquidity targets still in play above $3,420.
🔍 Institutional Trade Zones (4H)
🟩 Primary Buy Zone (Execution-Ready Long Setup)
Entry Range: $3,375 – $3,385
Stop Loss: Below $3,370 (beneath liquidity shelf and unmitigated OB)
Target 1: $3,420 (1.272 Fib extension)
Target 2: $3,450 (1.618 Fib extension)
Confluence Factors:
Unmitigated Demand Order Block (RBR)
Embedded Fair Value Gap following impulsive buy-side displacement
0.705–0.79 OTE retracement zone from latest swing
Liquidity sweep under equal lows at ~$3,370
Volume imbalance supports continuation from this zone
Located within Discount territory of internal swing
Overlaps with Asia–London Kill Zone
➡️ This zone offers the highest confluence of institutional logic today and is nominated as the Golden Zone.
🟥 Primary Sell Zone (Countertrend Reversal Setup)
Entry Range: $3,415 – $3,425
Stop Loss: Above $3,430
Target 1: $3,380
Target 2: $3,350
Confluence Factors:
Fresh Supply Order Block (DBD) at premium pricing
Presence of FVG following sell-side displacement
0.705–0.79 OTE retracement from bearish leg
EQH liquidity resting just above entry
Strong rejection wicks during NY session
Volume imbalance confirms sell-side aggression
New York Kill Zone alignment
⚠️ Consider only if price cleanly enters the upper premium zone and shows rejection or sweep behavior.
🟨 Fallback Buy Zone (Contingency Setup)
Entry Range: $3,365 – $3,370
Stop Loss: Below $3,360
Target: $3,385 → $3,395
Confluences:
Secondary Demand OB
Partial FVG
In Discount territory
Liquidity resting just below $3,365
Volume tapering indicates absorption
Use only if Primary Buy Zone is invalidated via strong stop-run or displacement.
🟥 Fallback Sell Zone (Contingency Setup)
Entry Range: $3,430 – $3,435
Stop Loss: Above $3,440
Target: $3,400 → $3,380
Confluences:
Lower timeframe mitigation zone
FVG within premium zone
Above EQH liquidity
Fulfills repricing logic after overextension
Valid only if the primary sell zone is invalidated by sweep and reversal pattern confirmation.
🌐 Institutional Sentiment Confirmation
Reuters confirms gold reached multi-month highs due to tariff-induced safe-haven flows
FXStreet reports gold holds above the 20-day EMA with a bullish intraday structure
FXEmpire technicals target $3,450–$3,500 extension zones if bullish pressure sustains
COT positioning and fund flows show continued institutional interest in gold longs
🔔 Final Notes for Execution
Allow price to retest and react within the zone before entering.
Prefer entries during Asia-London or London-NY Kill Zones
Avoid market chasing — wait for confirmations such as sweep → displacement → mitigation

Gold Price Action Update: Neutral to Bearish BiasThis week, apart from my short trade on Tuesday, I’ve maintained a bullish outlook on Gold, suggesting buying the dips with the expectation of a breakout above the 3380-85 zone. I was targeting an acceleration above 3400 and eventually 3440. I followed through with this idea and bought in anticipation of the move.
However, something about Gold's recent price action raised a red flag for me, prompting me to close my buy positions. Let’s break it down:
Starting yesterday morning, the price action became erratic. Initially, we saw the expected breakout, but it was quickly reversed, and the price action turned choppy. Then came a series of quick pumps, followed by quick reversals—each time the market would move up, only to fall back again. As of writing, we’re sitting at 3388.
This kind of erratic movement usually suggests that we’re nearing a top, and even if Gold spikes again above 3400, I don’t want to hold positions in a market that’s so volatile and unsustainable in either direction.
So, I’m out for now, adopting a neutral to bearish stance.
If the price drops below 3370, it would indicate a likely top formation, and at that point, I’ll be looking to sell rallies; till then, wait and see.
Disclosure: I am part of TradeNation's Influencer program and receive a monthly fee for using their TradingView charts in my analyses and educational articles.

GOLD: Bullish Shift ConfirmedBullish BOS, price is trading above 3360. Clean bullish choch formed creating a new HH. Look to buy...
(H4)
✅ New HL formed around 3280 and we now have a break above $3355 and $3360 = BOS confirmed.
🟢 Key Zone: 3322–3337
(H1)
✅ BOS above 3360 confirms bullish bias
✅ Key Zone: 3322–3337 (Use this zone to set a limit or watch for confirmation)
Retracement expected before continuation.
(M15)
👀 What to Watch:
If price opens lower and taps into 3330s, monitor for:
✅ Sweep of intraday lows
✅ M15 bullish BOS above 3348–3350
🔁 Entry on retest of new demand zone after BOS
❌ Invalidation: Break and close below 3305
Other Scenario: No Pullback — Buy Breakout Instead
If price opens strong and continues up from the 3360s, wait for:
✅ Bullish Break of Structure (BOS) Above: 3385
This is your confirmation level that buyers are still in control

$3,600 Gold Incoming? The Accumulation Zone Says It All!Gold has been showing textbook price action. After years of testing, the long-term trendline was finally broken and then flipped into solid support, classic breakout-retest behavior.
Former resistance zones have consistently turned into support on the way up, confirming bullish strength. Now, price is consolidating in a tight range near all-time highs, this is not weakness, it's accumulation.
As long as the structure holds, this looks like a potential launchpad for the next leg higher.
Patience pays in gold; accumulation leads to expansion.
DYOR, NFA
Thanks for Reading!

The triangle pattern is about to break through and hit 3400#XAUUSD
Although the price of gold was too high last night due to the rise in risk aversion, the upward momentum weakened significantly in the evening, and it fluctuated sideways at a high level. Gold is currently consolidating within a triangle pattern, with a short-term price increase reaching the triangle's boundary. A break above 3385 could lead to significant intraday gains. Meanwhile, the downside is defending short-term support at 3365. As long as this support level remains intact, the bullish trend remains intact. If the European session gives an opportunity to fall back to the 3375-3365 support area without breaking, you can consider going long and look at 3395-3405, and if it breaks, look at 3415.
8/7: Continue to Focus on SellingGood afternoon, everyone!
During today’s session, gold successfully moved into the anticipated resistance zone of 3386–3398, and encountered significant selling pressure near 3398, resulting in a retracement to around 3372. While the price action aligned with prior expectations, the delayed timing has led to a bearish shift in the technical structure, which may hinder further upside momentum for the bulls.
That said, important economic data will be released during the US session later today. We’ll need to observe whether bulls can leverage the potential catalyst to break through the current resistance levels.
⚠️ Trading Strategy Recommendation:
Regardless of the data outcome, it is advisable to maintain a bearish bias in subsequent trades.
From a technical standpoint, the higher the price climbs, the greater the probability of a pullback, making short positions relatively less risky.
📌 Reference Range:
Continue to monitor and trade within the key zones outlined yesterday, adjusting entries and exits as per intraday developments.

Gold (XAU/USD) - 2H Wave Setup + Scalp Opportunities# 🔻 Gold (XAU/USD) - 2H Wave Setup + Scalp Opportunities Ahead
**By: Mohsen Mozaffarinezhad**
📅 August 7, 2025 | ⏰ Valid through August 8 (End of NY Session)
⏱ Timeframe: 2H
📌 Method: Elliott Wave + Supply/Demand + SSL Hybrid Confirmation
---
## 🧠 Market Context:
Price has completed a **strong bullish leg** and is currently forming a classic **(a)-(b)-(c)** corrective pattern. We are now between **point (b)** and the potential completion of **(c)**. The broader market is expected to **retest the lower demand POI**, possibly before resuming the uptrend.
---
## 🔎 Technical Highlights:
- 📉 Bearish correction in progress: (b) → (c)
- 📦 Major **Supply** above 3,390 – acted as rejection point
- 🟦 Strong **Demand Zone**: 3,345 – 3,320
- 🔁 Price forming a potential **ABC correction**
- 🔔 **Point of Interest (POI)** near 3,350 may offer entry confirmation
- 💠 **SSL Channel**: Currently bearish crossover
- 🔄 **RQQ, HT, MACD, RSI**: Bearish/neutral, waiting for reversal signals
- 📊 **Volatility (Vol %ile)**: 67%
- 🎯 **ATR**: 13.52 (2H – medium range)
- 🧯 **Risk Level:** Normal
---
## 🟢 Scalp Strategy:
Scalp traders can take advantage of both micro-swings at **points (a) and (b)** using lower TF (M5/M15) confirmations:
### 🎯 Scalp Buy:
- 📍 Entry: Near 3,345–3,350
- 🛑 SL: Below 3,340
- 🎯 TP: 3,365–3,370 (short-term liquidity sweep)
- ⚠️ Only on bullish SSL + RSI divergence (M5)
### 🎯 Scalp Sell:
- 📍 Entry: Near 3,375–3,380 (**point b rejection**)
- 🛑 SL: Above 3,385
- 🎯 TP: 3,360 then 3,350
- ⚠️ Use Heikin-Ashi reversal + SSL confirmation
---
## 📌 Mid-Term Outlook (Swing):
If price reaches **point (c)** around the **lower demand zone** and reacts with bullish structure (BOS, CHoCH), we anticipate a strong rally toward:
- **TP1:** 3,385
- **TP2:** 3,400
- **TP3:** 3,420 (next macro supply)
---
## ⚠️ Notes:
> This setup remains **valid until the end of NY session, August 8**.
> Wait for **clear confirmation** before execution.
> All scalps are suggested with **tight risk management**.
_Analysis by Mohsen Mozaffarinezhad | Educational Purposes Only_
---
#gold #xauusd #elliottwave #supplydemand #sslhybrid #scalping #smartmoney #tradingview #forexanalysis

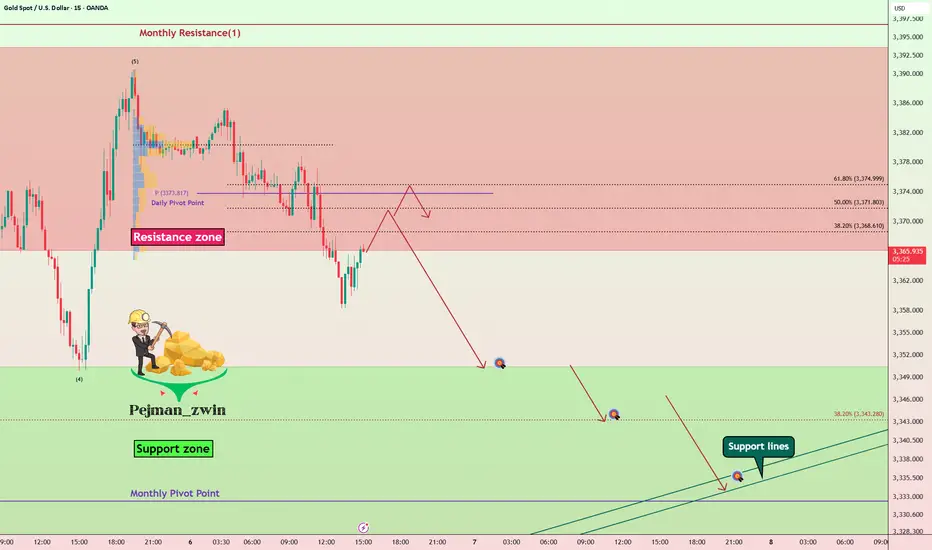
Gold Roadmap — Short termGold ( OANDA:XAUUSD ) rose to $3,383 as I expected in yesterday's idea .
Gold is currently moving in the Resistance zone($3,393-$3,366) .
In terms of Elliott Wave theory , it seems that Gold has completed 5 impulse waves , and we should wait for corrective waves on the 15-minute time frame .
I expect Gold to start declining from one of the Fibonacci levels and fall to at least $3,351 .
Second Target: $3,344
Third Target: Monthly Pivot Point/Support lines
Note: Stop Loss (SL) = $3,392
Gold Analyze (XAUUSD), 15-minute time frame.
Be sure to follow the updated ideas.
Do not forget to put a Stop loss for your positions (For every position you want to open).
Please follow your strategy; this is just my idea, and I will gladly see your ideas in this post.
Please do not forget the ✅ ' like ' ✅ button 🙏😊 & Share it with your friends; thanks, and Trade safe.
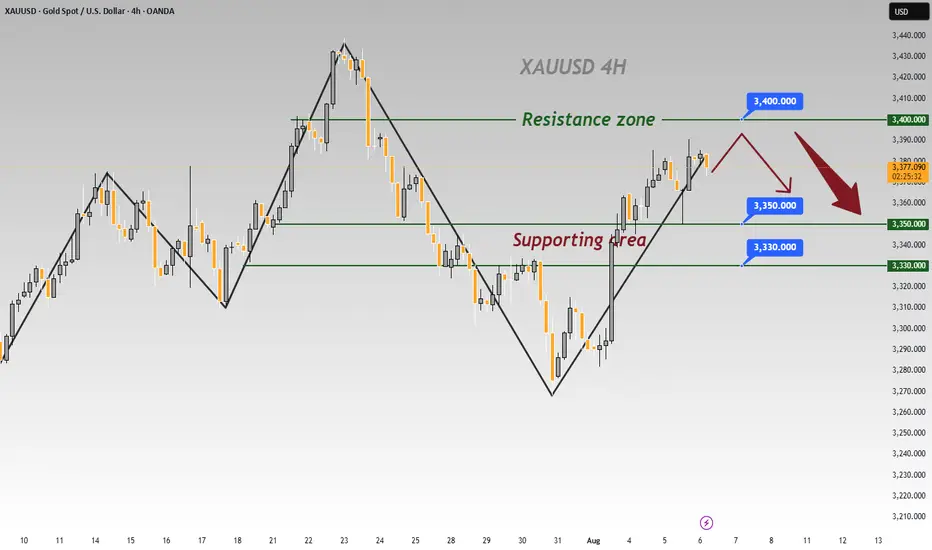
XAUUSD - 3400Technical picture
Bullish momentum is strengthening: US jobs shortage has caused an influx into safe havens, which has contributed to gold's growth
A reversal signal is forming: a bounce from the lower line of Bollinger Bands is observed, and a bullish cross of EMA-8 and EMA-21 is also forming, plus a moderately positive MACD - a classic "buy on dip" entry pattern
Key levels:
Support: around $3,330 - a support zone coinciding with the 21- and 50-day SMAs. Below — potential for decline to $3,297-$3,283
Resistance: $3,380 — resistance, breakout of which could open the way to $3,440-$3,450
Structural pattern: breakout from triangle to the downside could signal a deeper correction
Industry consensus: Citi has revised its target range up to $3,300-$3,600 in the next three months, based on a weak US economy and rising geo-risk
Meanwhile, HSBC warns of possible weakness — forecast for 2025-2026 from $3,215 to $2,350 in a more bearish scenario

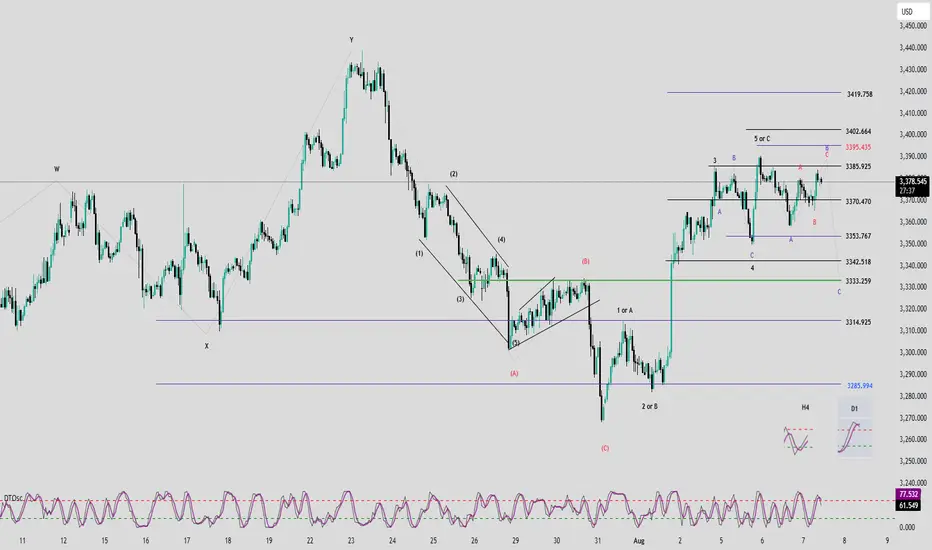
Elliott Wave Analysis – XAUUSD | August 7, 2025📊
________________________________________
🔍 Momentum Analysis:
• D1 Timeframe: Daily momentum is turning bearish, signaling that a medium-term downtrend may have already started and could last until mid-next week.
• H4 Timeframe: Momentum is rising, but the slope of the two momentum lines is relatively flat → indicating weak bullish strength. We should closely watch the overhead resistance zones.
• H1 Timeframe: Momentum has entered the overbought zone → a short-term reversal is likely, especially near the 3386 level.
________________________________________
🌀 Elliott Wave Structure:
• Based on the bearish momentum shift on the D1 chart, we expect the market is entering an ABC corrective pattern (in green).
• Currently:
o Wave A is completed.
o Wave B is in progress.
• Since Wave A appears to be a 3-wave structure, Wave B may unfold as a flat correction. In that case, potential target zones for Wave B are:
o 3385
o or 3395 → these are the key resistance levels to monitor.
• Within Wave B (green), we observe an internal 3-wave ABC structure (in red), where:
o Wave C (red) may reach:
3386
or extend toward 3395
→ In alignment with the D1 momentum signal, 3386 is considered a potential entry point for a short position.
________________________________________
📈 Trade Plan:
• SELL Zone: 3386 – 3389
• Stop Loss: 3397
• Take Profits:
o TP1: 3370
o TP2: 3353
o TP3: 3333
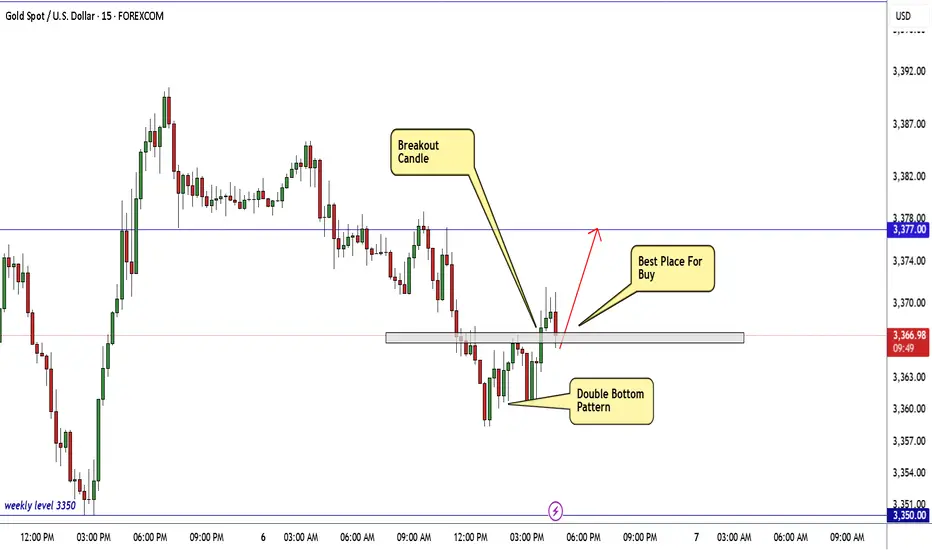
GOLD Ready To Go Up From Current Price , 150 Pips WaitingHere is My 15 Mins Gold Chart , and here is my opinion , we finally above 3365.00 and we have a 30 Mins Candle closure above it And Perfect Breakout , so we have a good confirmation now to can buy it and we can targeting 100 to 150 pips .
Reasons To Enter :
1- New Support Created .
2- Bullish Price Action .
3- Bigger T.F Giving Good Bullish P.A .
4- Clean Breakout .
5- Reversal Pattern .
Gold (XAU/USD) 4H Institutional Analysis — August 6, 2025As of August 6, 2025 (12:23 UTC), Gold (XAU/USD) is trading around 3,367.60, according to Kitco’s live spot price feed. After a sustained bullish recovery from the 3,320–3,330 demand zone, gold finds itself at a structural inflection point. Institutional footprints across the board — from order blocks to liquidity maps — are signaling one dominant message: the bulls are setting the stage.
In today’s breakdown, we deliver a high-conviction execution plan using a fusion of Smart Money Concepts (SMC), ICT methodology, and 4H structural dynamics — isolating only the strongest Primary Buy and Sell zones, along with their fallback counterparts. At the center of this framework is our Golden Zone, the most institutionally-aligned, high-probability area of the day.
🔍 Market Structure & Directional Bias
The 4-hour chart has shown a clear Change of Character (CHoCH) to the upside after a bullish Break of Structure (BOS) above the 3,355 level. This signals a phase shift from consolidation into accumulation and potential expansion, likely aiming toward the 3,400 psychological magnet and beyond.
The presence of volume imbalances, fair value gaps, and unmitigated order blocks across multiple structural layers further supports a bullish directional bias. Liquidity has been swept below previous equal lows (EQL), creating an environment ripe for institutional accumulation.
Directional Bias: Transitional → Bullish
🎯 Primary Execution Zones
✅ Primary Buy Zone (Golden Zone) — 3,355 to 3,360
This zone represents the highest-quality long opportunity on the chart today. Sitting in the discount array (below 50% of recent swing), the zone is built on a fresh Rally-Base-Rally (RBR) demand structure formed after a decisive CHoCH.
The 3,355–3,360 range aligns with a valid unmitigated Order Block, an embedded Fair Value Gap, and an OTE retracement between 0.705–0.79 Fib levels. Beneath this zone lies a sweepable liquidity pocket just under 3,350, further increasing the magnetism of the area.
Entry: 3,355–3,360
Stop Loss: Below 3,350 (liquidity invalidation)
Take Profits:
TP1: 3,395–3,400 (1.272 extension)
TP2: 3,420 (1.618 extension)
Confluences: RBR Demand, OB, FVG, OTE, Volume Imbalance, EQL Sweep, Discount Array, Structural Support
Kill Zone Timing: London-NY Overlap
✅ Golden Zone of the Day
✅ Primary Sell Zone — 3,395 to 3,400
While the broader bias is bullish, gold remains capped by a strong Drop-Base-Drop (DBD) supply zone around 3,400 — also the 1.272 fib extension from prior bullish legs. A pocket of equal highs (EQH) just above 3,405 serves as a liquidity magnet and stop-loss hunting zone — making this supply level extremely attractive for short-term reversion plays.
Entry: 3,395–3,400
Stop Loss: Above 3,405
Take Profits:
TP1: 3,360
TP2: 3,350
Confluences: DBD Supply, OB, FVG, OTE Retrace, EQH Sweep, Premium Array, Structural Resistance
⚠️ Secondary Execution Zones (If Primary Fails)
🟢 Fallback Buy Zone — 3,325 to 3,330
If the market manipulates lower and invalidates the primary buy zone with a deep liquidity sweep, this deeper zone offers a second chance. It contains a secondary demand block, a valid FVG, and lies cleanly within a deep discount retracement.
SL: Below 3,320
TPs: 3,360 and 3,380
🔴 Fallback Sell Zone — 3,445 to 3,450
If gold breaks cleanly above 3,405, likely invalidating the primary sell idea, the next institutional level of interest is 3,445–3,450 — sitting on a higher timeframe premium OB and major liquidity shelf.
SL: Above 3,455
TPs: 3,395 and 3,370
🌐 Institutional Consensus: Bullish Convergence
Institutional analysts across major platforms confirm a bullish bias, with targets hovering around the 3,400–3,420 area:
Reuters reports that gold is near a one-week high, supported by weaker U.S. data and increased rate-cut bets.
MarketPulse highlights the “return of the bulls” amid sustained momentum and light CPI expectations.
Citi has raised its medium-term gold target to $3,500, citing negative U.S. macro headwinds.
TradersUnion confirms support at 3,320 and resistance at 3,400 — mirroring our execution levels.
There is no significant divergence in sentiment or structure, validating today's trade zones with confidence.
📌 Final Thoughts
In a liquidity-driven market, price is engineered — not discovered. Today, that engineering points to one thing: 3,355–3,360 is the Golden Zone — the strongest execution area, supported by eight institutional confluences, favorable structure, and widespread sentiment confirmation.
Gold has re-entered its institutional kill-box. The next move? Likely engineered to deliver smart money profits while trapping the uninformed. Don’t chase price. Let it come to your zone. Execute with discipline.

The market trend is still there, go long on the pullback#XAUUSD
Yesterday, gold experienced a V-shaped reversal: it was blocked at the 3382 line in the morning and then fluctuated and fell, then it fell to the support near 3349 and stabilized and rebounded, then rebounded to near 3390 in the evening and closed with a doji on the daily line. Judging from the overall trend, the bullish pattern has not changed.
Gold has limited room for decline in the short term, and a sharp drop is unlikely. Today's market tends to adjust and correct first before continuing to rise. The adjustment is only short-term, and is more to give everyone enough opportunities to get on board. The focus of the market below is 3375-3360, with the target looking at yesterday's high around 3390-3395. A break is expected to extend to the 3400-3420 area.
🚀 BUY 3375-3360
🚀 TP 3390-3395

Gold Bounces from PRZ — Is a Short-Term Rally Underway?Gold ( OANDA:XAUUSD ) started to rise from the Support zone($3,307-$3,275) as I expected in the previous idea .
Gold is currently moving near the Support zone($3,350-$3,326) , Potential Reversal Zone(PRZ) , and $3,334 (Important price) .
From the Elliott wave theory , it seems that Gold has completed its 5 impulsive waves and now we should wait for corrective waves . Corrective waves can complete at the Potential Reversal Zone(PRZ) .
I expect Gold to rise to $3,383(at least) in the coming hours .
Second Target: $3,396
Note: Stop Loss (SL) = $3,321
Gold Analyze (XAUUSD), 1-hour time frame.
Be sure to follow the updated ideas.
Do not forget to put a Stop loss for your positions (For every position you want to open).
Please follow your strategy; this is just my idea, and I will gladly see your ideas in this post.
Please do not forget the ✅ ' like ' ✅ button 🙏😊 & Share it with your friends; thanks, and Trade safe.

Gold: Yesterday’s Surge & Today’s Session StrategyDuring yesterday’s U.S. trading session, gold surged to around 3390 🚀, driven by a series of tariff-related remarks from Trump, Fed personnel changes, and market expectations that the probability of a September rate cut has risen to 91% ⚡️. We successfully took profit near 3355 yesterday, locking in close to maximum gains 💰.
Today’s trading strategy:
Go short at highs during the Asian session 📉
Go long at lows during the European session 📈
Go short at highs again during the U.S. session 📉
⚡️⚡️⚡️ XAUUSD ⚡️⚡️⚡️
🚀 Sell@ 3390 - 3380
🚀 TP 3375 - 3366 - 3356
Daily updates bring you precise trading signals 📊 When you hit a snag in trading, these signals stand as your trustworthy compass 🧭 Don’t hesitate to take a look—sincerely hoping they’ll be a huge help to you 🌟 👇
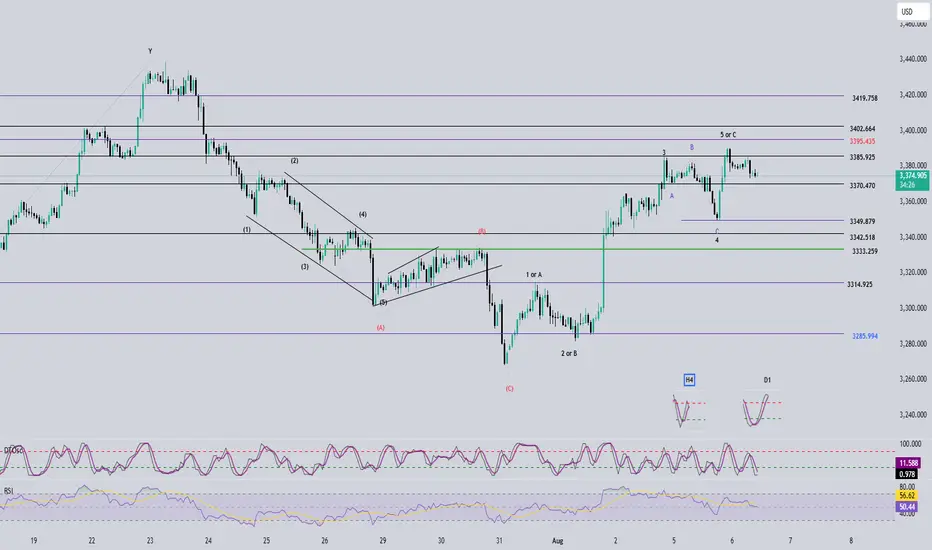
Elliott Wave Analysis – XAUUSD August 6, 2025📊
________________________________________
🔍 Momentum Analysis
• D1 Timeframe:
Daily momentum is showing signs of a potential bearish reversal. However, we need to wait for today’s candle to close to confirm the signal. While waiting for confirmation, price may still experience a minor upward move on lower timeframes, but the current bullish momentum is weak and unlikely to extend far.
• H4 Timeframe:
Momentum is also preparing to reverse. We need to observe the current H4 candle for confirmation. Notably, the reversal signal is forming just below the overbought zone, suggesting there may be one more upward push before a potential decline.
• H1 Timeframe:
Momentum is approaching the oversold zone. It may take 1–2 more bearish candles before a short-term bullish rebound occurs.
________________________________________
🌀 Elliott Wave Structure Update
Yesterday’s bullish move was disappointing — instead of pushing directly to the 3402 or 3419 target zones to complete Wave 5, price only broke slightly above 3385 before reversing. This behavior complicates wave analysis by introducing conflicting possibilities.
We currently consider two main scenarios:
Scenario 1: Wave 5 is not yet complete
• Given that D1 momentum is preparing to reverse downward, it’s unlikely that the current move is Wave 1 of Wave 5. A more likely scenario is that Wave 3 of Wave 5 has completed and price is currently in Wave 4.
• The current corrective structure has stopped at the 0.382 Fibonacci level. As long as price remains above 3370 (the 0.5 Fib level), this strengthens the case for a Wave 4 retracement before another leg up in Wave 5.
• Since bullish strength appears limited, we now focus on two main target zones for Wave 5: 3395 and 3402, instead of the previous high at 3419.
Scenario 2: Full 5-wave structure is complete – now in correction
• If the 5-wave pattern has already finished, the current decline marks the beginning of a corrective phase.
• With current momentum conditions, this is still a viable scenario. However, due to the remaining upside possibility, we recommend waiting for today’s D1 candle to confirm momentum before taking any trade.
________________________________________
📌 Trade Plan
For experienced traders:
• Wait for price to reach the 3395–3402 zones.
• Look for reversal signals in those areas to enter short positions.
Suggested trade plan for newer traders:
• Sell Zone: 3395 – 3398
• Stop Loss: 3408
• Take Profits:
o TP1: 3385
o TP2: 3370
o TP3: 3349
________________________________________
✅ Note:
This trade plan should be reassessed after today’s D1 candle closes for confirmation of the momentum shift.
8/6: Watch for a Potential Double Top FormationGood morning, everyone!
Yesterday, gold experienced its first significant supply pressure around the 3386 level, but with support near 3350—helped by positive data—prices rebounded and climbed back toward 3390, resulting in solid overall gains.
From the 1-day chart (1D) perspective, the technical structure remains bullish, with MA20 providing firm support. Although short-term moving averages are currently converging, the overall bias remains towards a bullish divergence, suggesting further upside potential. There's a possibility for price to test the 3400–3420 zone in today’s session.
That said, the 3386–3398 region may still pose minor selling pressure, although it is not expected to be particularly strong. Key intraday support is seen in the 3378/3372–3362 range. If the market encounters another wave of heavy selling that damages the daily bullish setup, then the 3343–3348 area will become a critical battleground between bulls and bears.
📌 Trading Strategy for Today:
Maintain a sell-on-strength approach, especially if prices approach the 3418–3438 resistance area, where short opportunities become more attractive;
If a pullback occurs, monitor the aforementioned support zones for potential buy-on-dip opportunities, contingent on stability.
⚠️ Market Risk Reminder:
There will be key economic speeches during the US session, which could trigger heightened volatility. Ensure proper risk management and stop-loss settings are in place.

gold on sell#XAUUSD price third range have been broken, now we wait for reverse below 3355.
Sell from 3375-3373 on H1 closure, target 3355, SL 3384
If price touch 3371 and reverse back close, bullish range between.
