20/8/68 : XAUUSD ( US. Session )Using it from Europe Session until 7.00PM , I'll new analysis and update at 8.00PM
Resistance
3352-3358
3342-3347
3337
Support
3327
3316-3321
3306-3311
Xauusdidea

XAUUSD:Continue shorting at high levels to profit.Gold prices did not significantly break through their upper limits yesterday. The London market began its downward trend. New York markets extended their decline after opening, hitting a low of 3326. The meeting is almost over, but there has been no progress. The market has digested the expected gold price trend and is currently rebounding. However, if further news is released, gold prices may fall further. Consider selling between 3345 and 3340.

The dividing line 3330-3340 is not broken and rebounds to short#XAUUSD
After repeated fluctuations in the white session last night, gold fell below 3320 in the NY session and closed with weak fluctuations. 📊This morning, gold hit a low near 3311,📉 which aligns with our short-term outlook.✅
Judging from the monthly chart, the decline of gold in recent weeks has not been smooth, and each time it has been accompanied by a relatively strong rebound. 📈Today, there is a rebound near the 3311 line below. This point deserves our attention.👀 Previously, NFP achieved a big rise after breaking through here.🚀 At the same time, this point is also the area of the daily 100-day moving average.🐂
The first time it hits this point, it is bound to usher in a bullish resistance, and this is indeed the case.⚖️ Once it falls below this point, the next step will be the 3300 integer mark, 🥅and it may even hit the previous low, which is also the lower track of the daily line around 3280.↘️
Although the current market is relatively strong in short-term selling, we should not be overly bearish in the short term.↘️ After all, the impact of the news has not completely dissipated. The Federal Reserve will also release the meeting minutes in the evening NY session, 📰so we still need to be vigilant that the bulls may counterattack at any time.📈
In the short term, pay attention to the upper 3330-3340 bull-bear dividing line. If you encounter resistance and pressure in this range, you can consider shorting in batches with light positions, looking towards 3315-3300, and defending 3345. If the rebound effectively breaks through 3345, gold may fluctuate again.📊
🚀 SELL 3330-3340
🚀 TP 3315-3300

19/8/68 : XAUUSD ( Europe / London Session )Using it from Europe Session until 7.00PM , I'll new analysis and update at 8.00PM
Resistance
3359-3364
3349-3354
3343
Support
3333
3323-3328
3313-3318

20/8/68 : XAUUSD ( Europe / London Session )Using it from Europe Session until 7.00PM , I'll new analysis and update at 8.00PM
Resistance
3340-3345
3330-3335
3324
Support
3314
3303-3309
3293-3298

Elliott Wave Analysis – XAUUSD 20/8/2025
1. Momentum
• D1 timeframe: Momentum lines are still “sticking” together, signaling that the bearish pressure is weakening. However, without a strong bullish D1 candle to confirm reversal, there is still a risk of sudden downward spikes. Patience is required until a clear bullish confirmation appears.
• H4 timeframe: Momentum is currently turning bullish, suggesting a potential upward move today. But caution is needed: if the bullish candles are short, overlapping each other, and when momentum reaches the overbought zone without breaking the previous high → this move is likely just a corrective rebound.
• H1 timeframe: Momentum is in the overbought area, indicating the possibility of a minor pullback or sideways movement in the short term.
2. Wave Structure
• D1 timeframe: The corrective triangle structure remains valid (only invalidated if price breaks below 3270). The main scenario continues to favor wave 1 and 2 in blue, with price currently in wave 2.
• H4 timeframe: The decline in wave C shows overlapping sub-waves, each formed by 3-wave structures, hinting at the possibility of an ending diagonal for wave C. The pattern is not yet complete, so we need further observation for confirmation.
• H1 timeframe: Within the 5-wave structure of an ending diagonal, wave 3 is typically the strongest and a divergence usually occurs between wave 3 and wave 5 on RSI. Yesterday’s decline pushed RSI into the oversold zone, but no divergence has formed yet. Combined with H4 momentum turning bullish, this suggests the current move is likely wave 3 (yellow). A corrective wave 4 upward is expected, followed by a final decline to complete wave 5 with RSI divergence. Once wave 5 ends, the entire wave C diagonal will be complete, paving the way for a strong bullish rally — a typical characteristic of ending diagonals.
3. Trading Plan
The strategy is based on the ending diagonal pattern:
• Conservative approach: Wait for a breakout above the upper boundary of the diagonal before entering.
• Aggressive approach: Wait for wave 5 to complete and enter at the projected bottom of wave 5.
Trade setup:
• Buy Zone: 3301 – 3299
• Stop Loss (SL): 3219
• Take Profit (TP1): 3314
• Take Profit (TP2): 3362
• Take Profit (TP3): 3381

Gold (XAUUSD) Bulls: Eyes on 3301 – Smart Entry Zone ApproachingGold is nearing a key support zone at 3301–3298, where buying interest may begin to build. A bounce from this area could trigger a potential upward move.
🔻 Trade Setup
Entry: Buy at 3301
Targets: Refer to marked zones on the chart
Invalidation: Setup remains valid unless price breaks below 3290.
📌 Risk-Reward: Tight risk with strong upside potential. Manage your position accordingly.
👍 If you found this idea helpful, drop a like and share your thoughts in the comments — let’s grow together!
Happy Trading,
– The InvestPro Team

Gold (XAU/USD) 4H- 20th August 2025Gold continues to trade in a bearish transitional phase after extended bullish movement. Current structure shows price reacting from premium supply zones, with liquidity resting below prior lows. This suggests short setups remain favorable, while discount levels could still attract buyers if deeper pullbacks occur.
✅ Primary Trading Levels
Primary Buy Zone – $3280 to $3288
Gold has a fresh 4H demand block aligning with a discount zone and liquidity resting under recent equal lows. A rejection here could fuel a rebound back into $3338 and potentially $3350.
Stop Loss: Below $3270
Targets: $3338 → $3350
Primary Sell Zone – $3346 to $3354
This area sits in premium territory, overlapping with a refined supply block and an unfilled imbalance. Liquidity above equal highs at $3355 makes this the most attractive level for sellers.
Stop Loss: Above $3364
Targets: $3305 → $3288
⚠️ Fallback Levels
Fallback Buy Zone: $3252 – $3260 → Targeting $3305 / $3332
Fallback Sell Zone: $3372 – $3380 → Targeting $3330 / $3305
🏆 Golden Zone of the Day
Sell Zone $3346 – $3354 is the highest-probability, institution-grade level for today. This zone aligns with liquidity above equal highs and offers the best risk-reward for shorts into downside targets.
📌 Trading Plan
Focus on short setups near $3346 – $3354
Look for confirmation: wick rejection or displacement within the zone
Manage risk tightly around liquidity shelves
📢 Conclusion:
Gold is offering a clean sell-side opportunity from premium levels, with downside targets into $3305 and $3288. Buyers may only regain control if $3280 holds firmly. For now, sellers have the upper hand.

XAUUSD: Rebound Resistance & Short SetupAugust 18th: Gold closed at a daily low on Friday and gapped down slightly at the open on Monday. After dipping to a low of 3323, it staged a rebound. The wedge pattern is gradually converging, and the overall price action remains in a top-side consolidation phase.
On the 4-hour chart, consecutive strong bullish candles have broken through and held above the middle Bollinger Band, with the short-term trend shifting from weak to strong. That said, as the 3358-3360 resistance zone remains unbreached for now, the price is still stuck in a downward correction channel.
Trading strategy: Consider shorting on a rebound around the aforementioned resistance zone. A confirmed break above this level would open the door to 3370-3380. For support, keep an eye on 3332 and 3320 below
⚡️⚡️⚡️ XAUUSD ⚡️⚡️⚡️
🚀 Sell@ 3360 - 3355
🚀 TP 3345 - 3340 - 3335
Daily updates bring you precise trading signals 📊 When you hit a snag in trading, these signals stand as your trustworthy compass 🧭 Don’t hesitate to take a look—sincerely hoping they’ll be a huge help to you 🌟 👇

Bullish Setup on Gold – Targets Ahead!Gold ( OANDA:XAUUSD ) is still moving in the Support zone($3,350-$3,326) and near the Monthly Pivot Point .
In terms of Elliott wave theory , it seems that Gold has managed to complete the Zigzag Correction(ABC/5-3-5) , and we should wait for the rising waves .
Also, we can see the Regular Divergence(RD+) between Consecutive Valleys .
I expect Gold to rise to at least $3,371 AFTER breaking the Resistance lines .
Second Target: $3,394
Third Target: $3,407
Note: Stop Loss (SL) = $3,317
Gold Analyze (XAUUSD), 1-hour time frame.
Be sure to follow the updated ideas.
Do not forget to put a Stop loss for your positions (For every position you want to open).
Please follow your strategy; this is just my idea, and I will gladly see your ideas in this post.
Please do not forget the ✅ ' like ' ✅ button 🙏😊 & Share it with your friends; thanks, and Trade safe.

Institutional Gold Analysis (XAU/USD) – 19 August 2025Gold prices are consolidating in a narrow range near $3,331, reflecting a transitional market phase as traders await fresh direction from the Federal Reserve’s upcoming Jackson Hole summit. The prevailing bias leans mildly bearish in the short term, with USD strength and higher yields capping upside momentum, while underlying safe-haven demand continues to provide structural support.
From a 4-Hour institutional perspective, price action currently sits at the midpoint of an internal range, offering clearly defined liquidity pools both above and below. This creates an environment where institutional flows are likely to engineer sweeps into key supply and demand zones before a decisive expansion phase begins.
Primary Institutional Zones
Primary Buy Zone ($3,320–$3,325)
The dominant area of interest for buyers lies within $3,320–$3,325, a well-defined discount zone that combines multiple layers of institutional confluence. This level is supported by a Rally-Base-Rally (RBR) demand zone, a fresh unmitigated order block, and a fair value gap formed during recent displacement. The retracement aligns perfectly with the Optimal Trade Entry (OTE) Fibonacci band (0.705–0.79), while liquidity pools at equal lows (EQL) provide the setup for a sweep before reversal. From here, upside targets extend first to the structural resistance at $3,348, and further towards $3,372 — the 1.272 Fibonacci extension of the last impulsive leg.
Primary Sell Zone ($3,345–$3,350)
On the supply side, the clearest short opportunity emerges between $3,345–$3,350, which has been validated as a Drop-Base-Drop (DBD) supply zone. This area overlaps with a fresh order block and fair value gap, while resting in the premium half of the internal swing. Equal highs (EQH) clustered at this level signal an ideal liquidity grab, with displacement likely to follow during London/New York Kill Zone overlap. Downside targets from this zone first revisit $3,331, with extended projections toward $3,295 (Fib 1.272 extension).
Fallback Levels
Should the primary zones be invalidated through manipulative displacement or deeper liquidity hunts, fallback areas are defined:
Fallback Buy Zone ($3,310–$3,315): This deeper demand pocket provides secondary positioning if the primary buy zone fails, offering a structural base for recovery back into $3,325–$3,348.
Fallback Sell Zone ($3,360–$3,365): If price sweeps beyond the primary sell zone, this extended premium region becomes the next institutional supply area, targeting retracements back to $3,350–$3,331.
Golden Zone Nomination
Of all identified zones, the Primary Sell Zone ($3,345–$3,350) emerges as the Golden Zone of the day. It represents the highest-probability, institution-grade setup due to its multi-layered confluence, liquidity alignment, and Kill Zone overlap. With the market capped below $3,350 in recent sessions, this level offers the most favorable balance of risk and reward for intraday execution.
Institutional Confirmation
Cross-validation with external institutional sources strengthens this bias. Reuters confirms gold’s range-bound behavior ahead of the Fed’s Jackson Hole summit, while FXStreet highlights fading bullish momentum near $3,330. TradingNews also reinforces the significance of the $3,348–$3,350 cap as resistance, perfectly aligning with our Sell Zone. Together, these insights support the transitional-to-bearish outlook, while acknowledging that long-term structural demand from central banks remains intact.
Conclusion
In summary, gold remains trapped between defined liquidity pools, awaiting a catalyst for directional expansion. For today, the Primary Sell Zone ($3,345–$3,350) stands out as the Golden Zone, offering the most institutionally aligned short opportunity with multiple confirmations. Meanwhile, the Primary Buy Zone ($3,320–$3,325) provides a structurally valid counterpoint should liquidity sweep lower. Until the Fed’s policy guidance becomes clear, traders should expect range-bound behavior with engineered liquidity grabs during London and New York sessions, best exploited by targeting the defined high-probability institutional zones.

19/08/25 Gold Swing LevelsBreakeven yesterday
Set your alerts. Watch the 5 mins (1 min if price spiking)
19/08/25 levels are marked
Always, price action determines trade.
Trade parameters
Entry on 5 min chart
Sl: 20-40pips
TP: 2-4x SL

XAUUSD Setup: Key Levels to Watch Before the Next Big Swing1. Chart Type & Indicators
Instrument : XAUUSD (Gold vs USD)
Timeframe: Likely Daily or 4H (based on structure)
Indicators:
Zig Zag (5, 10) – Helps visualize swing highs/lows and trend reversals.
RSI (14) with signals marked (R for Reversal points).
Price: 3,338.34 USD (at the time of the snapshot).
2. Trend Structure (Price Action)
Previous High: Around 3,500.
Current Price: 3,338, which is down ~4.6% from the recent high.
Key Swings:
Uptrend from 3,167 → 3,499 (+10.5%).
Correction down to 3,120 (-10.8%).
Subsequent swings are smaller, showing reduced volatility.
Observation:
Price is consolidating in a range between 3,250 and 3,450 after a strong rally.
ZigZag indicates lower highs and lower lows recently, signaling a mild downtrend.
3. RSI Analysis
Current RSI: 45.18 (Neutral zone, slightly bearish bias).
Overbought zone (70+) was tested multiple times in the past but failed to hold, causing corrections.
Recent green dot (R) indicates possible oversold bounce near 30 RSI in early August.
Observation:
RSI is not yet bullish, suggesting the price could range or test support before trending up.
4. Key Levels
Resistance Zones:
3,450 – 3,500 (major resistance from previous highs).
Support Zones:
3,300 – 3,250 (strong demand zone).
Below that, 3,120 acts as major support.
5. Volume
Higher volumes were observed during the strong rally (March-April).
The recent volume is lower, indicating a weakening trend strength.
6. Possible Scenarios
Bullish Scenario:
If the price breaks above 3,450 with strong momentum, it can retest 3,500 and potentially move beyond.
Bearish Scenario:
If the price falls below 3,300, we could see 3,250 and 3,120 next.
7. Trading Plan
Long Position: Only on breakout above 3,450 with volume confirmation (target 3,500–3,600).
Short Position : If price closes below 3,300 (target 3,250–3,120).
Range Trading: Between 3,300–3,450 (buy dips near 3,300, sell near 3,450).
Summary: Market is in sideways consolidation after a strong uptrend. RSI suggests neutral to slightly bearish. Watch for a breakout above 3,450 or a breakdown below 3,300.

Reverse Head & Shoulders on XAUUSD (CFD)🟢 Reverse Head & Shoulders on XAUUSD (CFD)
On the 1H chart, the market has recently completed a five-leg structure, which visually aligns with a reverse head & shoulders pattern:
① Left Shoulder: Formed around 3338 with a local support bounce.
② Minor High: First rejection confirming neckline area.
③ Head: The lowest point near 3320, creating a liquidity sweep below previous lows.
④ Right Shoulder: Retesting neckline after liquidity grab.
⑤ Confirmation: Price rejecting higher lows, aligning with bullish order flow.
Key Technical Insights:
Neckline Break: A clean break above the descending neckline (around 3348–3350) could validate the pattern.
Targets:
First target around 3350–3360 (short-term liquidity pool).
Extended target near 3410 if bullish momentum continues.
Invalidation: A drop back below 3320 would invalidate the structure and open the door for deeper bearish continuation.
SMC Context:
The head represents a sweep of liquidity beneath prior lows.
The right shoulder forms with mitigation and BOS signs, suggesting a possible shift in market structure.
If BOS confirms above the neckline, price is likely to fill imbalance zones toward higher liquidity areas.
---
📌 This setup highlights both a classical pattern (reverse H&S) and smart money concepts, merging retail and institutional perspectives for a stronger confirmation bias.

XAUUSD:On August 19thOn August 19th, the news was light. The focus was on the meeting between the US and Russia and the phone call between Ukraine and the US president. The specifics of the discussion are unknown, but it seems to have led to some large orders as a safeguard for Ukraine in the future.
Market-wise, gold prices remained in a narrow range, seemingly awaiting the interest rate decision. Since the Asian session, gold prices have been hovering between 3330 and 3340, with no significant gains or losses. Trading opportunities are slim.
It seems that whether or not this interest rate cut will have a significant impact.
Trading-wise, market sentiment is crucial. Selling high is reasonable, at least between today and tomorrow's data update. Also, when trading, it's important to monitor whether the US dollar index continues its downward trend. If so, gold prices could rebound slightly above 3,350 in the short term. If the US dollar index stops falling, the probability of profiting from shorting increases by approximately 30%.
The trading strategy at the Swing Trading Center primarily focuses on selling high. Remember to manage risk during trading. Set stop-loss and take-profit targets to prevent sudden, one-sided declines or surges that could wipe out your account.

XAUUSD Possible drop to daily support?XAUUSD possibly continuing to trend down with a strong momentum to the downside as previous daily price action is showing strongly bearish. As the price is showing continued series of lower highs, it is possible for the price to slide down to daily support level today at 3323.38 level or further below.
A bearish trade is high probable!

Gold in Tight Range | Waiting for the Big BreakOut After FOMC!Gold is currently consolidating within a narrow range, building momentum for a potential major BreakOut.
After Monday’s liquidity sweep, price has been moving strongly between 332x – 335x, but on the H1 timeframe it still remains locked in a descending channel.
Last week’s CPI & PPI data failed to set a clear direction, which is why this week’s focus will shift to the FOMC meeting. This is expected to deliver the decisive signal for gold’s next big move.
⏳ Early–Mid Week: With fewer major events, gold is likely to continue sideways within the narrow range or remain under mild selling pressure until the FOMC release.
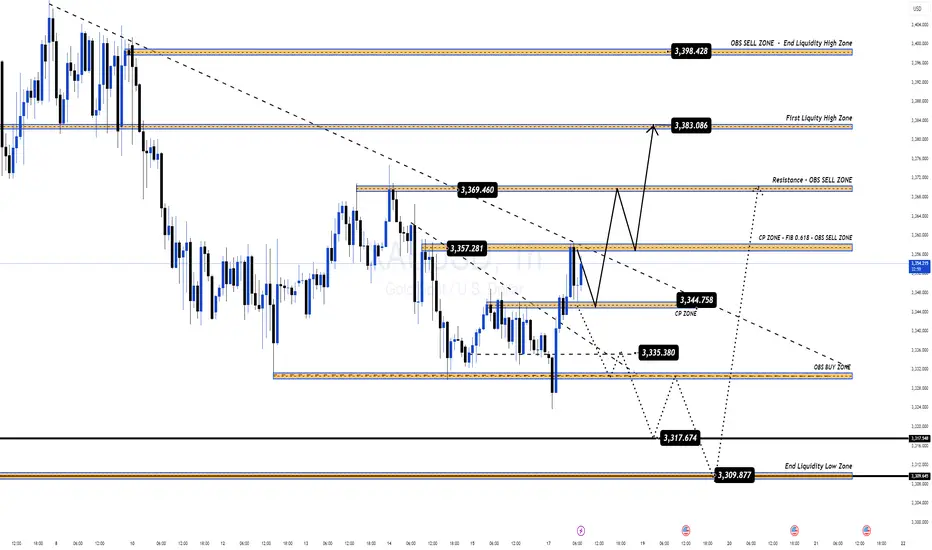
🔑 Key Market Levels
Resistance: 3357 – 3369 – 3383 – 3398
Support: 3335 – 3317 – 3309
📌 Trading Setup
✅ BUY Zone: 3334 – 3332
SL: 3328
TP: 3338 – 3342 – 3346 – 3350 – 3355 – 3360 – 3370 – 3380
👉 A breakout above 336x could trigger a strong rally towards 3383 – 3398.
✅ SELL Zone: 3383 – 3385
SL: 3390
TP: 3378 – 3374 – 3370 – 3360 – 3350
👉 If gold fails at high resistance and reverses, it could sweep liquidity back to 333x – 331x, and potentially deeper towards 329x.
⚠️ Summary
Gold is at a critical decision point: BreakOut or BreakDown.
Before FOMC: expect sideways / mild downside inside H1 channel.
After FOMC: anticipate a strong Pump or Dump that will set the next trend.
🔥 Watch key levels 333x – 336x – 338x closely for market reactions and adjust strategy accordingly.
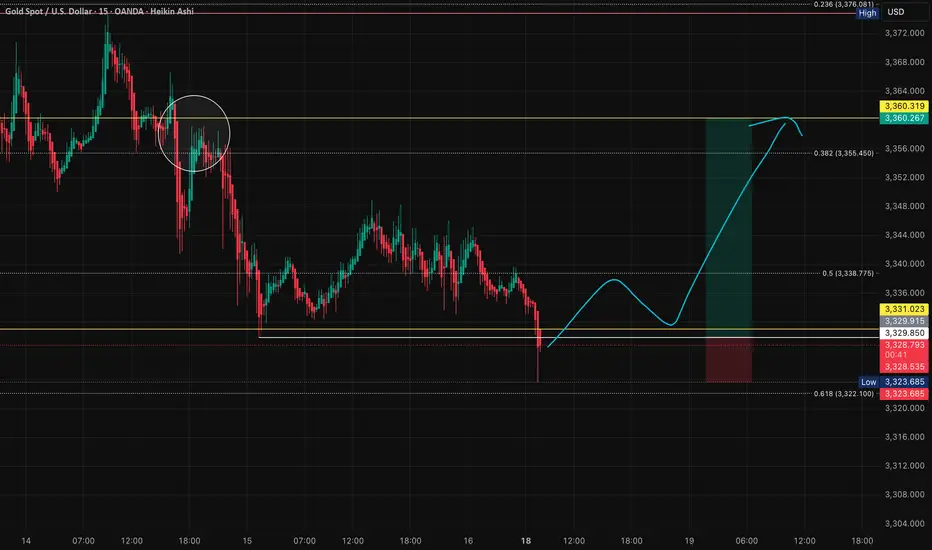
GOLD: 5:1 R/R Setup - Support Hold Entry vs. Breakout PlayI'm sharing my expectations for Gold's movement this week. 📈
The lower yellow horizontal line shown below is a level that held strong twice last week. 💪 I expect this line to hold one more time, followed by a move up to the upper yellow horizontal line. The upper yellow line represents a zone where price repeatedly formed highs last week. 🔄
My thesis is that we'll likely see a move that sweeps the stop losses from the highs marked by the white circles. ⭕ These short-term stop losses often get triggered before price reverses in the opposite direction — a common market dynamic. 🔄
**📍 Entry Strategies:**
🟢 **Primary Setup**: The cleanest entry would be confirmation that the current price level holds, with the lower yellow horizontal line acting as support.
⚡ **Alternative Setup**: However, depending on how price develops, we might not see a clear role reversal pattern before the upward move begins. In that case, a stop entry above resistance would be preferable.
**⚠️ Risk Management:**
🛑 Regardless of entry method, if price breaks below the current low after entry, that's where I'd place my stop loss. When the thesis breaks, you cut the trade — that's my approach, at least.
❌ If we see the current low getting broken with continued downward momentum, the risk-to-reward ratio would deteriorate, and I'd skip the trade entirely. I typically target setups with at least a 5:1 risk-to-reward ratio, though each trader should determine their own minimum threshold. 🎯
📈 **This trade setup offers a risk-to-reward ratio of 5:1.** Without including fees, the breakeven win rate for this trade would be approximately 16.67%. Knowing these figures in advance helps me avoid emotional trading. 🧠
💡 **Pro Tip**: If you often find yourself trading based on emotions, I recommend doing this type of pre-planning and quantifying your setups before execution — it can be a simple yet highly effective improvement. ✅
---
**Trading is simple.** You don't need multiple indicators or dozens of lines on your chart. A clean and simple chart often works best — it keeps your decisions consistent and reduces uncertainty. Sure, it might not look flashy, and my analysis may seem a bit "plain" compared to others… but that's how I like it. If you find this analysis useful, feel free to follow me for more updates.
---
*Disclaimer: This post is for general informational and educational purposes only. It does not constitute financial advice, investment recommendation, or a service targeting specific investors, and should not be considered illegal or restricted information in any jurisdiction.*
GOLD Swing Short!
HI,Traders !
#GOLD made a bearish
Breakout of the key horizontal
Level of 3347.89while trading
In a downtrend so we are
Bearish biased and we will
Be expecting a further
Bearish continuation !
Comment and subscribe to help us grow !

XAUUSD – Bulls Fighting BackAs expected and explained in Friday’s analysis, Gold dipped under 3335, and during today's Asian session, opened with a slide to 3323.
However, shortly after, bulls stepped in, and in the following 5 hours the price climbed strongly, reaching the important resistance at 3360, before entering a normal correction.
At this moment, the correction from 3410 could be complete, and a confirmed break above 3360 would bring the first confirmation for a new bullish leg.
Another factor supporting this view is that the resistance of the falling wedge has already been broken to the upside – a constructive technical signal.
📌 Trading Plan:
I will look to buy dips, anticipating a break above 3360, with targets toward the 3400 handle.
⚠️ A new local low would temporarily pause this bullish scenario.🚀
Disclosure: I am part of TradeNation's Influencer program and receive a monthly fee for using their TradingView charts in my analyses and educational articles.


18/8/68 : XAUUSD ( US. Session )Resistance
3366-3371
3356-3361
3350
Support
3340
3329-3334
3319-3324

8/18: Gold May Fall Below 3300 This WeekGood evening, everyone!
After testing the 3332–3323 key zone today, gold saw its first bullish rebound, pushing price back to the 3352–3358 resistance area. While bulls claimed a small victory here, the broader trend still favors the bears. For a genuine trend reversal, price must hold above 3350 and break through the major daily resistance at 3363. Otherwise, bulls remain under pressure, and as resistance gradually shifts lower over time, a lack of confidence could give bears the chance to drive price below 3300.
In this setup, the 3323–3332 support zone is critical for bulls. Holding it keeps the door open for further upside; losing it would turn 3332-3337( 3343–3348 )into a strong resistance area during rebounds.
Based on this outlook, the short-term strategy leans bearish. If price drops to 3310–3298 tomorrow, it could be a good opportunity to consider long positions. On rebounds, watch resistance at 3323–3328, with 3316–3321 acting as an additional barrier if bulls remain weak.
