XAUUSD Analysis todayHello traders, this is a complete multiple timeframe analysis of this pair. We see could find significant trading opportunities as per analysis upon price action confirmation we may take this trade. Smash the like button if you find value in this analysis and drop a comment if you have any questions or let me know which pair to cover in my next analysis.
Xauusdidea

XAU/USD – Bearish Pressure Under Descending Trendline With Key SXAU/USD is currently trading below a descending trendline, indicating ongoing short-term bearish pressure. Buyers attempted multiple pushes to the upside, but each move resulted in lower highs, showing that sellers are still in control.
Price is now moving toward a key horizontal support zone near 4041.73. A clean break below this level could open the door for further downside momentum, while a strong bounce from this zone may trigger a short-term recovery.
Volume activity is also showing slight weakness on bullish candles, which supports the bearish continuation scenario.
Key Levels to Watch:
Resistance: Descending trendline
Support: 4041.73 zone
Bias: Bearish unless price reclaims the trendline

Elliott Wave Analysis XAUUSD – November 20, 2025
1. Momentum
D1:
The D1 momentum is turning upward, suggesting the market may see a mild bullish retracement or continue moving sideways within a narrow range.
H4:
H4 momentum is also preparing to turn upward. This indicates that today we may see a slight bullish push on the H4 chart, or price may continue to move sideways.
H1:
H1 momentum is preparing to turn upward, meaning we may see a small corrective bounce or continued sideways movement.
________________________________________
2. Wave Structure
D1:
Price is currently moving sideways with small candle bodies. Combined with rising momentum, this suggests the market may continue forming a short-range corrective bounce.
H4:
Our main expectation remains a 5-wave structure for wave Y (purple).
Currently, price may be:
• Entering the early phase of wave 3, or
• Still completing wave 2.
👉 A clear confirmation for wave 3 will only come when price breaks below 4001. At that point, we expect price action to turn fast and steep—characteristics of a true wave 3 decline.
H1:
I have temporarily labeled the current structure as a bearish wave sequence since our primary bias is a developing red wave 3.
In this scenario, price may already be in the early part of wave 3.
❗️If price breaks above the green wave 2 high at 4097, this wave count becomes invalid. It would mean the market is still in red wave 2, and I will update the plan if that happens.
________________________________________
3. Trade Plan
Sell Zone: 4093 – 4096
SL: 4016
TP1: 4000
TP2: 3885
TP3: 3746

Gold (XAU/USD) 4H: SBR and Order Block RetestPrevious Uptrend: Price made a substantial move up, peaking around 4,225 USD.
Impulsive Down Move (X): A strong bearish move occurred from the high, indicating a potential change of character (CHoCH) or market reversal. This rapid decline is labeled with X.
Support/Resistance Flip (SBR): The price initially broke below a previous Support level (SBR), which now seems to be acting as Resistance in the current consolidation phase. This is a classic Support Broken, now Resistance flip.
Swing Low (S): The most recent Swing Low is marked with S, establishing a new range low after the reversal.
Consolidation/Correction (CRT-L, CRT-H): The price is now trading within a range defined by CRT-L (Current Range Top/Low) and CRT-H (Current Range High/Low), which is the current low of the corrective structure.
Order Block (OB): A crucial area is the Order Block (OB), which typically represents an area where significant institutional selling pressure entered the market, causing the impulsive drop. This area often acts as a key supply zone.
Anticipated Move: The curved arrow suggests a likely scenario where the price reaches up to test the Order Block (OB) and the SBR area before potentially continuing the move down towards the range low (CRT-H) or even lower, consistent with the recent shift to a bearish bias. This is an expectation of a correction/pullback into supply followed by a continuation of the trend.

Moving sideways and waiting for a breakout🔍 1. Descending Trendline (red line)
This is an important dynamic resistance.
Price has touched the descending trendline many times and been rejected → the overall trend still leans bearish.
Each retest of the trendline that fails to break gives a sell signal.
👉 Only when price closes above the descending trendline will the short-term trend have a chance to reverse.
🟦 2. Upper Resistance (light blue zone)
This is the area where the market previously made a strong reversal → strong supply zone.
If price breaks the trendline and moves toward this zone, it is a high-probability area where selling pressure may appear again.
🟩 3. Key Support (green zone)
Price has reacted many times at this support zone → strong support.
This is also where price can form a reversal pattern if buyers return.
👉 If price breaks below this support, the bearish trend will continue strongly toward the lower support zone.
🔄 4. Trading Scenarios
Scenario 1: Breakout of the descending trendline → Price moves up to resistance
Price may bounce from the current support area → move up to retest the descending trendline.
If the trendline is broken and retested successfully → target is the major resistance zone above.
For BUY:
Wait for a break & retest of the descending trendline.
BUY GOLD : 4000 - 3998
Stoploss : 3988
Take Profit : 100-300-500pips
SELL GOLD : 4130 - 4132
Stoploss : 4142
Take Profit : 100-300-500pips

XAUUSD set to retest weekly low?NFP positive data, has boosted DXY to existing bullish trend, as mirror effect on GOLD is continuing it's shorter term downtrend.
with back to back 2 daily doji at the weekly level, XAUUSD with today's Sydney session 4h closed with bearish engulfing candle with crossover of 10ema and 20ema signaling possible further drop.
Due to extended FVG below 4055.00 level, is price coming to retest weekly low?
Keep eye for more updates !

Gold (XAUUSD): Long Trade from Demand ZoneIdentified Trading Setup
The chart illustrates a potential long (buy) trade setup based on a specific strategy, likely related to Smart Money Concepts (SMC) or order flow analysis:
Support/Demand Zone: The entry is planned around the grey box zone, specifically at the CRT-L (Current Range Low) area, implying a belief that this is a strong level for a price reversal.
SSS (Sell-Side Liquidity): The label "SSS" points to a level around $4,030 which was recently broken, suggesting the initial selling pressure has subsided or that liquidity has been swept.
Projected Path: The black line with arrows indicates the expected price path—a significant reversal from the low zone, followed by an uptrend towards the target.
Target (Take Profit): The trade aims for the CRT-H (Current Range High) around $4,092.85. This level represents a strong area of previous supply or resistance that the price is projected to retest.
💡 Conclusion
The analysis suggests a contrarian trade anticipating a bounce off a key support/demand zone for a retracement back toward recent high-level resistance. The blue shaded box represents the potential profit area for this long setup.

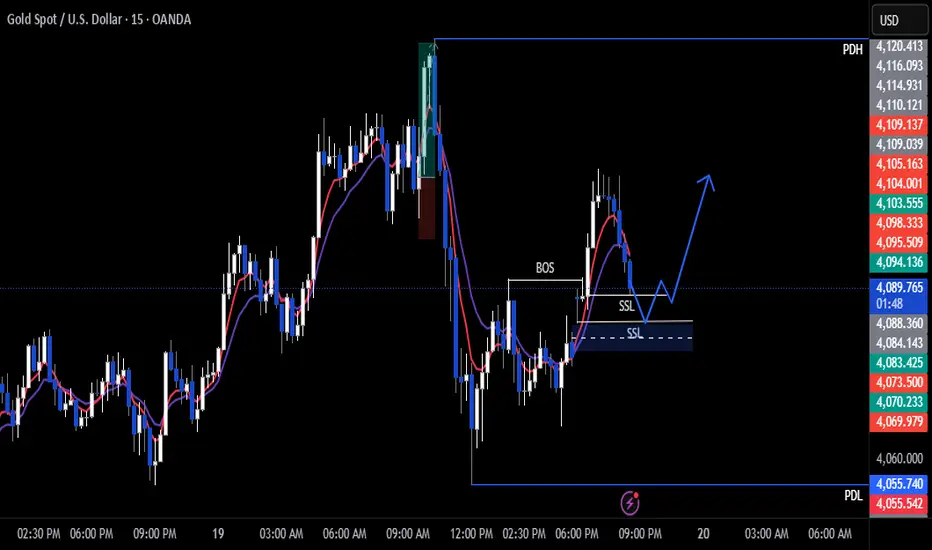
Gold Trade Secured 350 Pipsprice manipulated higher sweeping BSL to then engulf and BOS to the downside to target SSL

Gold Trade Set Up Nov 20 2025overall im still bearish on gold. I will want to see price respect the fib levels and sweep BSL followed by internal 5m-15m bearish engulfing and CSID to target SSL and lower fib levels

XAUUSD: Short-Term Downtrend Active Below FVG/Supply ZoneKey Technical Points
Major Resistance (X): The swing high marked 'X' around $4,240 served as a strong ceiling, initiating the current downtrend.
Supply Zone (D / FVG): The shaded gray box, labeled 'D / FVG' (Demand/Fair Value Gap), is a critical supply area (resistance) located between approximately $4,100 and $4,140. The price has reacted negatively to this zone, confirming its importance as a selling region.
Bearish Channel: Since the rejection from the major high, the price has been contained within a clear descending channel, indicating sustained short-term bearish momentum.
Current Action: The price is trading near the mid-point of the channel, currently at $4,064.40. The market structure suggests a pattern of lower highs and lower lows is still active.
Outlook
The immediate outlook remains bearish as long as the price stays within the descending channel and below the D / FVG supply zone. The most probable next move is a continuation toward the lower boundary of the channel, potentially testing the $4,000 psychological support level.

GoldXAUUSD
- Bearish Channel as an corrective pattern in Short Time Frame
- Change of Characteristics
- Fair Value Gap
- Demand Zone
- Completed " 12345 " Impulsive Waves and " A " Corrective Wave

XAUUSD – Bearish Retracement Into Supply Zones With Potential Sh1. Overall Context
The market recently had a strong bearish leg after rejecting the upper resistance zone (labelled HIGH PROB POI).
Price is currently retracing upward into a series of supply zones, indicating a potential area for continuation shorts.
2. Key Zones
High Probability POI (Supply)
This is the upper beige zone.
Previously caused a strong sell-off → confirms strong institutional presence.
If price pushes this high again, it may offer the most reliable reversal area.
Extreme POI
The central horizontal zone marked “EXTREME POI”.
Current price is tapping into it.
Market may react here if sellers decide to re-enter early.
3. Internal Structure
A series of labeled SSS (Sell-Side Sweeps) indicate liquidity grabs beneath short-term lows.
After sweeping these lows, price retraced upwards, likely moving toward premium territory to fill sell orders.
The 80% level marked on the chart seems to be your optimal entry zone within the inefficiency/imbalance.
4. Entry Idea
Your marked entry level 4080 sits inside the grey supply block.
This aligns with:
Prior breakdown zones
Fresh supply
Retracement to premium pricing
Liquidity sweep structure
This creates a high-probability short setup, assuming the trend continues downward.
5. Expectation

XAUUSD : Bearish Flip Targets $3930 LiquidityKey Observations and Interpretation
Previous Trend: The price experienced a strong bullish move, peaking around the $4,240 level, followed by a significant retracement.
Break of Structure (BOS): There was a previous Break of Structure (BOS) to the upside around $4,040, which indicated the start of the recent upward move. The price has now retraced back to and below this level.
Market Structure Shift/Change of Character: The move from the $4,240 peak down to the recent low near $3,990, followed by a lower high (X) at approximately $4,120, suggests a potential shift in market character from bullish to bearish.
Inducement/Minor Liquidity Sweep (I/S): The price action that led up to the high at X seems to have swept minor internal liquidity (I/S) before the larger drop.
Demand Zone/Fair Value Gap (D/FVG): The shaded area between roughly $4,040 and $4,070 represents a zone that was likely a prior demand zone or contains a Fair Value Gap (FVG). Price is currently interacting with this zone. In a bearish scenario, this zone is expected to act as resistance (a supply zone) after the structure shift.
Target Liquidity ($$$): The chart highlights multiple clear liquidity targets below the current price, marked by the triple dollar signs ($$$). These are levels where retail traders have likely placed stop-loss orders or where sell-limit orders are resting. These levels are approximately:
$3,980
$3,960
$3,930
📉 Projected Move
The analysis projects a likely scenario where the price:
Tests/Fills the D/FVG Zone: The price may experience a small bounce or consolidation within the $4,040 - $4,070 D/FVG zone (now acting as potential resistance/supply).
Continuation Lower: From this zone, the expectation is for the price to continue its move down.
Liquidity Sweep: The primary targets for the bearish move are the highlighted liquidity levels ($$$) below the $4,000 psychological level, with the deepest target around $3,930.

GOLD FALTERS POST-FOMC – BUY OR SELL NOW?1. Market Context
Yesterday, the market had a risk-averse sentiment, so safe-haven flows poured into gold, pushing the price to test the resistance area of 4130–4133 – where gold had previously failed multiple times.
During the US session, the FOMC minutes were released with a rather "hawkish" tone:
The Fed is not yet ready to cut interest rates.
Wants to see more data before December.
Some members even want to maintain a tighter stance.
This news weakened gold's upward momentum, and the price adjusted down from the peak.
2. BUY Zones for the Day
🎯 Ideal BUY (highest priority):
4010
3998
🎯 Extended BUY:
4010 – 4015
4035 – 4040
→ These are reliable support zones, suitable for a trading style that catches the rebound.
3. SELL Zones
🔥 Strong SELL (hard resistance):
4130 – 4133
🔥 Extended SELL:
4148 – 4150
→ Both zones coincide with resistance that has reacted well multiple times before.
4. Special Zone to Watch – TREND DECISION
📌 4080 – 4085 (Fibo 0.5 – 0.618)
If the price clearly breaks 4085, gold may change trend for the day → prioritize BUY on breakout, limit SELL.
If 4085 holds, the market remains sideways within the range and continues the strategy of BUY support – SELL resistance.
5. Suggested Trading Strategy
Style: SL 10 points – TP 10 points
Priority: BUY at clear support – SELL at strong resistance
Avoid trading in the middle zone (noise – easy to hit SL).
Place orders only when the price hits the zone – don't fomo in between.

Gold Trade Set Up Asia Session Nov 19 2025Gold Pushed down during New York session sweep SSL but then closes above 4h swing low and BOS to the upside on the 1h and 15m so i want to see internal SSL swept along with a test of the gap to then wait for 5m-15m bullish engulfing candle and CISD to target PDH
Gold Price Outlook: Strong Support Rebound Toward 4,255XAU/USD – Technical Analysis (16 Nov 2025)
Overall Market Context
Gold experienced a sharp decline after breaking out of its rising channel, reaching a major support zone between 4,050 – 4,065. Price is currently stabilizing above that support, attempting to form a short-term base for a bullish correction.
1. Key Technical Zones
🔵 Major Support Zone (Strong Demand)
4,050 – 4,065
This zone has acted as the first strong buy reaction after the breakdown.
Multiple wick rejections show aggressive buyers waiting here.
A clean break below → opens deeper correction towards 4,025 – 4,030.
🟦 Immediate Resistance Zones
4,100 – 4,110
First intraday resistance.
Price must break above this to confirm bullish momentum.
4,120 – 4,130
Secondary resistance.
A break above this confirms the reversal structure.
🎯 Main Bullish Target
4,255 – 4,260
This aligns with:
Former channel midline projection
Fibonacci extension zone
Previous major swing high area on the chart
The chart clearly marks the bull target at 4,255.718.
2. Market Structure Breakdown
🔻 Previous Trend
Price was trading inside an ascending channel (yellow lines).
Broke down sharply → entered correction phase.
Now attempting a bullish re-entry after hitting strong support.
🔄 Current Price Behavior
Price is forming higher lows on the micro-trend after the spike down.
A short-term wedge/bull flag structure is developing.
Bulls are defending support aggressively.
3. Expected Move (Based on Your Chart Projection)
Primary Bullish Scenario ✔️ (Most Probable)
Hold above 4,070 – 4,085
Break above 4,100 → 4,110
Pullback retest
Push toward 4,130
Bull continuation toward the target 4,255
This matches the yellow arrow path drawn on your chart.
4. Bearish Alternative Scenario ❗
If gold breaks below 4,050 with strong momentum:
Next support → 4,025 – 4,030
Deeper correction back toward 3,990–4,000 zone becomes possible.
But currently buyers are controlling the support zone.
5. Summary
Structure: Reversal attempt after channel breakdown
Momentum: Neutral → turning bullish
Key Level to Break: 4,110
Bull Target: 4,255
Support Holding: Strong
Bias: Bullish above 4,070, bearish only below 4,050 RUS:NG1! RUS:SI1! RUS:GD1! RUS:SV1! RUS:USDRUB.P RUS:MX1! RUS:NA1! RUS:RI1! RUS:IRUS.P RUS:PD1! RUS:ED1!
If you want, I can also generate:
✅ Trading signal in multiple languages
✅ Short-term & long-term forecast
✅ Buy/Sell zones with risk management
Just tell me!

Elliott Wave Analysis – XAUUSD | 19/11/2025
1. Momentum
• D1:
Daily momentum has started to reverse. If today’s D1 candle closes bullish, the reversal will be confirmed, and we can expect an upward move in the coming days.
• H4:
H4 momentum has already reversed from the oversold zone. This suggests price may either pull back slightly or move sideways in the short term.
• H1:
H1 momentum is turning upward, indicating that price may produce a short-term rise or continue moving sideways with a mild bullish bias.
________________________________________
2. Wave Structure
• D1 Structure:
Price is currently inside the purple Y wave. After the recent decline and with momentum preparing to reverse, a bullish correction is likely.
This upcoming move could be:
• Wave 2 of the larger 5-wave purple structure, or
• A new bullish trend if price breaks the previous high when D1 momentum reaches the overbought zone.
• H4 Structure:
A 5-wave green structure has completed. Therefore, a corrective move is expected — either:
• A 3-wave ABC correction for wave 2, or
• A new impulsive 5-wave structure if this marks the beginning of a new uptrend.
If price rises slowly with overlapping waves, we lean toward a 3-wave correction.
If price rises decisively with minimal overlap, we lean toward an impulsive 5-wave structure.
• H1 Structure:
The 5-wave green pattern is clear. The current upward correction shows strong wave overlap — a sign of an ABC corrective move.
This scenario is reinforced if price continues to move slowly and sideways with mild upward bias.
Price is now inside a large liquidity zone at 4046 – 4096.
Sideways movement is expected here; if H1 candles compress tightly, avoid long-term trades and focus on short take-profit exits.
________________________________________
3. ABC Correction Target
I continue to expect the corrective ABC wave to complete at 4145, which is our ideal sell zone.
If ABC finishes at 4145 and price reverses strongly:
• We will likely enter wave 3 of the purple Y wave
• This decline will be fast, sharp, and decisive
• Once wave 3 is confirmed, we can hold sell positions longer for extended profits
________________________________________
4. Trading Plan
🔻 Sell Zone: 4145 – 4147
🛑 Stop Loss: 4165
🎯 Take Profit Targets:
• TP1: 4096
• TP2: 3897
• TP3: 3746

XAUUSD - Time to buy gold...XAUUSD was recently in a short term downtrend for a few weeks but has now shown some clear bullish movements ahead. XAUUSD (Gold) has broken out of a downward trend channel that was acting as strong resistance, The price is very likely to head to the next strong resistance level which is marked as the take profit zone (green line). Time to buy!

GOLD Breakout Done , Long Setup Valid To Get 300 Pips !Here is My 15 Min Gold Chart , and here is my opinion , the price going up very good and we have a 4H Candle closure above our Res 4100.00 And Perfect Breakout and this give us a very good confirmation , so we have a good confirmation now to can buy after the price go back to retest the broken area 4100.00 For the first time and hope it will give us a good chance to enter with good stop loss , and we can be targeting 100 to 300 pips . if we have a daily closure below this area this mean this idea will not be valid anymore .
Reasons To Enter :
1- Perfect Breakout .
2- Clear Bullish Price Action .
3- Bigger T.F Giving Good Bullish P.A .
4- The Price Take The Last High .
5- Perfect 4H Closure .

Gold Trade Set Up Nov 19 2025Gold is trading above PDH and has shifted to bullish structure now making HH/HL on the 1h and has filled the 4h FVG already, so i want to first see a test of 1h demand and/or 75 fib to then looking for internal 5m-15m bullish engulfing candle and CISD to take price higher to BSL

GoldXAUUSD
- Fibonacci Level - 50.00% / 61.80%
- Demand Zone
- Completed " 12345 " Impulsive Waves and " A " Corrective Wave
- Fair Value Gap
- S / R Level

Elliott Wave Analysis – XAUUSD (18 November 2025)1️⃣ Momentum
D1 Timeframe:
D1 momentum is approaching the oversold zone, signaling that a potential reversal may be forming.
Although this does not confirm a daily reversal yet, it is an early warning that bearish momentum may be weakening soon.
H4 Timeframe:
H4 momentum is also nearing the oversold zone, suggesting that a reversal or recovery bounce could appear shortly.
H1 Timeframe:
H1 momentum is beginning to turn upward, indicating that in the short term we can expect a bullish pullback on the H1 timeframe.
________________________________________
2️⃣ Wave Structure
D1 Wave Structure:
Price is currently still moving inside wave Y.
With D1 momentum entering the oversold zone, we do not have a confirmed reversal yet, but it alerts us to the rising probability of one forming soon.
Wave W previously took 8 days to complete. Since momentum cycles often form in 5–8 daily candles, this time structure can be used as a reference when observing the development of wave Y, as waves W and Y tend to share similar timing characteristics.
________________________________________
H4 Wave Structure:
On H4, a 5-wave sequence (blue) has completed, and price is currently in wave 5.
Combined with D1 momentum nearing oversold, this leads to three possible scenarios:
1️⃣ Scenario 1:
This 5-wave decline is wave (1) of a larger 5-wave structure inside purple wave Y.
If so, once wave (5) finishes, we will see a wave (2) pullback, aligning with the upcoming D1 momentum reversal.
2️⃣ Scenario 2:
Wave Y may end earlier than expected, failing to reach the 3746 target.
If this occurs, a new trend could begin sooner, coinciding with the next D1 momentum reversal.
3️⃣ Scenario 3:
D1 momentum enters the oversold zone but remains compressed there, dragging price lower for a deeper extension before any reversal happens.
These three possibilities help guide our chart observation and prepare for multiple outcomes.
________________________________________
H1 Wave Structure:
On H1, price is also forming a 5-wave decline (blue) and is currently in wave 5.
The projected target for wave 5 is around 3958, which is where we expect a Buy setup.
Additionally, RSI is showing bullish divergence across the lows, reinforcing the probability that price is completing wave 5 and preparing for a short-term bounce.
________________________________________
3️⃣ Trade Plan
• Buy Zone: 3959 – 3957
• Stop Loss: 3938
• TP1: 4000
• TP2: 4096
• TP3: 4145

XAUUSD – Resistance Rejection Anticipated Toward 3,997EMA 50 (blue) trending below price but still pointing downward.
EMA 200 (black) well above price, suggesting the overall larger trend remains bearish.
A large resistance zone marked around 4,095–4,115.
Price is currently around 4,060.
The analyst has drawn arrows indicating a potential retracement up into the resistance zone, followed by a sell-off toward a target around 3,997.
🧠 Interpretation of the Analysis on the Chart
1. Resistance Zone
The shaded blue region marks a major supply area where:
Price previously consolidated
Sellers dominated before pushing down
This area coincides with the region where:
Price might retest the 200 EMA overhead
Previous structure created liquidity
2. Expected Move
The arrows suggest the following scenario:
Price rallies slightly higher (likely to tap the resistance zone or sweep local highs).
After that, it rejects from resistance, respecting the bearish higher-timeframe direction.
A continuation move leads price down to the target at around 3,997.
This aligns with:
Trend continuation
Mean-reversion to the bearish EMA structure
🎯 Target Level
3,997 is likely selected because:
It’s a previous swing low
It aligns with a liquidity pool or demand imbalance
It is a natural downside magnet when momentum stays bearish
🧭 Bottom Line
The chart you posted reflects a bearish setup anticipating:
A pullback into resistance, followed by
A sell-off targeting ~3,997
This matches common Smart Money Concepts (SMC) ideas: mitigation → rejection → continuation.
