Gold Faces Rejection at Resistance Zone – Potential Bearish CorrAnalysis:
The gold price (XAU/USD) is currently testing a strong resistance zone near $4,235–$4,240, where previous bullish momentum appears to be slowing down. Sellers are showing interest in this area, suggesting a potential bearish reversal or correction phase.
A clear support zone lies around $4,140–$4,150, which serves as the target for the expected downward move. If price breaks below this support, further declines could extend toward the next demand zone.
However, if gold breaks and closes above the resistance zone with strong volume, it could invalidate this bearish setup and open the path to new highs.
Key Points:
Resistance Zone: $4,235 – $4,240
Support Zone: $4,140 – $4,150
Short-term Bias: Bearish correction expected
Target: Support zone near $4,145
Xauusdidea

ANFIBO | Gold XAUUSD - BUY until Uptrend breaks [11.14.2025]Hi guys, Anfibo's here!
GOLD Analysis – Daily Trading Plan
Overall Picture:
Yesterday’s buy plan at 4185 worked perfectly, giving us a clean 250 pips almost immediately. With this momentum, our weekly target of 2000 pips is clearly achievable — as long as we stay disciplined and follow the plan without letting market noise disrupt our strategy. At the moment, price action shows gold holding firmly above a strong support at 4130, while the nearest resistance zones are forming at 4240 and 4255. These levels will define today’s trading opportunities as the market prepares for its next move within the ongoing bullish structure.
Trading Plan for Today:
>>> BUY ZONE:
(1) ENTRY: 4130 – 4145
SL: 4120
TP: 4205 – 4240
(2) ENTRY: 4180 – 4165 (Trend continuation entry)
SL: 4155
TP: 4235 – 4255
>>> SELL ZONE (Scalp Only):
ENTRY: 4255 – 4265
SL: 4270
TP: 4200 – 4130
Risk Management:
- Stick to small–medium positions while gold remains in a compression phase.
- Buy setups should be prioritized as long as 4130 holds.
- Keep Risk:Reward ≥ 1:2 and avoid chasing candles near resistance.
- Reassess bias only if price breaks and closes below 4130 with strong momentum.
Conclusion:
Gold continues to respect our levels beautifully, and the bullish structure remains intact above 4130 support. As long as this area holds, we maintain the bias of buying dips and targeting the upper resistance zones at 4240–4255. Stay patient, follow the plan, and let the setups come to you — consistency is what delivers weekly gains.
HAVE A NICE DAY, GUYS!

Xauusd Update Xauusd Breakout Last Resistance
Now We Have best Buying Opportunity
Around 4162
Tp 4372
Sl 4088
Buy Sell Your Own Research I Am Not Responsible Of Your Any Lose
Stay Alert For More Updates

ANFIBO | GOLD/XAUUSD - Keep BUYING bro [11.13.2025]I am ANFIBO!
GOLD Analysis – Daily Trading Plan
Overall Picture:
Once again, the market moved exactly as planned — our Buy entry at 4115 has delivered an impressive 1,300 pips in profit! This further reinforces the importance of trusting the strategy and following the trend. OANDA:XAUUSD continues to show strong bullish momentum, though it’s now entering a consolidation phase, with price likely to accumulate sideways between 4185 and 4220 on the H1 timeframe. As long as the price holds above 4170, the bullish channel structure remains intact. Today’s plan will be to buy near support within this consolidation range and ride the next upward impulse once momentum resumes.
Trading Plan for Today:
>>> BUY ZONE:
ENTRY: 4180 – 4195
SL: 4170
TP: 4240 – 4280 - ...
>>> SELL ZONE (Short-term scalp only):
ENTRY: 4235 – 4245
SL: 4250
TP: 4220
Risk Management:
- Continue to prioritize Buy positions in alignment with the dominant H1 uptrend.
- Avoid overleveraging near resistance, as volatility may spike during consolidation.
- Maintain Risk:Reward ≥ 1:2 on every setup.
- Only shift to a bearish bias if price breaks and closes below 4170 with strong momentum.
Conclusion:
Gold remains firmly bullish, and our previous buy setup has paid off handsomely. For today, the market is likely to move sideways between 4185 and 4220, forming a healthy accumulation zone before its next leg up. As long as 4170 holds, the trend is still our friend — we continue to buy the dips and aim for the 4240–4280 targets.
Stay disciplined, trust the plan, and let the market reward your patience.
WISH YOU THE BEST PROFIT!

Gold Next zoneGold (XAU/USD) is trading near 4229, holding above support at 4211. A bullish move toward the 4300 target is expected if price breaks above resistance around 4238.

Elliott Wave Analysis – XAUUSD | 13/11/2025🔸 1. Momentum
D1 Timeframe
• D1 momentum continues to close inside the overbought zone, signaling weakening buying pressure.
• A bearish reversal may occur at any moment.
H4 Timeframe
• H4 momentum is also in the overbought zone and starting to contract → a potential signal that H4 may soon turn downward.
H1 Timeframe
• H1 momentum is currently oversold, so a short-term bounce is likely to push momentum back toward the overbought area.
________________________________________
🔸 2. Wave Structure
D1 Structure
• No significant change compared to yesterday; price is still heading toward the completion zone of wave X.
H4 Structure
• Price is inside wave X and currently reaching the 0.618 Fibonacci retracement of wave W (purple).
• This area aligns with both D1 and H4 momentum, creating a strong reversal confluence.
• We wait for an H4 bearish close to confirm the potential top of wave X.
• Note: The current H4 candle is compressing tightly, so one more upward spike is still possible before reversal.
H1 Structure
• Within the red 5-wave sequence, a smaller 5-wave black structure is developing.
• RSI showed a bearish divergence at the top of wave 3 (black) → early signal of a wave 5 top forming.
• Based on wave projections, wave 5 black (which also completes wave 5 red and wave X) may extend into:
o 4223 (0.382 Fibo of wave 1–3)
o 4248 (0.618 Fibo of wave 1–3)
Confluence for wave-top formation:
• RSI divergence between wave 3 and wave 5
• H1 momentum rising into overbought then reversing
→ This supports the expectation of wave X topping around these zones.
________________________________________
🔸 3. Trading Plan
You have three entry options, depending on your trading style:
✅ 1. Sell Limit: 4223 – 4225
• SL: 4233
• TP1: 4181
• TP2: 4145
• TP3: 4046
✅ 2. Sell Limit: 4248 – 4250
• SL: 4260
• TP1: 4181
• TP2: 4145
• TP3: 4046
✅ 3. Sell Stop at 4181
• Trigger only when the candle closes below 4181 (wave 4 black low).
• This method offers stronger confirmation, since structure breaks down before entry.
________________________________________
📌 Summary
• Wave X is approaching its final target area and multiple signals support a potential top.
• H1 may still push higher toward 4223–4248 before reversing.
• These two zones are strong sell areas with momentum and divergence confluence.
• All three entry methods (limit – limit – breakout) provide strategic options depending on risk preference.

Gold Trade Set Up Nov 13 2025Gold is overbought and has taken out all BSL besides ATH so if price can stay closed below this bearish 4h FVG and engulf this 1h candle i will look for sells down to lower SSL levels but if it fails to close below and continues to make HH.HL on the 1h and 15 i will look for buys to continue higher

GoldXAUUSD
- Completed " 123 " Impulsive Waves
- Break of Structure
- Higher High - Higher Low
- RSI - Divergence
- Fair Value Gap

gold await breakout#XAUUSD price still bullish which decline holds between D1 high to 4252 for main selling rejection.
We await for 2 times breakout below 4220 to buy till 4252 which holds bearish retrace.
Above 4252 breakout sell, target 4180-4150 which holds reverse on buy, SL 4266.
Above the rectangle 4268-72 H1 closure holds bullish continuation till 4310.

Gold Bullish Continuation Setup from Ascending Channel Support✅ Analysis – XAUUSD (Gold)
1. Market Structure
Price is moving inside a clean ascending channel, showing a sustained uptrend.
The lower boundary (rejection line) is acting as strong support, where buyers have entered repeatedly.
The current price action is showing a pullback toward this support area, which is typical before a continuation move higher.
2. Current Price Action
Price has retraced back into the buy zone near the channel support.
Candlesticks show slowing bearish momentum, suggesting buyers may soon take control.
Your chart projection indicates a possible bullish bounce.
3. Trade Setup
✅ Buy Zone: Near the rejection line / lower channel
✅ SL (Stop-Loss): Below the support line — smart placement to protect against channel breakdown
✅ Target: Upper resistance of the channel (around 4230 – 4260 zone)
This gives a good risk-to-reward ratio, based on trend continuation.
4. Bullish Expectation
As long as price stays above the rejection line, the uptrend remains valid.
A bounce from this zone is likely to push price toward the target box.

XAUUSD: Potential Bearish Reversal from 4H Fair Value Gap (FVG)Key Observations and Analysis
Recent Market Structure: The price action showed signs of accumulation near the lows (indicated by the (SMT) or Smart Money Trap/Swing point) and then broke a previous swing high (marked as MSS or Market Structure Shift), confirming a strong shift to a bullish trend recently.
Impulsive Rally and Break of Structure (BOS): The strong upward movement created new highs and broke a previous resistance level (marked as BOS or Break of Structure), confirming the continuation of the short-term bullish momentum.
The 4H Fair Value Gap (4H / FVG): The large gray shaded rectangle is labeled as a 4H / FVG (Fair Value Gap), also sometimes referred to as an Imbalance. This is an area where the market moved very quickly, leaving a price inefficiency (a gap between the high/low of specific candles). These gaps are often viewed as magnets that the price will return to in order to "fill" or "mitigate" the inefficiency before continuing its trend or reversing.
Bearish Scenario (The Setup):
The price has aggressively moved up and is currently near the lower boundary of the 4H / FVG.
The setup suggests a Contraction (CRT) phase. The high of this potential contraction is labeled CRT-L (Contraction Low, but likely indicating the upper boundary of the trade range).
The large green arrow shows the anticipated move: a reversal upon entering or touching the FVG/Supply Zone, leading to a move down to target the recent low of the strong rally (labeled CRT-H, indicating the high of the previous move/target low).
The target for the potential retracement is the area around the previous BOS level and the swing low that initiated the final push, around $4,120.00.
Interpretation: The chart suggests that the recent strong rally might be due for a deep retracement or even a short-term reversal, as the price is entering a potential supply/distribution zone created by the Fair Value Gap.
Conclusion
The chart presents a trade idea based on the mitigation of the 4H Fair Value Gap. A bearish entry is anticipated once the price fully enters the FVG, with the aim of capturing the move back down to the recent structure low (CRT-H). This is a common setup in SMC analysis, expecting the market to re-balance before the next major move.

Gold (XAU/USD) Testing Key ResistanceAnalysis:
Gold (XAU/USD) is currently trading around 4145, approaching a significant resistance zone between 4100 and 4120, marked as the first target region. This level previously acted as strong resistance, and price may experience a temporary pullback before resuming upward momentum.
The strong psychological support zone near 3890–3920 served as a solid foundation for the recent bullish reversal, confirmed by double-bottom formations and consistent higher highs.
If gold maintains momentum above 4120, the next upside target lies around 4210, aligning with previous structural highs and a major supply zone. However, rejection from the current resistance could trigger a short-term retracement toward 4100 before another push upward.
Summary:
Immediate Resistance: 4100–4120
Next Target: 4210
Key Support: 3890–3920
Bias: Bullish above 4100, potential retracement before continuation

XAU/USD 13 November 2025 Intraday AnalysisH4 Analysis:
-> Swing: Bullish.
-> Internal: Bullish.
Analysis and bias remains the same as analysis dated 20 October 2025.
Price has printed as per previous intraday expectation by printing a bearish CHoCH which indicates, but not confirms, bullish pullback phase initiation.
Price is currently trading within an established internal range, however, I will continue to monitor price with regards to depth of pullback.
Intraday expectation:
Price to continue bearish, react at either discount of 50% internal EQ, or H4 supply zone before targeting weak internal high priced at 4,380.990.
Note:
The Federal Reserve’s sustained dovish stance, coupled with ongoing geopolitical uncertainties, is likely to prolong heightened volatility in the gold market. Given this elevated risk environment, traders should exercise caution and recalibrate risk management strategies to navigate potential price fluctuations effectively.
Additionally, gold pricing remains sensitive to broader macroeconomic developments, including policy decisions under President Trump. Shifts in geopolitical strategy and economic directives could further amplify uncertainty, contributing to market repricing dynamics.
H4 Chart:
M15 Analysis:
-> Swing: Bullish.
-> Internal: Bullish.
Price did not print according to my analysis. Price instead targeted strong internal high by printing a bullish iBOS.
This could potentially indicate H4 bearish pullback phase is complete.
Price has since printed a couple of bearish CHoCH's, however, I will not mark them as such due to very insignificant depth of pullback.
Intraday expectation:
Price to indicate bearish pullback phase initiation by printing a bearish CHoCH. CHoCH positioning is demoted with a blue horizontal dotted line.
Note:
Gold remains highly volatile amid the Federal Reserve's continued dovish stance, persistent and escalating geopolitical uncertainties. Traders should implement robust risk management strategies and remain vigilant, as price swings may become more pronounced in this elevated volatility environment.
Additionally, President Trump’s tariff announcements, particularly against China, are expected to further amplify market turbulence, potentially triggering sharp price fluctuations and whipsaws.
M15 Chart:

XAUUSD: Bullish Continuation Setup from Order BlocksKey Observations and Analysis
Strong Impulsive Move: The chart shows a significant, sharp upward move (a "pump") indicated by a large green candle that broke out of the prior consolidation area (the lower "D / OB" zone). This move highlights strong buying pressure and momentum.
Daily Order Block (D / OB): The large gray box labeled "D / OB" represents a potential Daily Order Block or a significant demand zone where institutional selling previously occurred before the current rally. The market rallied strongly from this area, confirming it as a potential accumulation zone or demand zone.
Current Consolidation and 1H/OB: Following the initial impulsive move, the price has entered a period of smaller consolidation/pullback. The smaller shaded area labeled "1H / OB" represents a 1-Hour Order Block. This area is often viewed as the key demand zone that initiated the last segment of the strong push up.
Bullish Scenario: The analysis suggests a bullish continuation is likely. The green arrow indicates the anticipated price action:
A pullback or retracement (the 'W' shape) into the 1H / OB zone. This pullback often "retests" or "mitigates" the demand in the order block.
A reversal and continuation of the uptrend, targeting the recent high around $4,220.00 and potentially higher.
Structure: The current price action (above the D/OB and consolidating) suggests the trend is bullish and the market is preparing for the next leg up after a shallow retracement.
Conclusion
The chart displays a clear bullish continuation setup. Traders utilizing this model would look for long (buy) entries within or just above the 1H / OB area, targeting the previous swing high as a minimum objective. The analysis is predicated on the idea that the strong impulsive move will be followed by a minor correction before resuming the primary uptrend.

XAUUSD Daily Chart Analysis: Potential Reversal from Premium FVGKey Observations & SMC Components
Strong Bullish Trend: The price experienced a significant rally leading up to the high on October 20th.
Break of Structure (BOS): The price recently broke above a previous swing high, marked as BOS (Break of Structure). This indicates a continuation of the short-term bullish momentum or a shift from bearish to bullish on lower timeframes.
Inefficiency/Fair Value Gap (D / FVG): The shaded gray area is identified as a D / FVG (Daily / Fair Value Gap). This area represents an imbalance in the market, often targeted for a price reaction or fill. Since the price is currently trading above the previous consolidation (near the high of the recent range), this FVG is considered to be in a Premium area.
Current Price Action: The price has moved into the lower part of the FVG.
Liquidity Grab/Equal Lows (X): The level marked X represents a prior swing high that was swept by the subsequent move, which then led to the BOS. It may also represent an area of liquidity (e.g., stops placed below that swing high) that was recently taken.
Projected Move (Arrow): The black arrow suggests a potential short trade from within the FVG, targeting the area indicated by the dotted line below the most recent swing high. This target likely represents a liquidity void or the internal liquidity of the most recent up move (perhaps an equal low or an old FVG/Imbalance on a lower timeframe).
Interpretation and Potential Scenario
The analysis suggests a trader is looking for a reaction/reversal from the Daily Fair Value Gap (FVG) in the Premium area.
Entry Trigger: The trader would likely look for a bearish confirmation (e.g., a change of character/market structure shift on a lower timeframe like H4 or H1) once the price is fully within or near the top of the FVG.
Target: The projected target (dotted line) suggests a move to correct the recent impulsive up-leg, potentially aiming for an internal liquidity point or the recent higher low before a potential continuation of the broader bullish trend, or even a deeper retracement.
In summary, the chart outlines a high-probability SMC short setup based on a retracement into a Premium FVG.

XAUUSD🟡 #Xauusdgold testing key resistance near 4190–4200 after a strong rally.
Breakout above = 🚀 targets 4240 / 4288 / 4369
Rejection = 🩸 short-term pullback likely.
Momentum strong; watch volume for confirmation.

technical analysis for your chart on Gold (XAU/USDEUREX:FDAX1! EUREX:FDXS1! EUREX:FDXM1! ICEEUR:NCF1! ICEEUR:Z1! ICEEUR:RC1! EUREX:FGBX1! EUREX:FXXP1! ICEEUR:R1! ICEEUR:SOA1! Current Price: $4,002
Trend Structure: The pair is showing a potential reversal setup after a completed downward channel.
Recent Pattern: Price has broken slightly above the descending channel and is now retesting the breakout zone around the support level ($3,950–$3,980).
🔹 Key Technical Levels
Support Zone: $3,940 – $3,980
→ Strong accumulation area shown by multiple rejections and previous demand.
Immediate Resistance: $4,080 – $4,120
→ Minor resistance expected as the first hurdle after breakout.
Major Resistance (Target): $4,385
→ Marked as the final bullish target on the chart.
📈 Bullish Scenario
If price sustains above $4,000, we can expect:
A short-term retest of $4,080–$4,120.
Once momentum confirms above $4,120, bullish continuation toward $4,200 → $4,385 (main target).
✅ Buy Confirmation:
Break and close above $4,050 with volume.
Retest of $4,000 zone followed by bullish rejection candle.
🎯 Bullish Targets:
TP1: $4,080
TP2: $4,200
TP3: $4,385
📉 Bearish Scenario
If price rejects $4,000 and closes below the support zone ($3,950):
Downside may resume toward $3,880 – $3,820 range.
That would invalidate the bullish breakout and confirm channel continuation.
🚫 Sell Trigger:
3H close below $3,940.
🎯 Bearish Targets:
TP1: $3,880
TP2: $3,820
📊 Conclusion
Structure is shifting from bearish to bullish after a channel breakout.
The $3,950–$4,000 area is key — a stronghold for bulls.
Expect a bullish rally if support holds, targeting $4,385 in the medium term.

Gold (XAU/USD) Technical Analysis based on your 15-minute chart:Support Level: 4,100 – 4,106
Resistance Zone: 4,120 – 4,125
Target Point: 4,147
Trend Bias: Short-term corrective upward trend within a broader pullback phase.
📈 Scenario 1 – Bullish Setup
If price continues to hold above the support zone (4,100 – 4,106):
Expect a rebound toward 4,120 (minor resistance).
A breakout above 4,120 could trigger further buying toward the target point at 4,147.
This move aligns with the projected ascending channel shown on the chart.
Confirmation Trigger: Bullish breakout and sustained candle close above 4,120.
📉 Scenario 2 – Bearish Continuation
If g RUS:SI1! RUS:GD1! RUS:MX1! RUS:USDRUB.P RUS:RI1! RUS:IRUS.P RUS:SV1! RUS:CR1! RUS:CNYRUB.P RUS:HS1! old breaks below 4,100:
Selling pressure could resume, driving price down to 4,085 – 4,080.
A break below 4,080 would confirm deeper correction and invalidate the bullish setup.
⚖️ Summary
Bias Entry Zone Target Stop Loss
Bullish (Buy) 4,106 – 4,112 4,145 – 4,150 4,095
Bearish (Sell if break below) < 4,100 4,085 – 4,080 4,120
💬 Analyst Note
The market is showing short-term accumulation after a selloff. Watch for volatility around 4,110–4,120; momentum confirmation is key before taking a position. RUS:NG1! RUS:BR1!

XAUUSD and USDJPY analysis todayHello traders, this is a complete multiple timeframe analysis of this pair. We see could find significant trading opportunities as per analysis upon price action confirmation we may take this trade. Smash the like button if you find value in this analysis and drop a comment if you have any questions or let me know which pair to cover in my next analysis.

Elliott Wave Analysis – XAUUSD | 12 November 2025🔹 Momentum
• D1: The daily momentum has completed its upward phase, indicating that we may expect a bearish wave to bring the D1 momentum back to the oversold zone.
• H4: The H4 momentum is currently preparing to turn upward, suggesting a potential bullish move lasting 4–5 H4 candles before the next larger decline.
• H1: The H1 momentum is also about to turn upward, implying that a short-term rally could begin from the current levels.
🔹 Wave Structure
• D1: On the daily chart, price remains within wave (4) yellow. We expect a downward move aligned with D1 momentum, lasting 4–5 daily candles, to complete this corrective wave.
• H4: On the H4 chart, price is currently inside wave X (purple). As H4 momentum approaches the oversold zone while price continues to move sideways, it suggests that one more upward leg may occur to complete wave X.
• H1: On the H1 chart, price has already formed a 3-wave correction, which I mentioned in yesterday’s update. Currently, wave 4 (red) is forming, and once price breaks above the top of wave 3 (red), wave 5 (red) will be confirmed.
🎯 Wave 5 (red) is expected to target the 4200 zone, which is our primary Sell Zone.
If price breaks above 4145 and RSI forms a lower high compared to RSI at wave 3, this will create a bearish RSI divergence, confirming that wave 5 is forming — a good opportunity to look for Sell setups.
However, if price breaks below the bottom of wave 4 (red), it may indicate a truncated wave 5, which would trigger strong selling pressure and lead to a sharp, steep decline.
📈 Trading Plan
• Sell Zone: 4199 – 4201
• Stop Loss: 4215
• Take Profit 1: 4145
• Take Profit 2: 4046
• Take Profit 3: 3932

Gold Trade Set Up Nov 12 2025Price is trading within a range between PDH and PDL and has swept both internal BSL and SSL so i will wait for more structure to be formed on the 5m looking for buys either from internal SSL or for price to push lower to PDL before looking for buys from that level. Theres also daily FVG under PDL which will act as strong support if it reaches there

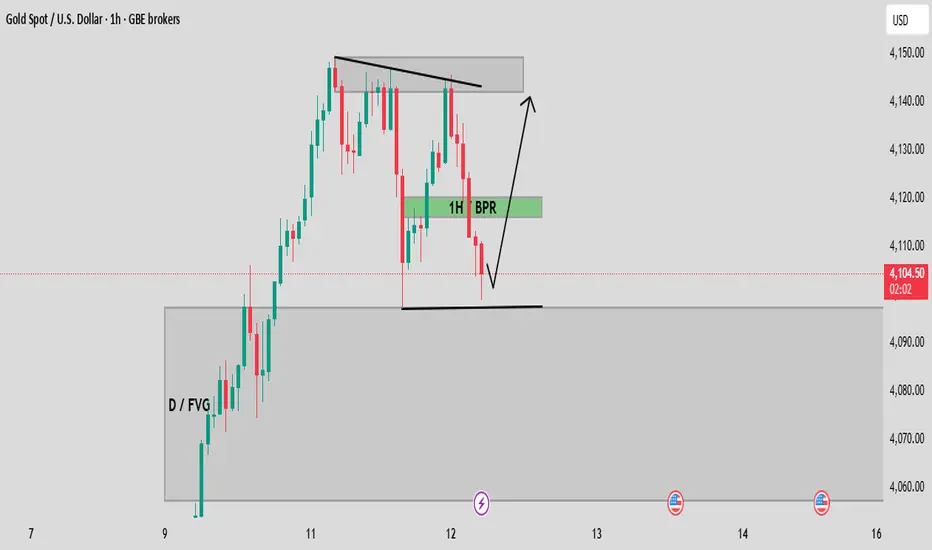
XAUUSD 1H: Price Action Analysis at Key ICT Levels (D/FVG and ?Current Price: The price is hovering around the $4,106 level, near the bottom of a smaller consolidation box.
Key Bullish Driver: The price is currently reacting to or hovering just above a major Daily Fair Value Gap (D/FVG).
A Fair Value Gap (FVG) is an area of price inefficiency (imbalance) left on the chart during a swift price move. It often acts as a magnet or a support/resistance zone when price returns to "fill" it.
Since the price is currently in the upper half of this Daily FVG, traders expect this area to provide strong support for a potential continuation of the uptrend.
Key Pivot Point (1H BPR): The green box is marked as a 1H Balanced Price Range (BPR).
A BPR is a zone where two opposing Fair Value Gaps (a bullish and a bearish FVG) overlap. This overlap signifies an area where the price has been "rebalanced," making it a high-probability zone for a reversal or strong rejection when tested.
The BPR, just above the current price, would be the first line of resistance if price starts moving up, or a re-entry point for buys if it drops lower and then reverses.
Potential Scenarios:
Bullish Continuation: Price uses the D/FVG as support and breaks above the local resistance (around 4,115) to target the recent highs in the 4,140-4,150 zone. (This is the expected move, indicated by the search results suggesting a bullish outlook toward $4,150).
Deeper Correction: Price fails to hold the upper boundary of the D/FVG and drops lower to test the midpoint or the bottom of the gap before finding institutional demand.
gold await breakout#XAUUSD price have multi decline below the 4100, now on pattern reverse but the buy maybe trap depending how the upper range react.
Buy at 4135 on 2 times breakout, TP 4145-4161, SL 4123.
Breakout below the 4122-20 will drop the price down to 4093 which will reverse back to 4112 to sell continuation till 4079.
