Elliott Wave Analysis – XAUUSD (15/10/2025)
1. Momentum
D1: Daily momentum is currently rising and still has room to move into the overbought zone.
➡️ Therefore, the main trend on the D1 timeframe remains bullish until D1 momentum reaches the overbought area and shows signs of reversal.
H4: Momentum on H4 is also rising strongly.
➡️ The upward move is likely to continue until H4 enters the overbought zone and starts to turn down.
H1: H1 momentum is showing slight bearish divergence, suggesting a possible minor corrective pullback in the short term.
2. Wave Structure
D1 Structure: Price is currently in wave 5 (yellow).
A larger correction is only expected once D1 momentum enters the overbought zone, signaling the end of wave 5.
For now, momentum remains bullish → further upside movement is still likely.
H4 Structure: Price is retesting the previous high. There are two possible scenarios:
1️⃣ Formation of a corrective flat or triangle pattern.
2️⃣ Wave 5 (yellow) — which belongs to wave 3 (purple) — is still extending upward.
H1 Structure: After a strong correction, price has rallied back toward the previous high around 4193, which serves as a key resistance zone.
If 4193 holds and price reverses downward, we may see:
• Flat correction: Targeting the 4102 zone – this will be the potential buy area.
• Triangle correction: Price will consolidate narrowly, not dropping deeply toward 4102.
If price breaks above 4193, the next target could be 4234, which may complete wave 5 (yellow).
Since D1 momentum is still rising, it’s not ideal to counter-trade the trend at this stage.
3. Trading Plan
Buy Zone: 4103 – 4101
Stop Loss: 4091
Take Profit: 4151
Xauusdidea

gold on sideway until breakout#XAUUSD We await for price breakout between the two entry.
Firstly breakout below 4090 on 2 times breakout, will drop the price till 4025, stop loss at 4108.
Above 4135 on 2 times breakout will go bullish till 4195.
We await for breakout before trading.

Elliott Wave Analysis – XAUUSD | October 14, 2025📊
________________________________________
🔹 1. Momentum
D1:
Daily momentum has started to turn upward from the oversold zone, suggesting that the bullish pressure may continue throughout the week.
H4:
On the H4 chart, momentum is stuck together in the overbought zone, indicating that a reversal could occur at any moment.
Currently, there have been 13 consecutive bullish candles in the H4 momentum cycle — a typical length before a reversal often appears.
👉 Therefore, avoid chasing long positions (Buy) at this stage.
H1:
H1 momentum is also deep in the overbought area, which means a short-term correction could take place soon.
________________________________________
🔹 2. Wave Structure
D1:
The current pattern shows that Wave 5 is extending, which makes it difficult to project the exact target using Fibonacci ratios.
However, an extended fifth wave usually ends with a sharp and decisive decline, which serves as a confirmation that Wave 5 has completed.
H4:
Price is currently forming Wave 5 (yellow), which also represents Wave 3 (purple) in the higher degree.
Thus, the uptrend is still intact for now.
Once Wave 5 (yellow) — equivalent to Wave 3 (purple) — finishes, the market will likely enter a corrective phase (Wave 4 purple), which would align with a momentum reversal on H4.
H1:
On the Elliott channel drawn from Wave 2 → Wave 4 → Wave 3 (yellow), price has broken above the upper boundary, which could be a throw-over pattern.
If price returns and closes back inside the channel, it would confirm the completion of Wave 5.
Connecting Wave 1 and Wave 3 highs, we can see that price is now above this trendline, and the 4157 zone coincides with the 0.618 Fibonacci extension of Waves 1–3 — forming a strong confluence area where a correction is likely to begin.
________________________________________
🔹 3. Trading Plan
At the moment, price is sitting around a major top, where the Monthly Wave 3 and the Weekly Wave 5 structures converge.
👉 This means volatility could be high and unpredictable.
For now:
• Avoid swing trades,
• Focus only on short-term scalp opportunities with tight targets,
• Wait for a clear confirmation signal at the top zone before entering new positions.

Gold Trade Set Up Oct 14 2025Gold made a LH in London session and is now approaching London lows as liquidity. For me to look for buys back to BSL levels i will want to see aa 15m candle close above London lows or the swing low at 4090, but if price closes under i will look for possible sells to a support

XAUUSD Delivered Excellent profits [ 1600 pips ]Thanks to those traders who followed us and made profits 📈🙏 keep grinding 💪.
I booked profits on buying orders during last 2 days session, entering around 4060-and exiting near 4120, while my shorter-term longs hit the 4130 target on today’s Tokyo session hike.
Going forward, I’ll continue buying dips from my key entry zones as long as Gold holds above the bullish trend till 4400
Also I took buy 3980 and exit 4130.

XAU/USD 14 October 2025 Intraday AnalysisH4 Analysis:
-> Swing: Bullish.
-> Internal: Bullish.
Price has printed according to yesterday's intraday expectation by printing a bearish CHoCH.
We are now trading within an established internal range.
Intraday expectation:
Price to continue bearish, react at either discount of internal 50% EQ, or H4 supply zone before targeting weak internal high priced at 4,179.935
Note:
The Federal Reserve’s sustained dovish stance, coupled with ongoing geopolitical uncertainties, is likely to prolong heightened volatility in the gold market. Given this elevated risk environment, traders should exercise caution and recalibrate risk management strategies to navigate potential price fluctuations effectively.
Additionally, gold pricing remains sensitive to broader macroeconomic developments, including policy decisions under President Trump. Shifts in geopolitical strategy and economic directives could further amplify uncertainty, contributing to market repricing dynamics.
H4 Chart:
M15 Analysis:
-> Swing: Bullish.
-> Internal: Bullish.
Price has continued bullish printing further ATH's.
During the bullish run, price has printed two very insignificant bearish CHoCH's before price continued bullish.
Due to the insignificance of the bearish CHoCH's I have left them unmarked.
Price has since printed a further bearish CHoCH which is denoted with a blue horizontal dotted line.
We are now trading within an established internal range, however, I shall continue to monitor price with regards to depth of pullback.
Intraday expectation:
Price to continue bearish, react at either discount of internal 50% EQ, or M15 supply zone before targeting weak internal high priced at 4,179.135.
Note:
Gold remains highly volatile amid the Federal Reserve's continued dovish stance, persistent and escalating geopolitical uncertainties. Traders should implement robust risk management strategies and remain vigilant, as price swings may become more pronounced in this elevated volatility environment.
Additionally, President Trump’s tariff announcements, particularly against China, are expected to further amplify market turbulence, potentially triggering sharp price fluctuations and whipsaws.
M15 Chart:

GOLD (XAU/USD) – Support Retest and Bullish Breakout ExpectedCurrent Market Overview
Current Price: 4,140.65
Trend: Bullish short-term structure within an ascending channel.
The market has been forming higher highs and higher lows, indicating ongoing momentum to the upside.
📊 Chart Analysis
Ascending Channel:
Price has respected the upward channel with clean touches on both upper and lower boundaries — suggesting strong bullish control.
Support Zone (4,070–4,103):
A clearly marked support level where buyers are likely to step in again.
Entry Point: 4,103.074
Stop Loss: 4,070.469
This zone aligns with previous consolidation and channel midline support.
Target Level:
Target: 4,238.934
Expected Gain: ~3.39% (+139 points)
This target aligns with the upper boundary of the ascending channel and previous resistance zone.
📈 Trade Plan Summary
Parameter Level (USD) Notes
Entry Point 4,103.074 Wait for price to retest support
Stop Loss 4,070.469 Below support zone
Target 4,238.934 Near resistance area
Risk–Reward Ratio ≈ 1:4 Very favorable setup
⚙️ Projection
Expect a minor pullback to the support area before continuation upward.
If the price holds above 4,070, buyers may regain momentum.
A break below 4,070 could invalidate the bullish setup and open downside risk.
🧭 Conclusion
Gold remains bullish above 4,070 with a potential move toward 4,238.
Watch for a retest and rejection confirmation at the support zone before entry to validate bullish continuation.

Gold Trade Set Up Oct 13 2025Gold bullish trend continues making ATH so i will only be looking for buys for now. A 5m demand just got respected to id like to see a 15m BOS followed by a 15m demand or support touch before looking for buys but i will be careful since it can reverse anytime

GoldXAUUSD
- Break of Structure
- Supply Zone
- Bullish Channel as an corrective pattern in Short Time Frame
- RSI - Divergence
- Completed " 1234 " Impulsive Waves

XAUUSD: long-short battle hinges on 4060-4080📈Today's daily chart shows that after completing a "double bottom" last Friday, Gold stabilized and rebounded, which fully aligns with our weekend forecast. It closed with a long lower wick bullish candlestick, indicating robust buying interest at lower levels and that the medium-to-long-term uptrend remains intact.
📈On the 4-hour chart, the Bollinger Bands have started to contract, signaling that gold prices may enter a consolidation range of 3,930 - 4,070. Today, after breaking above 4,070, the price failed to hold this level and pulled back to around 4,069 for consolidation. This reflects strong resistance near 4,080, and in the short term, we need to be wary of a pullback risk triggered by profit-taking among bulls.
💡Intraday, focus on price fluctuations within the 4,060 - 4,080 range. If it breaks above 4,080, you can go long in line with the trend, with targets set at 4,100. If it pulls back below 4,030, be alert to the formation of a short-term top.
Buy 4040 - 4050
TP 4060 - 4070 - 4080
SL 4030
Daily-updated accurate signals are at your disposal. If you run into any problems while trading, these signals serve as a reliable reference—don’t hesitate to use them! I truly hope they bring you significant assistance

GOLD Continue To Upside ,Should We Buy It After Great Breakout ?Here is My 30 Min Gold Chart , and here is my opinion , the price going up very hard without any correction so we should move with it and we have a 4H Candle closure above our Res 4059.00 And Perfect Breakout and this give us a very good confirmation , so we have a good confirmation now to can buy after the price go back to retest the broken area 4059.00, and we can be targeting 100 to 200 pips . if we have a daily closure below this area this mean this idea will not be valid anymore .
Reasons To Enter :
1- Perfect Touch For The Area .
2- Clear Bullish Price Action .
3- Bigger T.F Giving Good Bullish P.A .
4- The Price Take The Last High .
5- Perfect 4H Closure .

XAUUSD 15m – EW Long SetupHi fellow traders,
On the 15m XAUUSD chart, I am applying Elliott Wave principles to outline a potential long setup. Price appears to have completed wave (iv) and is showing early signs of reversal from the golden box area, suggesting that wave (v) may now be underway.
I am entering at the current price, with a Stop Loss at 3940.00, serving as the invalidation level. My Take Profit is set at 4078.87, targeting the projected completion of wave (v). If price moves below the invalidation level, this wave count is no longer valid.
Good luck and trade safe!

Elliott Wave Analysis – XAUUSD (13/10/2025)
________________________________________
🔹 1. Overview
In the previous plan, I predicted an upward correction after a panic sell-off, which was identified by an unusually extended blue wave C on H1.
________________________________________
🔹 2. Momentum
D1 Momentum is currently reversing downward, however, since price and momentum are diverging, the bullish pressure remains strong.
H4 Momentum has now entered the overbought zone, so within the next 1–2 H4 candles, a corrective decline may occur.
H1 Momentum is currently falling, while price is moving sideways, so we should continue observing this zone carefully.
________________________________________
🔹 3. Wave Structure
D1 Chart:
• Price is still within the yellow wave 5.
• Although D1 momentum is declining, the extended wave 5 structure suggests that once a correction begins, the first drop will likely be steep and deep.
• The divergence between D1 candles and D1 momentum only signals weakening bullish strength, not yet a confirmed reversal.
H4 Chart:
• Price is currently moving along the upper boundary of the channel.
• Earlier, a blue ABC structure completed, and now price is forming three consecutive peaks near the previous high.
• This setup hints at a WXY pattern, where wave Y may develop as either:
1️⃣ A Flat (5-wave) pattern, or
2️⃣ A Triangle.
H1 Chart:
• A blue ABC correction has been completed, followed by a rally back to the previous top.
• Price is now moving sideways around this zone.
• Given that the ABC correction is done, there are two possible outcomes:
o (1) The correction is complete, and price is now in a 5-wave impulsive rally, meaning further upside.
o (2) The correction is still developing, and price may continue to drop as described in the H4 scenarios.
________________________________________
🔹 4. Additional Notes
• The current wave structure shows significant overlap, and given the previous panic sell, this slow recovery makes sense — it likely represents a leading diagonal (wave 1 triangle).
• In such a case, once price breaks out of the channel, it should accelerate sharply into a strong wave 3.
• However, since price remains sideways, this scenario may instead represent wave X of a continuing correction.
⚠️ Important:
Unlike the Friday Buy setup, which had strong confluence, the current scenario presents two conflicting possibilities, so the probability is not high.
________________________________________
🔹 5. Trade Plan
Sell Setup (Short-Term):
• Sell Stop: 4040
• SL: 4058
• TP1: 4010
Risk Management:
If price rises strongly above, confirming wave 3 behavior, then cancel the Sell setup.
As mentioned, this signal has lower probability and a relatively wide stop, so it’s better to either observe or enter with a small position size.

Gold vs Dollar – Bullish Confirmation & Risk Management PlanXAU/USD "The Gold vs US Dollar" - Metal Market Cash Flow Management Strategy ⚡ (Swing/Day Trade)
📊 Trading Plan:
✅ Bias : Bullish confirmation spotted as Hull Moving Average shows an upside pullback trend.
✅ Entry Idea : Flexible entry with layering strategy (scaling in with multiple limit orders) :
$3650
$3660
$3670
$3680
( You can add more layers depending on your risk and strategy preference. )
🛡️ Risk Management:
Suggested Protective Stop Loss : around $3630 (after breakout levels).
⚠️ Note : Please adjust SL based on your personal strategy and risk tolerance — this is not a fixed recommendation.
🎯 Target Outlook:
Short-term resistance expected near $3740 (where moving averages converge + overbought conditions may trigger profit-taking traps).
Idea: secure profits before market reversals.
⚠️ Note : Target levels are flexible. You can adjust according to your own plan and market conditions.
🔑 Key Points:
Hull MA Pullback → signals bullish continuation.
Layered Entry → improves average price & manages volatility.
Exit Discipline → respect your risk plan, don't rely solely on posted SL/TP.
🔗 Related Pairs to Watch (Correlation & Flow):
🟢 OANDA:XAGUSD (Silver/USD) → Often moves in tandem with gold, can confirm metal market strength.
🟢 TVC:DXY (US Dollar Index) → Inverse correlation with gold; weak USD = stronger gold.
🟢 FX:EURUSD → Euro strength usually aligns with gold bullish momentum.
🟢 FX:USDJPY → Safe-haven flows: when JPY strengthens, gold tends to follow.
✨ “If you find value in my analysis, a 👍 and 🚀 boost is much appreciated - it helps me share more setups with the community!”
#XAUUSD #Gold #Forex #DayTrading #SwingTrading #HullMA #TradingStrategy #RiskManagement #Metals #FXAnalysis #DXY #TechnicalAnalysis

Gold Performance Recap for the weekThe XAU witnessed a "surge, pullback and rebound" trend this week, recording the largest weekly volatility since 2025.
The movement can be divided into three phases:
1 Monday: A record-breaking sharp rally
2 Tuesday-Wednesday: High-level consolidation and a second rally
3 Thursday-Friday: Volatile swings driven by policy divergences
Looking ahead to next week, if the Federal Reserve's October interest rate decision delivers the anticipated 25-basis-point rate cut as scheduled, gold prices are expected to challenge the 4,080 resistance level; if signals of a "rate cut pause" are released, a deep correction may be triggered with the support level eyed at 3900.
We also need to monitor whether the historical high of 4,057 can be effectively broken and the strength of support around the weekly consolidation center at 3,989.
XAUUSD: Next - week forecastOver the past week, gold rebounded sharply after a sharp decline, formed a "double-bottom" pattern, and regained the 4,000 level, with clear short-term support.
We predict that next week gold will oscillate upward in the range of 3,960 - 4,080, gradually rise relying on trendline support, and is expected to test the resistance at 4,050 during the week. If it breaks through with increased volume, it will target 4,100 resistance level.
However, at the same time, we need to closely monitor Fed policy and geopolitical risks as core variables, because macro events may become the key to breaking the balance.

GOLD POISEDFOR BULLISH AS PRICE HOLDS ABOVE KEY TRENDLINE SUPPOR🧭 General Overview
Instrument: Gold Spot / USD (XAU/USD)
Timeframe: 30-minute
Current Price: 3,958.59
Trend: Overall bullish, but showing short-term correction
📊 Key Technical Elements on Chart
1. Bullish Trendline
The green upward trendline labeled “Bullish Trend” indicates that gold remains in a long-term uptrend.
Price is currently testing this bullish trendline — a crucial support area.
2. Resistance Zone
The resistance line near 3,992–4,000 marks the recent swing high where price was rejected.
Each approach to this zone triggered a pullback, indicating strong selling pressure ther
Gold Trade Set Up Oct 10 2025Price has shifted into bearish structure yesterday and is trading in between a 15m demand and supply so i would want to see price tap into demand to go higher into supply before continuing down
www.tradingview.com

Gold: high throw and bargain huntingGold showed a trend of "opening higher, moving lower, and then staging a weak rebound" on the day. It touched an intraday high of 3,994.22 per ounce and a low of 3,946.59 per ounce. After the opening, the gold price kept declining, and although it rebounded with support at the low level, it had not yet recovered the opening price. Currently, trading volume data indicates moderate market activity without obvious volume expansion signals, suggesting that the current oscillating trend may continue.
It is expected that the gold price will oscillate within the range of 3,940-4,000. If the US Dollar Index continues to surge and break through the resistance level of 99.5, the gold price may test the support at 3,940 again; if the US Dollar pulls back, the gold price is expected to surge above 3,995.
It is advisable to adopt a "high throw and bargain hunting" strategy within the range of 3,940-4,000, and strictly set stop-loss and take-profit levels with a suggested take-profit range of 8-12 and a stop-loss range controlled within 5-8, while avoiding blind chasing of rallies or selling on declines.
Buy 3950 - 3960
TP 3970 - 3980 - 3990
SL 3945 - 3942
Daily-updated accurate signals are at your disposal. If you run into any problems while trading, these signals serve as a reliable reference—don’t hesitate to use them! I truly hope they bring you significant assistance

Elliott Wave Analysis – XAUUSD (10/10/2025)
________________________________________
🔹 1. Momentum
In the October 9th plan, based on H1 momentum and wave structure, I anticipated a strong bearish move, which indeed occurred during yesterday’s late session.
D1 Momentum:
Currently turning downward, meaning the main trend in the coming sessions remains bearish to bring D1 momentum into the oversold zone.
H4 Momentum:
Now showing signs of reversal from the oversold area, suggesting that a short-term recovery wave may appear soon.
H1 Momentum:
Currently approaching the oversold zone, so within the next 1–2 hours, a minor corrective upward move could take place.
________________________________________
🔹 2. Wave Structure
D1 Wave Structure:
We can now see a confirmed bearish reversal candle, whose body is larger than previous bearish candles.
This indicates that the yellow wave ⑤ has likely completed, and I expect a deeper corrective move to unfold — potentially reaching the 3700 area.
H4 Wave Structure:
As mentioned yesterday, we use the price channel for observation, and now the price has closed back inside the channel.
This gives us additional confirmation that wave ⑤ has completed.
With H4 momentum preparing to turn upward, the market is likely to form a corrective upward wave on this timeframe.
H1 Wave Structure:
Currently, a blue ABC correction has formed after yesterday’s strong decline.
Notably, wave C is twice the length of wave A, showing that the panic selling yesterday may have exhausted the sellers.
Combining this with the H4 momentum reversal, it suggests a potential upward move ahead.
Furthermore, after a complete ABC structure, according to Elliott theory, the market often forms another ABC pattern or a 5-wave structure in the opposite direction,
→ therefore, we will now look for Buy opportunities.
________________________________________
🔹 3. Liquidity Zones
Observing the liquidity areas on the chart, there are two key zones to focus on:
• 3953
• 3933
These are the two zones where we will look for Buy setups.
Yesterday’s oversold decline (an irregular wave C) suggests, by Elliott principles, that a strong rebound from the 0.618 retracement up to the previous high is likely —
this will be important for determining our Take-Profit levels.
________________________________________
🔹 4. Trading Plan
Buy Zone 1:
• Entry: 3956 – 3953
• SL: 3943
• TP: 3989
Buy Zone 2:
• Entry: 3934 – 3931
• SL: 3922
• TP: 3953
________________________________________
💡 Note:
This rebound is a technical correction after an oversold sell-off, so it’s recommended to monitor price reaction near TP and consider moving SL to breakeven to secure profits.

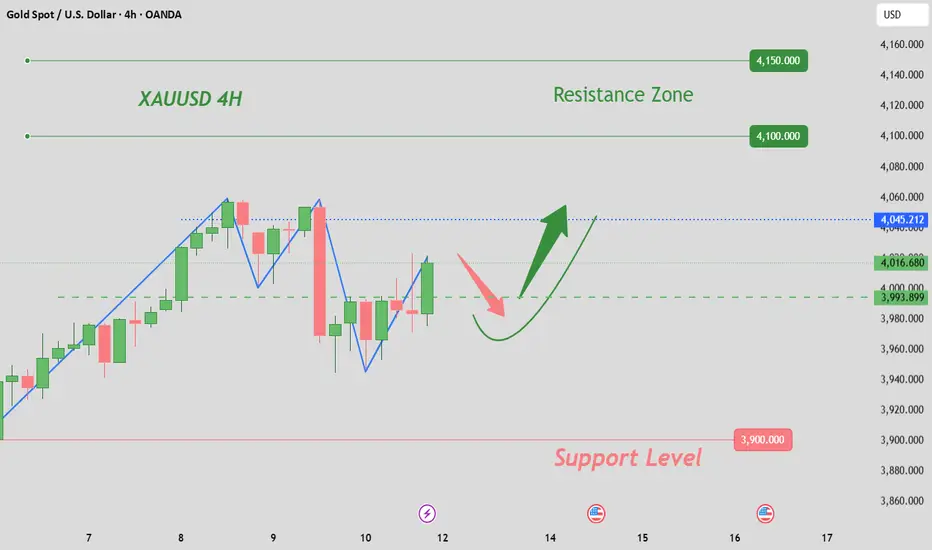
Gold (XAU/USD) Rebound Setup – Support Holding StrongAnalysis:
Gold (XAU/USD) is showing signs of bullish strength after testing the $4,000–$3,970 support zone, where buyers are stepping back in. The recent consolidation above support suggests a potential reversal and continuation of the uptrend.
The setup highlights:
Support Zone: Around $3,970 – $4,000, acting as a key accumulation area.
Bullish Trigger: A breakout above minor resistance could drive momentum higher.
Targets:
🎯 Target 1: $4,101
🎯 Target 2: $4,150
🎯 Target 3: $4,200
Stop Loss: Below $3,970 to protect against a downside breakout.
📈 Outlook: As long as price sustains above support, Gold remains bullish, aiming for a breakout towards $4,150 and $4,200 levels.

Gold Trade Set Up Oct 9 2025Price is currently at a resistance so i will wait for a 15m BOS to the upside followed by a demand tap to take it higher or a 15m CISD to the downside to take to SSL
www.tradingview.com

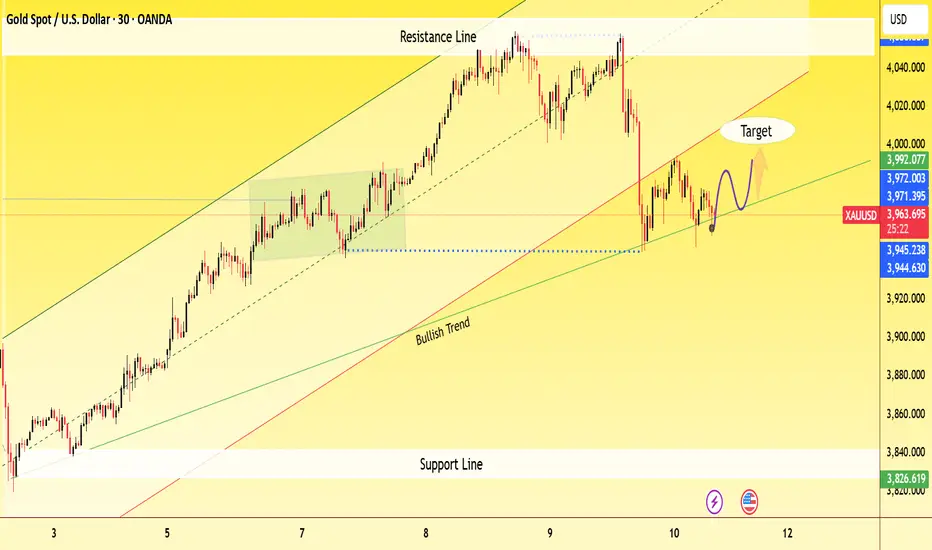
Gold Eyes New Highs Within Ascending ChannelAnalysis:
The XAU/USD 1-hour chart shows gold trading firmly within an ascending parallel channel, maintaining a clear pattern of higher highs and higher lows — a hallmark of sustained bullish momentum.
Currently, price action is consolidating near the mid-level of the channel, preparing for a potential breakout toward the upper boundary near $4,110–$4,120. The projected path (blue arrows) suggests a minor retracement or sideways move before buyers push prices higher again.
As long as gold remains above the lower channel support around $4,000–$3,990, the bullish outlook stays intact. A confirmed breakout above the upper boundary could open the door for a new leg upward, supported by ongoing momentum and strong market sentiment.
Key Levels:
Resistance: $4,110 – $4,120
Support: $3,990 – $4,000
Trend Bias: Bullish within ascending channel
