Gold Trade Setup - 27/Sep/2025Hi Traders,
I am biased for further upside in Gold.
The first trade that I will be looking for is from the highlighted zone and the price is already testing it.
If price corrects here , then I will expect it to drop further to the next marked POI.
Please follow me and like if you agree or this idea helps you out in your trading plan.
Disclaimer : This is just an idea. Please do your own analysis before opening a position. Always use SL & proper risk management.
Market can evolve anytime, hence, always do your analysis and learn trade management before following any idea.
Xauusdidea

XAUUSD H1 OUTLOOK FOR NEXT WEEKI’ve Setup My Sniper Shot For A Sell From The Premium IFVG
Who’s With Me ?
Selling on IFVG And FVG Zones
Target Is Sell Side Liquidity
Good Luck Guys

XAUUSD H1 OUTLOOK I’ve Setup My Sniper Shot For A Sell From The Premium IFVG
Who’s With Me ?
Selling on IFVG And FVG Zones
Target Is Sell Side Liquidity
Good Luck Guys

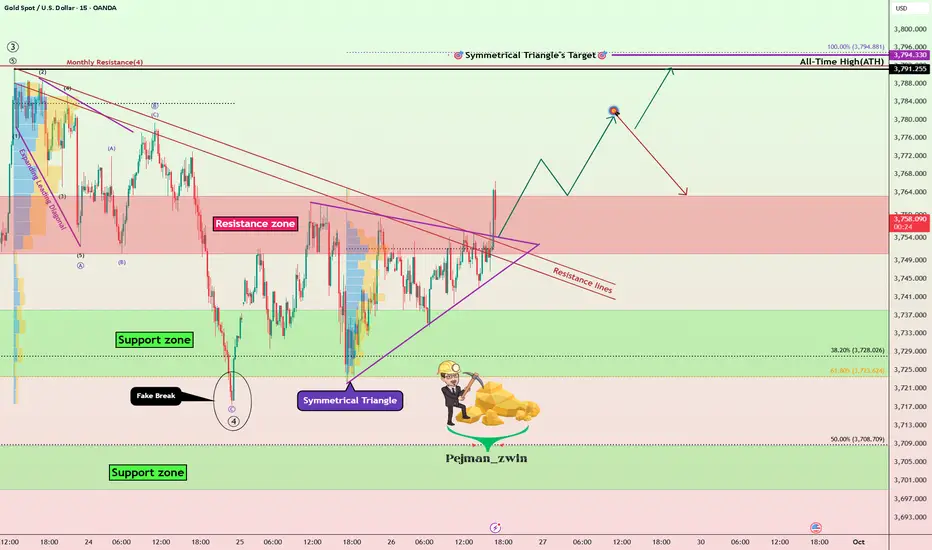
Gold Roadmap: Breakout Confirmed –New ATH or Another Correction?Gold ( OANDA:XAUUSD ) as I expected in the previous idea (Short and Long positions hit the target).
First of all, I should say that this analysis is for the short term and on a 15-minute time frame.
Gold seems to have managed to break the Resistance lines, Resistance zone($3,763-$3,750), and the upper line of the symmetrical triangle in the past few minutes.
I expect Gold to rise to at least $3,779, and then there are two scenarios for Gold: creating a new All-Time High, OR re-correcting.
Stop Loss(SL): $3,741.7
Please respect each other's ideas and express them politely if you agree or disagree.
Gold Analyze (XAUUSD), 15-minute time frame.
Be sure to follow the updated ideas.
Do not forget to put a Stop loss for your positions (For every position you want to open).
Please follow your strategy; this is just my idea, and I will gladly see your ideas in this post.
Please do not forget the ✅ ' like ' ✅ button 🙏😊 & Share it with your friends; thanks, and Trade safe.
Gold Trade Set Sep 26 2025Price is trading within a 1h range but is still bearish until breaking 1h HH at 3761. So will be looking for sells from the most recent 15m supply/OB to target SSL
www.tradingview.com

Gold Pauses: PCE Inflation Report is the Next Battleground.Hello, investors!
Gold saw only a slight 0.1% gain, closing at $3,739.42/oz on September 25, after encountering resistance from better-than-expected US jobs data (weekly jobless claims dropped sharply). This news slightly pared back expectations for a Fed rate cut in October (down to 85%).
However, gold remains supported by dovish Fed comments and potential political instability (like Trump's proposed 100% drug tariff). The market's focus is now entirely on today’s (Sept 26) PCE Inflation Report.
Expert Warning: If PCE is hotter than expected, gold could face sharp, temporary downward pressure.
Technical Analysis & Strategy
Gold is currently consolidating within a triangle pattern and has yet to break the $375x resistance. While further selling pressure is possible before the PCE data, the long-term trend remains bullish.
Outlook: Prioritize Buy positions if the price stays above the Key Level $373x. If the news causes the price to break $373x, be ready to flip the strategy to Sell.
Key Resistance: $3755, $3768, $3778
Key Support: $3738, $3727, $3712
Suggested Trading Strategy (Strict Risk Management):
BUY SCALP
Zone: $3739 - $3737
SL: $3733
TP: $3742 - $3747 - $3752 - $3757 - $3767
BUY ZONE
Zone: $3704 - $3702
SL: $3694
TP: $3712 - $3722 - $3732 - $3742 - $3762
SELL ZONE
Zone: $3776 - $3778
SL: $3786
TP: $3768 - $3758 - $3748 - $3728 - $3708
The market is at a crossroads. What's your strategy today? 👇
#Gold #XAUUSD #PCE #Fed #Inflation #TradingView #ATH

Gold Trade SetupI will risk!!!
It seems we are near at the end of correction wave...
The first target R/R is 2 and the second is 4...

ElDoradoFx PREMIUM 2.0 – GOLD FORECAST (26/09/2025)🔍 Multi-Timeframe Technical Analysis
Daily (D1)
• Gold is trading at 3,752, holding above the 10EMA and the 3,732 pivot support.
• Momentum remains bullish overall after the rally from early September, but candles show hesitation under 3,791 high → signs of consolidation before a potential new breakout.
• As long as 3,732 holds, the structure remains bullish.
⸻
1H (Intraday Structure)
• Price has broken above the descending trendline resistance (~3,748), now retesting this area.
• Support cluster: 3,745–3,740 (aligned with EMA + structure lows).
• Resistance zone: 3,752–3,755 (capping upside before 3,764).
• MACD: momentum just flipped positive, but histogram is shallow → momentum still fragile.
• RSI: mid-zone (~55) → suggests potential to expand higher if resistance breaks.
⸻
15M (Short-Term View)
• Price consolidating 3,745–3,752.
• Higher lows forming since Asian session → bullish micro-structure.
• MACD showing bullish divergence after last sweep of lows near 3,734.
⸻
5M (Scalping View)
• Strong sweep earlier at 3,751, rejection but held 3,747–3,745 base.
• Micro ascending channel → scalpers eyeing breakout confirmation.
• Momentum picking up, but volume still thin → London likely decides breakout direction.
⸻
📌 Fibonacci Golden Zone
Swing High 3,791 → Swing Low 3,732:
• 38.2% = 3,754
• 50% = 3,761
• 61.8% = 3,767
➡️ Golden retracement lies at 3,754–3,767 → exactly where London session resistance sits. A break into this zone will decide continuation vs. rejection.
⸻
🎯 Scalping Setups (Max 60 Pips SL)
✅ Buy Setup (Preferred if bullish momentum holds)
• Entry: Above 3,752–3,754 breakout & retest.
• SL: 3,746 (≈ -60 pips).
• TP1: 3,761
• TP2: 3,767 (Fib 61.8%).
• Reasoning: Break above golden zone support confirms bullish continuation.
✅ Sell Setup (If rejection at resistance)
• Entry: Rejection at 3,754–3,755 or confirmed break below 3,740.
• SL: 3,760 (≈ -60 pips).
• TP1: 3,734
• TP2: 3,722.
• Reasoning: Failure to hold golden zone leads to pullback toward London lows.
⸻
⚠️ Key London Session Levels
• Bullish Breakout: 3,754 → opens 3,761–3,767.
• Bearish Breakdown: 3,740 → exposes 3,734 then 3,722.
• Pivot Level: 3,745 (control zone for scalpers).
⸻
✅ Summary:
Gold sits at a decision point. If 3,752–3,754 breaks and holds, expect bullish continuation into 3,761–3,767 (golden zone). If rejected, scalpers can look for shorts back toward 3,734–3,722. London open will likely provide the breakout.

Elliott Wave Analysis XAUUSD – September 26, 2025
________________________________________
🔹 Momentum
• D1: Currently decreasing → the corrective trend is likely to continue. It may take about 2 more D1 candles for momentum to enter the oversold zone, after which a reversal could occur.
• H4: Momentum is rising → today we may see a bullish move or sideways range.
• H1: About to enter the oversold zone → a short-term bullish reversal is likely.
________________________________________
🔹 Wave Structure
• D1:
o As analyzed previously, wave 5 (yellow) has already reached its first target at 3789.
o It may take around 2 more D1 candles for momentum to enter oversold → showing that the bearish leg is weakening.
o Considering depth and time, the market is likely within wave 4 of wave 5. Once the correction completes, the uptrend should resume toward the second target.
• H4:
o A WXY corrective structure is developing.
o The ABC (blue) has completed wave W → the market may now be in wave X, followed by a Y-wave decline to finish the correction.
• H1:
o Wave X appears to be forming a triangle, currently in the final wave e.
o However:
If price rises sharply above 3762, it would suggest the corrective phase is already completed.
The target area for wave e is around 3752 → potential Sell zone.
If price breaks below 3729, it confirms wave Y is in play, targeting 3713 and 3698 → potential Buy zones.
⚠️ Note: If the Buy target is reached first, the Sell setup will be canceled.
________________________________________
🔹 Trading Plan
🔻 Sell Zone
• Entry: 3751 – 3753
• SL: 3761
• TP: 3729
________________________________________
🔺 Buy Zone 1
• Entry: 3714 – 3712
• SL: 3704
• TP: 3751
________________________________________
🔺 Buy Zone 2
• Entry: 3699 – 3696
• SL: 3686
• TP: 3751

26/9/68 : XAUUSD ( Europe / London Session )Using it from Europe Session until 7.00PM , I'll new analysis and update at 8.00PM
Resistance
3769-3774
3759-3764
3753
Support
3743
3733-3738
3722-3728

Gold Price Outlook – Trade Setup (XAU/USD)📊 Technical Structure
Gold (XAU/USD) is trading near $3,740, consolidating below the descending trendline resistance. The support zone lies at $3,723 – $3,719, while the resistance zone is around $3,761 – $3,765. The price structure shows a “buy-the-dip” bias as long as support holds, but near-term pressure remains capped by the downtrend line. A breakout above $3,765 could open the path toward $3,785.
🎯 Trade Setup
Entry: $3,719 – $3,723 (support retest)
Stop Loss: $3,715
Take Profit: $3,764 / $3,785
Risk/Reward (R:R): ~1 : 5.4
🌍 Macro Background
Markets await the US Core PCE Inflation data later today – the Fed’s preferred inflation gauge. Stronger-than-expected PCE could strengthen the USD and pressure gold lower. On the other hand, a softer reading may revive rate cut expectations, supporting gold. Additionally, Trump’s new tariffs (100% on pharmaceuticals, 50% on cabinets, 30% on furniture, etc.) and ongoing geopolitical risks with Russia provide safe-haven flows that keep gold attractive. Despite the USD holding at three-week highs, investors continue to see gold as a hedge amid policy uncertainty and trade tensions.
🔑 Key Technical Levels
Resistance: $3,764 / $3,785
Support: $3,723 / $3,719
📝 Trade Summary
The overall structure favours a buy-the-dip strategy near support zones, with upside potential toward $3,764 – $3,785 if US PCE comes in softer. However, a stronger inflation print may trigger a deeper pullback below $3,719. Traders should stay alert for volatility around the data release.
⚠️ Disclaimer
This analysis is for reference only and does not constitute trading advice. Trading involves significant risk, and proper risk management is essential.

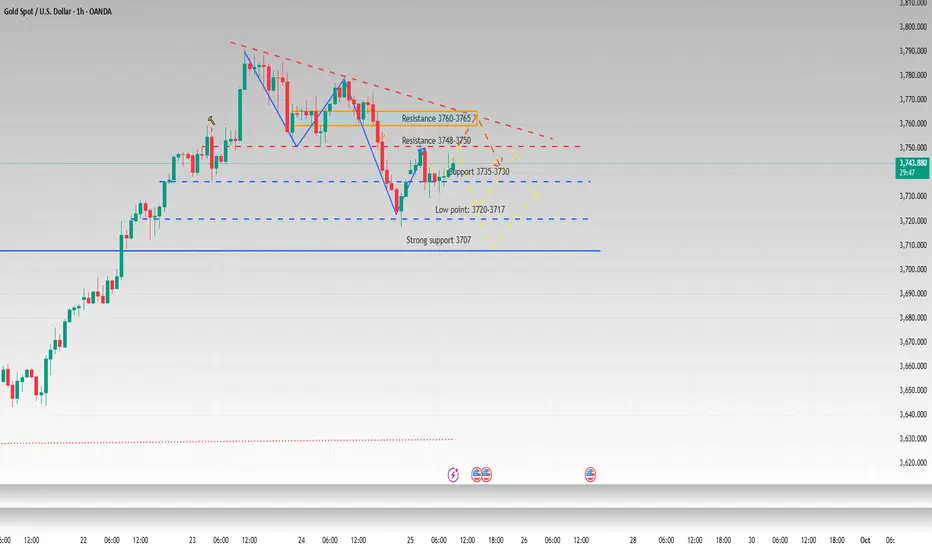
9/25: Buy at Lows, Watch Resistance at 3758–3763Good morning everyone!
Yesterday, gold rebounded from support but failed to break resistance, then continued its decline to around 3720, completing the divergence correction on the 30M chart. This downside move was well captured.
Currently, price is in a rebound phase:
3752–3758 is the key resistance zone. A clean breakout and consolidation above would give the bulls stronger momentum.
3733–3726 is the key support area. If price retests without breaking lower and forms bullish candles (especially strong bullish candles without long upper wicks), the probability of another upward move increases.
If volume supports a breakout, watch the 3770–3780 resistance area, as it may trigger further upside.
📌 Trading Outlook:
Trend setups:
Long opportunities below 3710;
Short opportunities above 3780;
If price breaks above 3770 and retests near 3760 without losing 3752, this could present another long entry.
Range setups:
Consider swing trades within the 3766–3726 range.
⚠️ Reminder: If your account condition is not favorable, avoid unnecessary trades. Focus on higher-probability setups to steadily grow profits while controlling risk.

GOLD Breakout Done , Short Setup Valid To Get 200 Pips !Here is My 30 Mins Gold Chart , and here is my opinion , we finally Below 3750.00 With 4H Candle ! and we have a 4H Candle closure below it And Perfect Breakout and this give us a very good confirmation , so we have a good confirmation now to can sell after the price go back to retest the broken area 3750.00 , and we can targeting 100 to 200 pips . if we have a daily closure above this area this mean this idea will not be valid anymore .
Reasons To Enter :
1- Perfect Touch For The Area .
2- Clear Bearish Price Action .
3- Bigger T.F Giving Good Bearish P.A .
4- Over Bought .
5- Perfect 30 Mins Closure .

Gold Trade Set Up Sep 25 2025Last night we caught a buy from 15m demand securing 300 pips followed by a sell at 1m supply securing 100 pips then now another sell from 15m supply currently running 200 pips aiming for 350 pips at 15m demand
overall im bearish for now until it hits a 4h demand at 3658-3644 to continue its bullish move back to ATH

GOLD Bearish Breakout!
HI,Traders !
#GOLD made a bearish
Breakout of the key horizontal
Level of 3750.17 and the
Breakout is confirmed so
We are bearish biased and
We will be expecting a
Further bearish move down !
Comment and subscribe to help us grow !

The trend has not changed, continue to shortAfter yesterday's high-level fluctuations, gold prices retreated significantly in the US market due to news, hitting a low near 3717.
Yesterday's daily gold price closed in the red, with the MA5 moving average near 3735. If today's daily closing price falls below the MA5 and reaches the MA10, bears will regain control of the market. Looking at the 4-hour Bollinger Bands, after breaking below the middle line, the price has fluctuated, briefly stabilizing near 3735. Currently, it is consolidating sideways, but if the European/US session breaks below 3735-3720, further declines to 3710-3700 are possible. The short-term downward trend is still under pressure and the market is in a weak state. Therefore, intraday gold trading is still mainly short selling, with long buying as an auxiliary.
The main pressure range above is 3750-3765. If the rebound touches the upper resistance range without breaking it, you can continue to short gold. The short-term support is at 3735-3720 below. If it falls back but does not break through, you can go long with a light position. Strong support focuses on the previous top and bottom conversion of 3710-3700.
Gold: Opportunities for both longs and shorts.Gold still pulled back downward overnight, which is the time window we reminded everyone to pay attention to yesterday. On the daily timeframe, the price has started to approach MA5. After a relatively large short-term gain, it is facing correction pressure. Today, focus on the support from MA10; there is also a need for a pullback on the weekly timeframe. However, note that there will still be an upward move after the correction—fundamentals have not changed, and the main trend remains intact.
After the strong one-way trend shifted to consolidation, short positions can also be traded; there are opportunities for both short-term long and short positions, but it is necessary to seize the right levels. Pay attention to shorting on rebounds near the 3765/3770 resistance, and look to go long near the 3710 support and the daily MA10 level. Currently, price volatility is relatively high, so be sure to control risks properly.
Buy 3730 - 3740 TP 3750 - 3760 - 3770 SL 3725
Sell 3760 - 3770 TP 3770 - 3775 SL 3758
Daily-updated accurate signals are at your disposal. If you run into any problems while trading, these signals serve as a reliable reference—don’t hesitate to use them! I truly hope they bring you significant assistance

Gold Roadmap| Short-termGold ( OANDA:XAUUSD ) has been surprising everyone in the last few weeks, making new All-Time Highs(ATHs) every day.
Let me start by saying that this is a short-term analysis on a 15-minute time frame .
Technical analysis generally works worse when assets are creating ATHs . One reason for this is that there is no past history .
Gold has started to correct after the formation of the last All-Time High(ATH=$3,791.55) .
In terms of Elliott Wave theory , given the bullish momentum of Gold , it seems that the main wave 3 has been completed, and we should wait for the main wave 4 . It seems that the main wave 4 can be completed with a Zigzag Correction(5-3-5) .
I expect Gold to continue its downward trend to the Support zone($3,738-$3,723) , and then if we find a trigger for a Long position , we can ride the bullish wave of Gold again .
Note: If the Resistance lines are broken, we can expect a new All-Time High.
Note: If the Support zone($3,738-$3,723) is broken, we can expect a deeper correction.
Please respect each other's ideas and express them politely if you agree or disagree.
Gold Analyze (XAUUSD), 15-minute time frame.
Be sure to follow the updated ideas.
Do not forget to put a Stop loss for your positions (For every position you want to open).
Please follow your strategy; this is just my idea, and I will gladly see your ideas in this post.
Please do not forget the ✅ ' like ' ✅ button 🙏😊 & Share it with your friends; thanks, and Trade safe.

ANFIBO | XAUUSD - A psychological zone $3800 ? [09.25.2025]Hi guys! Anfibo's here!
Overall Picture Today:
OANDA:XAUUSD is currently maintaining stability within the H4 bullish channel, reflecting the sustainability of the prevailing uptrend. Although no major breakout has occurred in recent sessions, the technical structure indicates that buyers still hold the advantage. However, the market is showing signs of stalling at a key resistance zone, so short-term trading plans should focus on resistance and support levels to optimize profits.
> SUPPORT KEY LEVELS: 3748 - 3733 - 3703
> RESISTANCE KEY LEVELS: 3768 - 3777- 3788 - 3799
Here's my Trading Plan today:
>>> SELL SCALP:
ENTRY: 3770 - 3765
SL: 3780
TP: 3720 - 3705
>>> BUY ZONE:
ENTRY: 3700 - 3705
SL: 3695
TP: 3760 - 3800
Always set stop-loss and good money management for success!
GOODLUCK GUYS!!!

XAUUSD Analysis: Precarious Levels, Here's My Trade Plan📊 Looking at Gold (XAUUSD) on the 4-hour timeframe, price is sitting at a precarious level. Recently, we’ve seen a bearish break of structure, but some bullish momentum is beginning to show 📈.
🔎 That said, there’s still no confirmation of a bullish market structure break just yet. I’ll be watching two possible scenarios:
1️⃣ If price breaks the current high, then retests and fails, this could set up a potential long entry 🚀.
2️⃣ If price instead breaks the current low, then retests and fails, that would signal a possible short opportunity 📉.
⚠️ Disclaimer: This analysis is for educational purposes only and not financial advice. Always trade responsibly and manage your risk carefully.

XAU/USD Bearish Setup: Channel Top OANDA:XAUUSD recently lost momentum after an extended rally, stalling at the upper boundary of the ascending channel around 3770–3780. This stall is significant because it aligns with multiple bearish confluences:
🔽 Bearish Confluences:
Channel resistance test: Price is rejecting the upper channel trendline, signaling exhaustion from buyers.
Fibonacci alignment: The current zone overlaps with key fib levels, increasing the probability of retracement.
Rejection wicks: Successive daily wicks near resistance show supply absorption and fading bullish pressure.
Extended rally: After weeks of near-vertical movement, overbought conditions make the market vulnerable to pullback.
📉 Levels to Watch:
3,710 → (Fib 38.2%) first resistance / potential reversal zone.
3,668 → (Fib 61.8%) initial downside target if weakness persists.
3,600 → (Fib 100%) strong bearish target and possible channel midline retest.
Bias: Bearish as long as price remains under 3800. A sustained breakout and close above this zone would invalidate the downside scenario and open the door for higher highs..

Gold "Cools Down": A Sign of a Coming Downturn?Gold "Cools Down": A Sign of a Coming Downturn? 📉🤔
Hello, investors!
Gold saw a notable correction on September 24, closing at $3,762.73/oz after reaching a historic high of $3,790.82/oz just one day earlier. Gold futures also dropped 0.5% to $3,795.80/oz. Is this a sign of a deeper correction or just a short-term profit-taking before key news?
Fundamental Analysis: Market "Holds Its Breath" Before the PCE Inflation Report
Yesterday's drop in gold seems to have little to do with the released U.S. economic data, as the USD index only had a slight rebound and housing data wasn't strong enough to cause such a major move. Instead, the most likely reasons are:
Cautious Profit-Taking: Investors are taking profits after a rapid run-up, aiming to mitigate risk before the upcoming PCE inflation report on September 26.
Fed Expectations: Despite short-term volatility, the market holds firm on its expectation that the Fed will cut rates in October and December with a high probability (94% and 77%). A low-rate environment and geopolitical concerns remain the core drivers supporting gold's price in the long term.
Technical Analysis: "Sell" or "Wait to Buy"?
Gold had a significant correction from the $3,770 area, indicating that a large number of profit-taking sell orders were triggered. However, the downtrend has paused and is now looking for a new balance point.
Outlook: With the current cautious sentiment, there's a chance gold may see further selling pressure in the short term. However, any deeper drop would be an excellent opportunity to buy back at a better price, as the long-term bullish momentum is still intact.
Suggested Trading Strategy (Strict Risk Management):
Sell Zone: Zone $3766 - $3768, SL $3776
Buy Zone: Zone $3702 - $3700, SL $3692
The market is highly sensitive. Do you think this correction is a buying opportunity or a time to step back? Share your thoughts! 👇
#Gold #XAUUSD #Fed #GoldAnalysis #TradingView #InterestRates #Inflation #PCE #USD

25/9/68 : XAUUSD ( Europe / London Session )Using it from Europe Session until 7.00PM , I'll new analysis and update at 8.00PM
Resistance
3759-3764
3749-3754
3743
Support
3733
3722-3728
3712-3717
