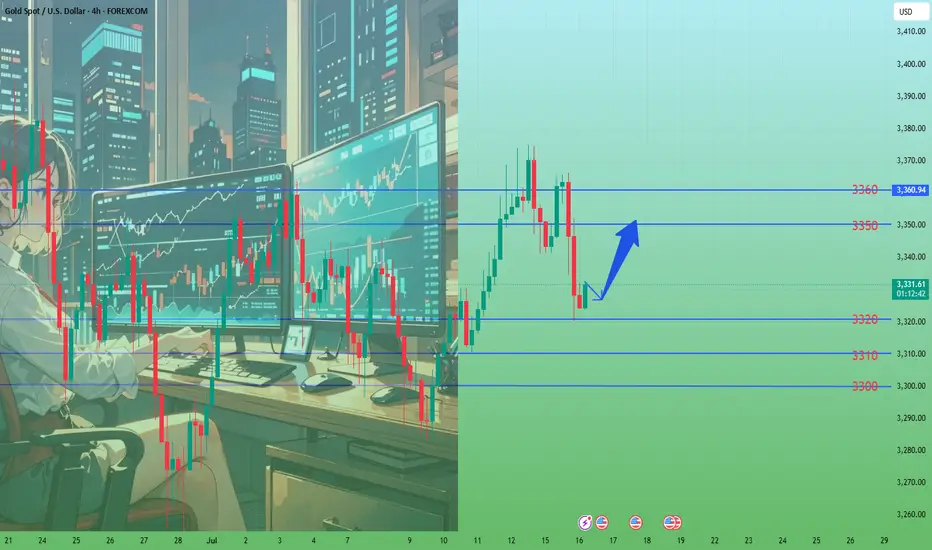
The general trend is to go long after the retracementFrom the 4-hour analysis, the short-term support below is 3370, the important support is 3350-55, and the upper resistance is 3400-05. The overall support range is maintained in this period to maintain the main tone of high-altitude low-multiple cycle participation. In the middle position, watch more and do less, be cautious in chasing orders, and wait patiently for key points to enter the market. I will provide specific operation strategies in the link prompts, please pay attention in time.
Gold operation strategy:
1. Go long on gold when it falls back to 3370, and add more positions when it falls back to 3350-55, stop loss 3344, target 3395-3400, and continue to hold if it breaks;
Xauusdlong

XAUUSD Bullish Signal | Technical + Custom AlgoSmart Trend Signal | Technical Analysis + Custom Algorithm
This signal is the result of a combination of classic technical trend analysis and a proprietary software I personally developed.
3380 gold price recovered at the beginning of the week⭐️GOLDEN INFORMATION:
Gold prices (XAU/USD) trade with modest gains around $3,350 in early Asian hours on Monday, supported by persistent uncertainty surrounding global trade negotiations as the US tariff deadline approaches. Lingering concerns over fresh levies are likely to sustain demand for the safe-haven metal. Investors now look ahead to comments from Federal Reserve (Fed) Chair Jerome Powell, scheduled for Tuesday, for clearer policy direction.
On Sunday, US Commerce Secretary Howard Lutnick confirmed that August 1 remains the firm deadline for countries to comply with Washington’s tariff demands. While President Trump’s earlier announcements saw shifting deadlines, the White House now insists this date is final. This cloud of uncertainty continues to bolster gold’s appeal as a hedge in volatile markets.
⭐️Personal comments NOVA:
Gold prices continued to recover last weekend, mainly still accumulating above 3300.
⭐️SET UP GOLD PRICE:
🔥SELL GOLD zone: 3380- 3382 SL 3387
TP1: $3370
TP2: $3360
TP3: $3350
🔥BUY GOLD zone: $3322-$3320 SL $3315
TP1: $3333
TP2: $3345
TP3: $3356
⭐️Technical analysis:
Based on technical indicators EMA 34, EMA89 and support resistance areas to set up a reasonable BUY order.
⭐️NOTE:
Note: Nova wishes traders to manage their capital well
- take the number of lots that match your capital
- Takeprofit equal to 4-6% of capital account
- Stoplose equal to 2-3% of capital account

GOLD Wait For Breakout!
HI,Traders !
#GOLD has formed a Bullish Flag pattern
While trading in an uptrend As
we mentioned in a previous analysis
So we are bullish biased and
IF we see a bullish breakout
We will be expecting a
Further bullish move up !
Comment and subscribe to help us grow !

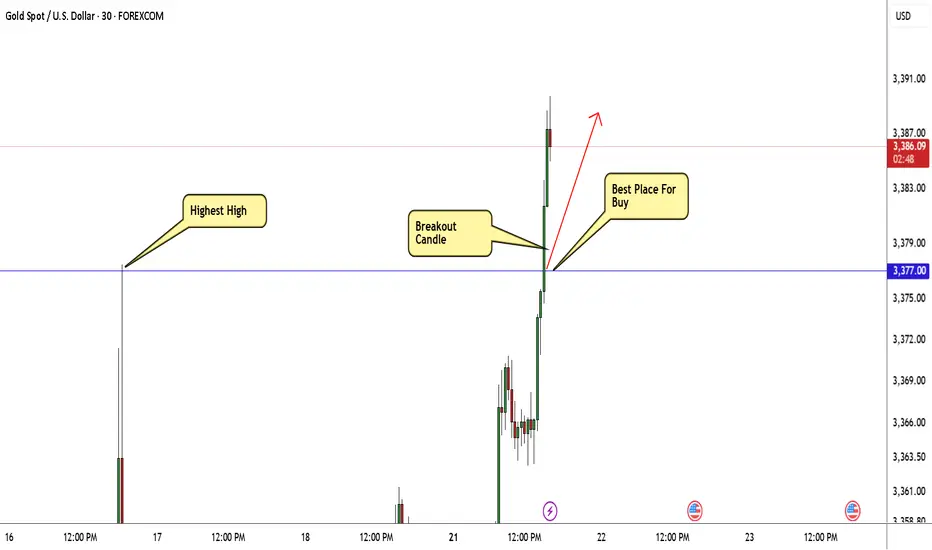
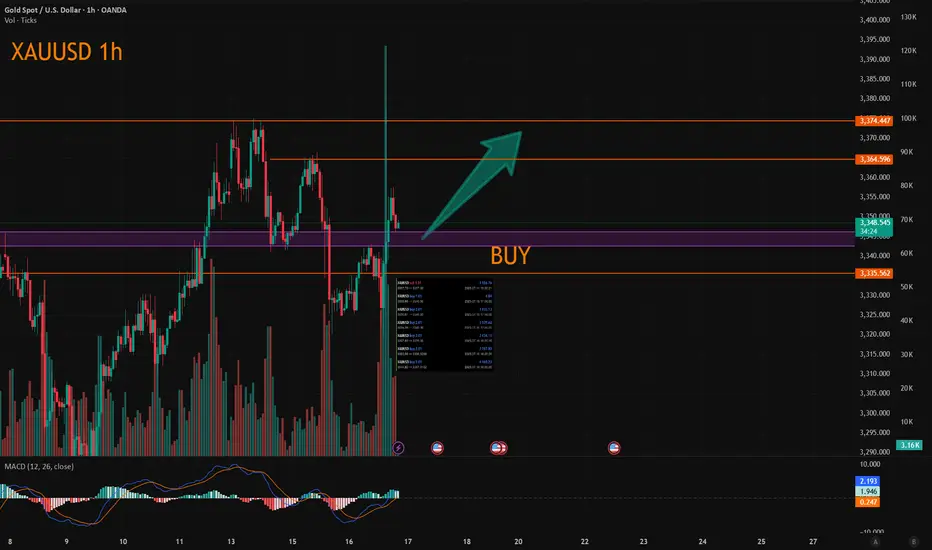
GOLD Breakout Done , Long Setup Valid To Get 200 Pips !Here is My 30 Mins Gold Chart , and here is my opinion , we finally above 3377.00 and we have a 30 Mins Candle closure above this strong res , so i`m waiting the price to go back and retest this res and new support and give me a good bullish price action to can enter a buy trade and we can targeting 200 pips , and if we have a 4H Closure Above This res this will increase the reasons for buyers , just wait the price to back a little to retest it and then we can buy it . if we have a daily closure below it this idea will not be valid anymore .
gold on sell#XAUUSD sell at 3362, the candle is rejecting on bullish which will make retracment on the price.
Entry below 3362 on H1 or M15 closure. Target 3344, stop loss 3372.
Bullish can break following longer candle closure on H1.

The range breakthrough is waiting for CPI to take effectIn the early stage, it was mainly volatile, and the lowest level in the morning reached 3334, which was also the position we went long last night. Today, we continue to focus on the 3340-45 line and go long, focusing on the release of CPI data. If CPI rises as expected, it means that inflation is rising, and the Fed's annual interest rate cut expectations will be further reduced, and gold prices may be under pressure to fall again; on the contrary, if CPI is lower than expected or even performs well, it means that Trump's tariff war has not had such a big impact on the market, and the Fed's interest rate cut expectations have increased significantly. After breaking through 3375, gold prices may accelerate to rebound to 3385-90 or even 3400. We focus on the release of data. If your current gold operation is not ideal, I hope I can help you avoid detours in your investment. Welcome to communicate with us!
From the 4-hour analysis, the bullish strong dividing line below is 3325-30. Below, we pay attention to the short-term support of 3340-45. The daily level stabilizes at this position and continues to maintain the bullish rhythm of stepping back and falling. The short-term pressure focuses on the vicinity of 3370-75. The overall high-altitude low-multiple cycle participation in this range remains unchanged. I will prompt the specific operation strategy in the link, so please pay attention to it in time.
Gold operation strategy:
1. Go long when gold falls back to 3340-45, and add more when it falls back to 3325-30. Stop loss 3317, target 3365-70, and continue to hold if it breaks;

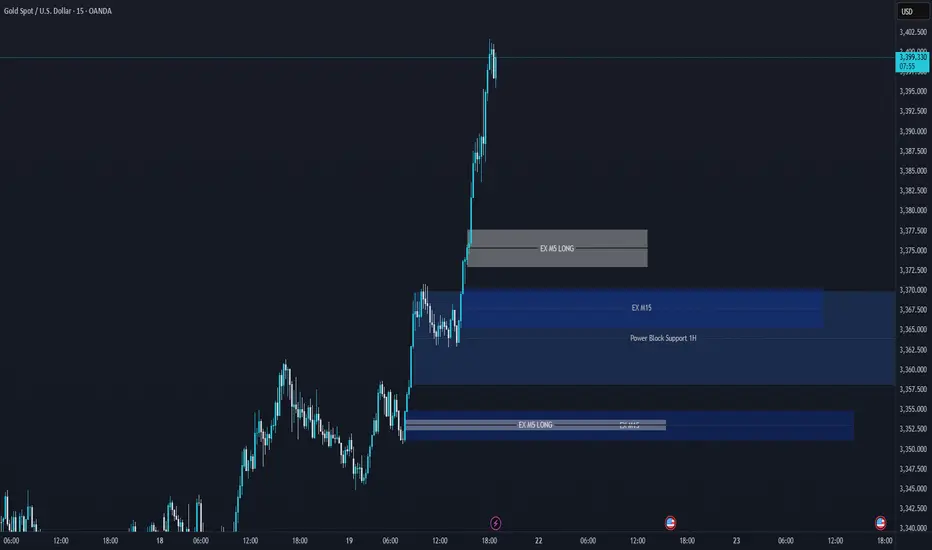
gold buysim looking for buys this week on gold price has been consolidating for the past few weeks. on friday price broke structure on the m15 structure went higher and created new highs... im im looking for a retest of the higher high
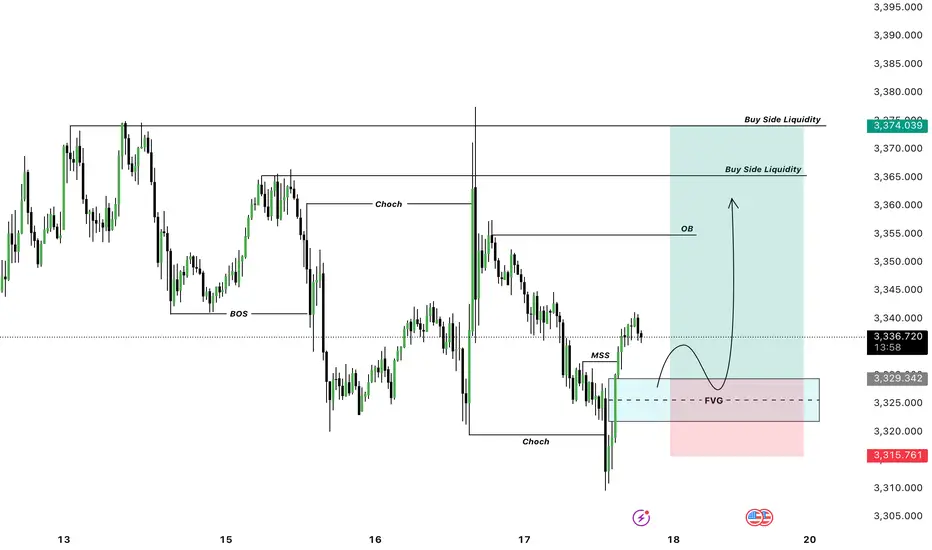
GOLD LONG SETUP Gold Bullish Long Setup
Startegy : FVG + MSS + BUY STRUCTURE
Where To Buy ?
3329 - 3320 Area FVG Buy
Targets : 3350 , 3355, 3360
Stop Loss Previous Low
Expectations On GoldPEPPERSTONE:XAUUSD Looking at the daily Range, The market has reached the equilibrium level, is that a sign to go short? no, we could still see a drive to the upper side, but ultimately, the relative equal lows which are close to 3,245.00 big figure should likely be the draw.
I would love to see a drive below the 3,282.00 mark for perfect show to prove the obvious move below the 3,245.00, or seeing a consecutive break below each previous days low would also confirm the directive.
Seeing higher prices would of course negate this analysis, seeing a run into the 3,375.00 big figure yesterday makes me skeptical as this has also left some area of relatively equal highs, so I would give in to the idea of higher prices at least to that level to see what would like occur, but I strongly doubt that this would be the scenerio.
Generally, I am bearish on Gold till I see a run below that 3,245.00 big figure or prices closer to that level.

Continue to go long after bottoming outYesterday, the Trump and Powell incident caused gold to rise strongly to around 3377. The rise in gold was only short-lived. In the end, gold closed positively on the daily line, but it closed with a super long upper shadow line. In the end, the gold price quickly rose and broke through the 3377 mark, but fell back under pressure and closed in a volatile market. The daily K-line closed high and fell back in a volatile market. Although the overall gold price repeatedly fluctuated and washed out under the stimulation of news, it ultimately failed to break through the recent large box oscillation range. Today we continue to pay attention to the support line of 3318-25 below, and we will continue to go long if it falls back!
From the 4-hour analysis, the short-term support below continues to focus on around 3318-25, the short-term suppression above focuses on the 3340-45 line, and the key pressure above focuses on the 3380 line. Relying on this range as a whole, the main tone of high-altitude and low-multiple cycles remains unchanged. In the middle position, watch more and do less, be cautious in chasing orders, and wait patiently for key points to enter the market.

gold on sell#XAUUSD await breakout below 3324 which holds sell continuation. Expected target is below 3305-3292.
Below 3324 will drop the price, target 3305-3292, stop loss 3337.
Fundamental can change price back to Bullish. So we watch closely.

XAUUSD BUY IDEAOn the H4 we have a clear unmitigated fvg+KL just blow a valid level as inducement which price might come to raid.
There has been series of military attack between iseal and Syria and also Fed cutting the rate will also be a key factor

The latest gold trend analysis and strategic suggestionsYesterday, the price of gold showed a range of fluctuations. The long and short sides fought fiercely but failed to break through the existing range. The overall trend direction is still unclear. From a fundamental point of view, the market is still dominated by risk aversion, which makes it difficult for the price of gold to form a clear trend reversal. However, it should be noted that the main funds may take extreme suppression measures in the future to force the price of gold to fall. From the 4-hour chart, gold has been under pressure near the upper track 3377 and continued to fall. Yesterday, it broke through the middle track support and touched the lower track. The current price is temporarily supported near the lower track, but the overall trend still shows a wide range of fluctuations and has not formed an obvious trend. The short-term strength of the US dollar suppresses the upward movement of gold, but the key support and resistance levels have not been effectively broken; in terms of intraday short-term operation suggestions, the current callback near 3320-3325 can try to do ultra-short-term longs. It is recommended to stop profit and exit in the 3340-3345 range. It can be combined with the K-line pattern to short-sell, and the target is the lower track area. If the downward momentum is strong, it may fall below yesterday’s low to form a continuous decline.
Operation suggestions:
1. Go long when gold falls back to around 3320-3325, stop loss at 3312, target at 3340-3345.

Oolong news stirs up goldDuring the US trading session, the market suddenly had an "oolong" incident. The news that Trump fired Powell caused gold to surge to 3367, but Trump soon denied the plan, the risk aversion sentiment dissipated, and gold fell sharply.
At present, gold has returned to volatility. Given that the risk aversion sentiment failed this time, we need to be vigilant about the subsequent surge and fall.
Given the volatile news, it is better to hold the currency and wait and see, and then look for a good opportunity to operate after the news becomes clear. At present, the upper resistance is 3365-3370, and the lower support is 3326-3317. It is recommended to do more in the future market.

xauusd:Going long can lead to making money.
This week and last week, we have been continuously recommending a bullish position. There is no doubt that you love trading. Welcome!
SWING TRADE OPPORTUNITY 〉LONGAs illustrated, I try to visualize what the next bullish impulse could look like if price holds 3300 as a key psychological and algorithmic price level.
Illustrated are the potential buy areas (a current one and an extended one in case a pullback occurs to manipulate lower levels in the next 24-48 hours).
This projection, if valid, could hold from now until next week, so it can be considered a swing trade to hold at least the next week and into the following one).
--
After this post, I will upload another analysis on the Daily timeframe projecting the longer term move, so make sure to go in my profile to check it out.
GOOD LUCK

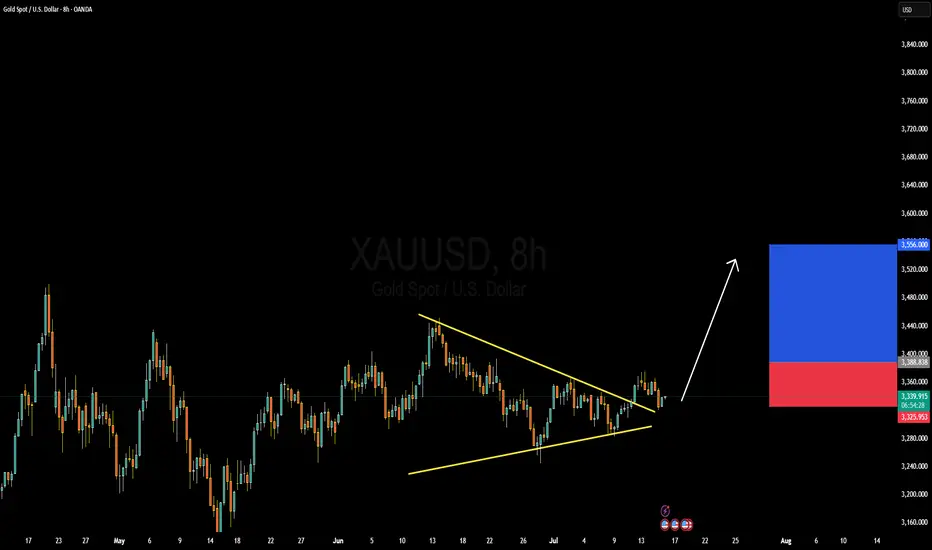
XAUUSD Forming Falling WedgeGold (XAUUSD) has recently completed a textbook falling wedge breakout, confirming a powerful bullish reversal setup on the higher timeframes. This pattern, known for its strong trend-continuation potential, has played out beautifully. After a period of consolidation and lower highs, price has decisively broken above wedge resistance and is now pushing higher with strong bullish momentum. We've already captured significant profit from the breakout zone, and price action suggests another wave to the upside is imminent.
Fundamentally, gold continues to benefit from growing geopolitical tensions, elevated inflation concerns, and central bank reserve accumulation. With the Federal Reserve leaning cautiously dovish due to signs of a softening labor market and cooling inflation, real yields are under pressure. This is supportive for gold, especially as markets begin to price in potential rate cuts before year-end. The weakening US dollar and stable treasury yields are reinforcing demand for precious metals, particularly among institutional investors seeking safety and hedge assets.
Technically, gold has broken its bearish structure and is forming a new bullish leg, supported by strong volume and RSI divergence at the lows. The breakout from the falling wedge pattern has opened up upside targets toward recent swing highs and potentially even all-time highs if macro conditions remain favorable. With price now above key moving averages and consolidating above the wedge breakout zone, the technical bias is clearly bullish.
This move aligns well with seasonality and macro risk flows. As risk-off sentiment slowly builds and inflation risks remain unresolved globally, gold is regaining its status as a premier safe-haven asset. Expecting continued follow-through in the coming weeks, with clean structure and fundamentals favoring bulls, this setup remains a high-probability opportunity to ride the next impulsive bullish leg.
xauusd setup"🌟 Welcome to Golden Candle! 🌟
We're a team of 📈 passionate traders 📉 who love sharing our 🔍 technical analysis insights 🔎 with the TradingView community. 🌎
Our goal is to provide 💡 valuable perspectives 💡 on market trends and patterns, but 🚫 please note that our analyses are not intended as buy or sell recommendations. 🚫
Instead, they reflect our own 💭 personal attitudes and thoughts. 💭
Follow along and 📚 learn 📚 from our analyses! 📊💡"
Gold market trend analysis and exclusive analysis.Analysis of the latest gold market trends:
Analysis of gold news: The U.S. Department of Labor released the much-anticipated June Consumer Price Index (CPI) data at 20:30 Beijing time. After the CPI data was released, the financial market responded quickly, showing investors' recalibration of inflation data and monetary policy expectations. The U.S. dollar index (DXY) fell 16 points in the short term after the data was released, reflecting the market's interpretation of the core CPI being slightly lower than expected, which was dovish. The gold market reacted particularly sensitively. The core CPI was lower than expected, pushing spot gold up by $6 in the short term, indicating a brief rebound in safe-haven demand. In the short term, the probability of the Federal Reserve keeping interest rates unchanged in July is close to 100%, but the mild performance of the core CPI reserves the possibility of a rate cut in September or earlier. The market needs to pay close attention to subsequent data, especially the July CPI and PCE price index, to determine whether inflation will continue to rise.
Gold technical analysis: This week's upward breakthrough of 3375 further bullish on the 3400 mark; the daily average line diverges upward to support bulls, and bullish on bullish gains. However, if you want to rise, you must exert your strength today, otherwise the bulls may end at any time! The current support level is near the daily MA5 and the middle track. The next step is still the focus. If you want to rise, you can't go down here. Going down means continuing to sweep back to 3320 and 3300. Today's European session also broke high without continuation, and the US session formed a retracement to test the MA5 support level. As long as the middle track is not lost, the short-term will continue to touch the high, so the operation is very clear. In the short term, the short-term will rely on the support of the middle track to see a rebound, and the upper resistance is 3665-3375. The daily Bollinger Bands continue to close. If the upper 3375 is not broken, do not chase the high position, and beware of high-level selling. On the whole, today's short-term operation of gold recommends that the callback is mainly long, and the rebound is supplemented. The upper short-term focus is on the 3350-3360 line resistance, and the lower short-term focus is on the 3320-3310 line support.
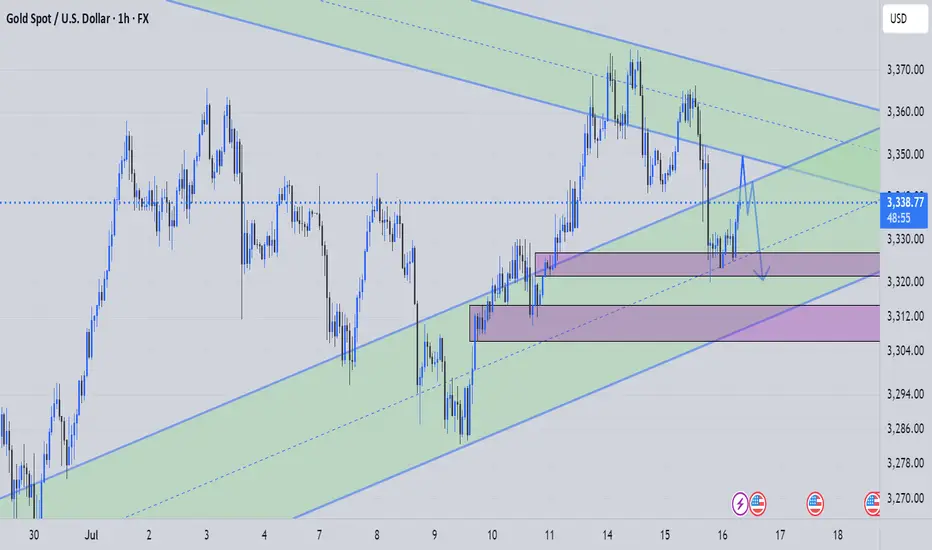
Diving through support, gold's downward space opens up!Gold reached a high of 3366. Although it broke through slightly, it failed to form an effective breakthrough and was only a false break. Subsequently, the bears led the market to continue to decline, breaking the key support of 3330 to 3320 at the end. The daily line closed with a medium-sized Yin line, directly breaking the short-term moving average support, ending the previous three-day positive trend. After the single Yin retreat, the upward trend failed to continue, and the risk of technical pattern reversal increased. The bears chose to break down, indicating that the market may fall further. The first test below is the support of the previous starting point of 3300. If this position is lost, the bearish target will point to the area near the previous low of 3270. The current market atmosphere is bearish, and the key pressure above has moved down to the 3340 line. It is expected that the rebound will be difficult to reach.
In terms of operation strategy: It is recommended that if gold rebounds first, it can be considered to continue to short near 3336-3338, stop loss 3347, and the target is 3310-3300 and below, and strictly stop loss to control risks. The overall bearish view is maintained.

GOLD...Hello friends
Due to the entry of buyers and the strong breakdown of the indicated resistance, the price is expected to move to the indicated targets.
*Trade safely with us*

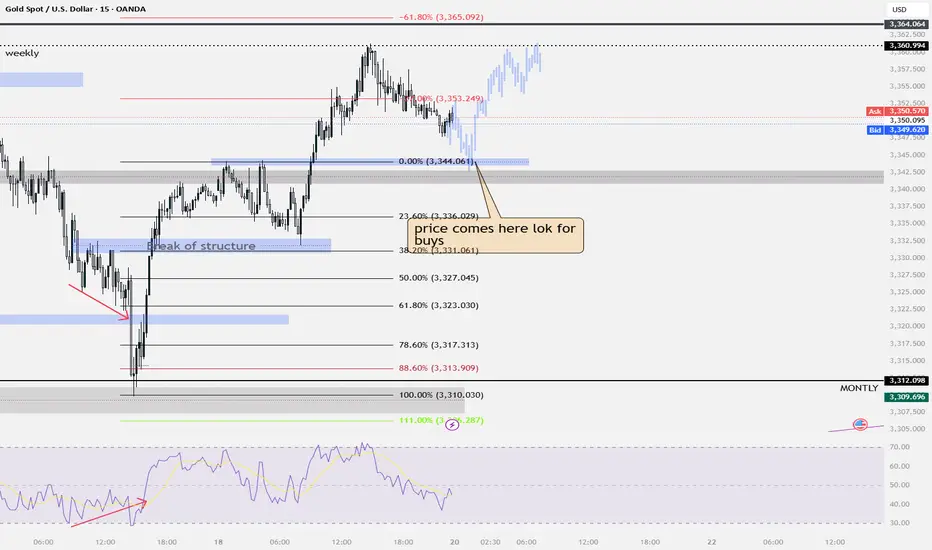
XAUUSD Long OpportunityXAUUSD is currently on a retracement from the Asian high of the day at $3365. Looking for a Long opportunity from either the pivot level at $3351 (Break and Retest zone) or the Asian lows of the day at $3342.
Momentum is in favour of further bullish movements with these key level provide the best platform for the market to continue the bullish move. Price is trading above both the 21 and 50 SMA at these levels and is perfectly situated in the sweet spot region of the RSI (between 45-55) indicating that the retracement is nearing the end and we could see a pivot in the next few hours.
Looking for entry on the 5 minute chart and will be awaiting the NY market open for added liquidity into the market which could push it further into the bullish territory and beyond the high of $3365. Will need to be wary of the volatility at the open but will be looking at this bullish move continuing throughout the NY Session.
Will also be awaiting the release of CPI to confirm the strength in Gold and weakness in USD for added bullish confluence for this market.
