GOLD Buyers In Control Now , Long Setup To Get 200 Pips !Here is My 15 Mins Gold Chart , and here is my opinion , we finally above 3358.00 and we have a 4H Candle closure above it And Perfect Breakout and this give us a very good confirmation cuz we have not any 4H closure above this area since this week start , so we have a good confirmation now to can buy after the price go back to retest the broken area to can use a small stop loss , and we can targeting 100 to 200 pips . if we have a daily closure below this area this mean this idea will not be valid anymore .
Reasons To Enter :
1- Clear Breakout On Bigger T.F
2- Clear Bullish Price Action .
3- Bigger T.F Giving Good Bullish P.A .
4- The Price Take The Last High .
Xauusdlong

XAUUSD UPDATE Gold will be buying and had already triggered my trade but will take partials if necessary and keep following the structure carefully, zero indicators used

XAUUSD 4H Analysis – Bullish Reversal OpportunityGold is currently trading around $3,336, retesting a key demand zone near $3,334 – $3,340 (green box). This zone has acted as strong support in the past, aligning with a major horizontal level and previous breakout retests.
🔍 Key Levels:
Support Zone: $3,334 – $3,340 (green box)
Resistance 1: $3,361
Resistance 2: $3,394
Major Demand Zone Below: $3,223
📊 Technical Outlook:
Price has pulled back into a strong demand area after failing to break above the $3,394 resistance. If bulls defend this green zone, we could see a bounce toward $3,361 and potentially $3,394. A clean break above $3,394 could open the door for a retest of the $3,420+ zone.
However, if this demand zone breaks, sellers could push price lower toward $3,223.
💡 Trading Plan:
Buy Entry: Around $3,334 – $3,340 (on bullish confirmation)
Stop Loss: Below $3,323
Take Profit 1: $3,361
Take Profit 2: $3,394
⚠ Disclaimer: This is not financial advice. Always conduct your own analysis and manage risk properly before trading.
#XAUUSD #Gold #Forex #Trading #PriceAction #TechnicalAnalysis #SwingTrade #SmartMoneyConcepts #SupportAndResistance #CommodityTrading

Potential Rebound | Swing Opportunity Illustrated is a potential entry for a swing opportunity to target ATH, at least 3400 - 3500
NY’s manipulation on Tuesday was a key price action that shows intentions of retesting 3400.
—
GOOD LUCK

GOLDEN GOLD XAUUSD Gold now hasn’t triggered ,so made some adjustments and will wait patiently and wait for the trade to be valid or triggered

XAU/USD Bullish Bounce from Demand Zone !Gold (XAU/USD) on the 4H chart is showing a potential bullish reversal setup. Price has pulled back into a Fair Value Gap (FVG) and high supply/demand zone near 3,329–3,315, aligning with the 0.382–0.5 Fibonacci retracement.
Key Points:
Support Zone: 3,329–3,315 (demand + FVG).
Bullish Rejection Expected: Price may bounce from this zone, targeting upper resistance levels.
Upside Targets:
TP1: 3,356
TP2: 3,375
TP3: 3,440–3,459 (major resistance)
Invalidation: A daily close below 3,315 could open room for deeper downside toward 3,278–3,245.
Indicators: EMA(9) and Ichimoku showing potential for trend resumption if price closes above 3,362.
Overall, the chart suggests a buy setup on bullish confirmation, aiming for the 3,375–3,459 zone.

GOLD (XAU/USD) – 2H Price Action & SMC Outlook# 🟡 GOLD (XAU/USD) – 2H Price Action & SMC Outlook
**Date:** 2025/08/12
**Timeframe:** 2H (Heikin Ashi)
**Style:** Smart Money Concept (SMC) + Fair Value Gap (FVG)
---
## 📊 Market Context
Gold is currently testing the **FVG support area** around **3,349 – 3,350**, with a visible **CHOCH** structure forming on the chart. The reaction from this level will be critical in determining the next directional move.
---
## 📈 Bullish Scenario (Primary)
1. **Condition:**
- Price respects the FVG zone (**3,349.9**)
- CHOCH breaks to the upside
- Clean break and close above **3,401.2**
2. **Expected Move:**
- Retest of the breakout zone for liquidity grab
- Extension towards **3,440** as the main target
3. **Targets:**
- 🎯 TP1: **3,401.2** (break confirmation)
- 🎯 TP2: **3,440** (major resistance & supply)
4. **Invalidation:**
- A close below **3,345** would weaken the bullish case and expose lower demand.
---
## 📉 Bearish Scenario (Alternative)
1. **Condition:**
- Price fails to break **3,401.2**
- Strong rejection from the descending trendline
2. **Expected Move:**
- Return to the FVG zone at **3,349.9**
- If broken, possible continuation towards **3,320 – 3,325**
---
## ⚠️ Analysis Validity
This analysis remains valid while **FVG support holds** and a **bullish CHOCH breakout** occurs.
Failure to hold the FVG could trigger deeper retracements.
---
#XAUUSD #GoldAnalysis #SMC #FVG #CHOCH #TradingView

Gold price drops, selling pressure and CPI news⭐️GOLDEN INFORMATION:
Gold (XAU/USD) found some buying interest in the Asian session, rebounding from Monday’s steep drop to the $3,341 level — its lowest in over a week. The U.S. Dollar struggled to build on its two-day advance as traders stepped to the sidelines ahead of the release of the latest U.S. consumer inflation data later today.
The Consumer Price Index (CPI) report will be pivotal in shaping expectations for the Federal Reserve’s rate-cut trajectory, which will, in turn, influence the Greenback’s direction and could provide fresh momentum for the non-yielding yellow metal.
⭐️Personal comments NOVA:
CPI expected to increase, DXY increases, selling pressure on gold. Market recovers briefly before US trading session
⭐️SET UP GOLD PRICE:
🔥SELL GOLD zone: 3379- 3381 SL 3386
TP1: $3367
TP2: $3355
TP3: $3342
🔥BUY GOLD zone: $3320-$3318 SL $3313
TP1: $3332
TP2: $3344
TP3: $3356
⭐️Technical analysis:
Based on technical indicators EMA 34, EMA89 and support resistance areas to set up a reasonable BUY order.
⭐️NOTE:
Note: Nova wishes traders to manage their capital well
- take the number of lots that match your capital
- Takeprofit equal to 4-6% of capital account
- Stoplose equal to 2-3% of capital account

GOLD Melted , Clear Chance To Buy It Now , 150 Pips Waiting !Here is My 15 Mins Gold Chart , and here is my opinion , the price go down very hard after touch 3400.00 and melted to 3353.00 and we finally above 3358.00 and we have a 30 Mins Candle closure above it And Perfect Breakout and perfect bullish price action , so we have a good confirmation now to can buy it and we can targeting 100 to 200 pips as a small correction after this huge movement to downside in a very short period , so i will buy it to see if we have a correction for 150 to 200 pips at least .
Reasons To Enter :
1- New Support Created .
2- Bullish Price Action .
3- Bigger T.F Giving Good Bullish P.A .
4- 30 Mins Confirmation
5- Little Correction .

Gold Breaks Rising Wedge – Bearish Targets AheadGold recently broke down from a rising wedge pattern near the $3,385–$3,390 area, signaling potential bearish momentum. Price is currently trading around $3,360, staying below the broken wedge support and also below the main trendline. This breakdown aligns with a shift from short-term bullish to corrective/bearish movement. The trend has shifted bearish unless it reclaims $3,375–$3,388. Short-term bias favors more downside toward $3,350 and $3,342
Key Levels to Watch
- Immediate Resistance: $3,370 – $3,375 (wedge breakdown retest zone)
- Major Resistance: $3,388 – $3,395 (trendline and previous supply zone)
- Immediate Support: $3,350 – $3,352 (short-term Fib and horizontal support)
- Major Support: $3,335 – $3,340 (next demand area)
- Extended Downside Target: $3,322 (Fib 0.22 level)
Note
Please risk management in trading is a Key so use your money accordingly. If you like the idea then please like and boost. Thank you and Good Luck!

Gold Price Poised for Bullish Rebound Toward 3385After breaking out of the descending channel, gold entered a consolidation phase before facing a corrective dip. Current price action suggests a potential reversal from support, with bullish momentum likely to target the 3385 level in the short term. Key support lies around 3,260, and sustained buying pressure above this zone could fuel the projected upward move.|
Previous Trend:
Price was in a strong downtrend, moving inside a descending channel until the end of July.
This was followed by a sharp bullish breakout with strong volume, indicating a momentum shift.
Current Structure:
After the breakout, gold formed a sideways consolidation (yellow box), suggesting accumulation before the next move.
Recently, price retraced from the upper resistance zone and is now testing the lower horizontal support.
Key Levels:
Support Zone: 3,250 – 3,260 (critical demand area; a bounce here is expected).
Resistance Zone: 3,380 – 3,385 (short-term target).
Breakout Confirmation: A strong bullish candle above 3,300 would strengthen the move toward the target.

XAUUSD (Gold) price is ranging between 3248-3428 from April 2025XAUUSD (Gold) price is ranging between 3248-3428 from April 2025 to date, 11th August 2025.
Key level for selling 3380-3428 (before placing an order, must watch the daily candles and H4 for better understanding).
Gold overall has strong bullish momentum. In my view, gold is consolidating at the levels, but in the coming days, any new geopolitical event or any conflict in any country of the world will lead to more bullish momentum in gold.
As I mark it, buying gold is more safe and profitable in current situations, but keep in mind you must have the up-to-date geopolitical events and economic news.
If the price gets ranged and touches 3355, and you see any rejection candles after that and a strong confirmation candle, then you should place a buy trade with proper stop loss and take profit.

MY ANALYSIS ON XAUUSDLet's go through a top-down analysis for XAUUSD using the charts you've provided, starting from the 4-hour timeframe down to the 15-minute timeframe. I'll highlight key levels and POIs (order blocks, breaker blocks, and FVG) for possible trade setups.
1. 4-Hour Timeframe (Overall Market Structure)
* Market Structure: From the 4-hour chart, the market is in a bullish structure as it is making higher highs and higher lows.
* Key POI (Order Block / Breaker Block): There is a recent order block formed around 3,360.000, where the market pushed strongly upwards after a consolidation phase. This could be an area of interest if price revisits this level.
* Liquidity Sweep / Inducement: A potential inducement occurred when price broke the 3,375.000 level earlier, sweeping liquidity before pushing higher. This move suggests price could look to continue its upward momentum after a retrace.
* FVG: There's a gap between 3,375.000 and 3,380.000, which might get filled on a retrace. If the market revisits this level, we could expect a continuation.
2. 1-Hour Timeframe (Refining POIs)
* Market Structure: The price action continues to reflect a bullish trend , with higher highs and higher lows. The structure on this timeframe aligns with the 4-hour view.
* Key POI (Order Block / Breaker Block): There's another order block formed near 3,385.000 – 3,390.000. This is where the market saw a sharp upward movement, indicating a potential support zone for a retracement.
* Liquidity Sweep / Inducement: On this timeframe, we observe a small sweep of liquidity around 3,375.000, where price broke a minor support before rallying. This suggests further potential upside if the market returns to this level.
* FVG: There’s a noticeable gap around 3,400.000 – 3,405.000. If price comes back down into this zone, it could fill the gap before continuing the upward trend.
3. 15-Minute Timeframe (Entry Setup)
* Market Structure: The price continues to be bullish with a series of higher highs and higher lows in recent price action. Price is currently consolidating near the recent highs.
* Key POI (Order Block / Breaker Block): There is an order block near 3,395.000 where a sharp move upwards occurred. This could act as a potential entry point if price revisits it.
* Liquidity Sweep / Inducement: There's a liquidity sweep around 3,380.000, where price broke below before pushing upwards. If price returns to this area, we could expect a potential bounce to the upside.
* FVG: A small FVG is visible near 3,395.000. If price fills this gap and finds support, a long position could be considered.
---
TRADE SETUP
Bias: Bullish (uptrend).
* Buy Setup:
* Entry: Look for a price retracement to the order block near 3,395.000 – 3,380.000 (15-minute timeframe).
* Stop Loss: Place a stop below the recent swing low (around 3,375.000) to minimize risk.
* Target: The next target is around 3,400.000 – 3,410.000 , with a secondary target at the recent high near 3,420.000 on the 4-hour timeframe.
This setup aligns with the overall bullish structure and key points of interest. If price comes back into these zones, watch for confirmation signals like rejection or reversal candlestick patterns to enter.
ACCORDING TO DXYAccording to dxy Gold maybe will move 500 to 700 pips on Monday. So if you want to sell 1st session if 1H close below 3395 than make sell and last tp 3378 and wait for buy signal.

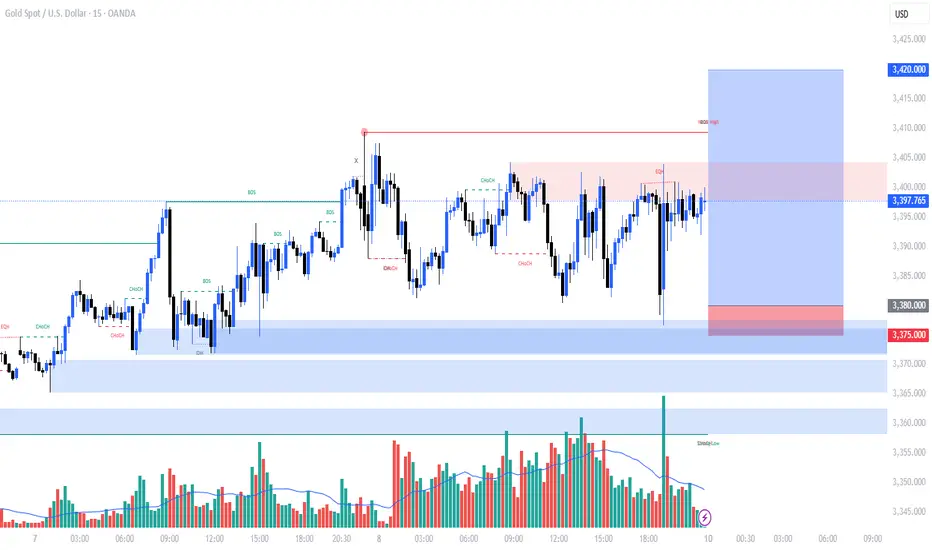
GOLD: Buy Dips Into DemandBuy the dip!
(H4) ✅ Bullish
Formed HL at 3355, strong displacement up from that zone
Current leg is targeting buy-side liquidity above 3432 and 3445
Unmitigated H4 demand: 3380–3388
(H1)
Series of HHs & HLs
Key Zone: 3380–3388
Next liquidity target / short-term resistance: 3432-3445
Wait for pullback into key zone or momentum break above 3405
(M15)
Micro bullish structure intact
Current short-term demand:3390–3395
Deeper demand: 3380–3388
Execution Triggers
Pullback Buy: Sweep 3380, M15 BOS above 3392, enter on retest
Breakout Buy: Break & close above 3405 with displacement, retest 3395–3400
❌ Invalidation
Break below 3355 = bullish structure compromised
Break below 3322 = trend shift to bearish

XAUUSD Gold Intraday Setup 8 Aug 2025Price is currently respecting the ascending trendline and a nearby demand zone around 3385. If price holds above this level, a potential long setup may develop.
Entry: Around 3385 (upon confirmation of support holding)
Stop Loss: Below 3375 (invalidate if this low breaks)
Target: Previous swing high near 3409
The setup aligns with the ongoing bullish structure. Monitor price action near the trendline for confirmation before entering.

I see a Bullish momentum to reach the old time high!Gold confirming bullish momentum. The breakout signals strong buying pressure, with price action targeting the previous all-time high. Sustained volume and favorable macroeconomic conditions are supporting the upward move, indicating potential for further gains if momentum holds.
gold on sell reverse#XAUUSD price have multiple retest between the second and third pattern, now we await for drop below 3370-3360 possible for buy reverse.
Sell entry 3390, stop loss 3400, take profit 3370-3360.
Possible long candle closure on H1 above 3402 will continue bullish till 3420.

Gold is aiming at 3,440.00.Gold is aiming at 3,440.00.
Gold’s upward trend is poised to continue, driven by potential Federal Reserve rate cuts, ongoing central bank purchases, and increased ETF investments. Markets are betting on a 93% chance of a rate cut at the Fed’s next meeting. Central banks added 166 tons to global gold reserves in Q2, according to the World Gold Council, while gold-backed ETFs experienced robust inflows during the same period.
XAUUSD has been trading bullish during August 7 trading session. Уven the geopolitical relief did not prevent gold from continuing its upward path. On August 7 the price has successfully retested the 3,380.00 support and is currently heading towards the level of 3,440.00.

XAU/USD (Gold) Triangle Breakout (07.08.2025)The XAU/USD pair on the M30 timeframe presents a Potential Buying Opportunity due to a recent Formation of a Triangle Breakout Pattern. This suggests a shift in momentum towards the upside and a higher likelihood of further advances in the coming hours.
Possible Long Trade:
Entry: Consider Entering A Long Position around Trendline Of The Pattern.
Target Levels:
1st Resistance – 3407
2nd Resistance – 3420
🎁 Please hit the like button and
🎁 Leave a comment to support for My Post !
Your likes and comments are incredibly motivating and will encourage me to share more analysis with you.
Best Regards, KABHI_TA_TRADING
Thank you.
Disclosure: I am part of Trade Nation's Influencer program and receive a monthly fee for using their TradingView charts in my analysis.

GOLD Breakout Done , Long Setup Valid To Get 150 Pips !Here is My 15 Mins Gold Chart , and here is my opinion , we finally above 3384.00 and we have a 30 Mins Candle closure above it And Perfect Breakout , so we have a good confirmation now to can buy it and we can targeting 100 to 150 pips .
Reasons To Enter :
1- New Support Created .
2- Bullish Price Action .
3- Bigger T.F Giving Good Bullish P.A .
4- Clean Breakout .

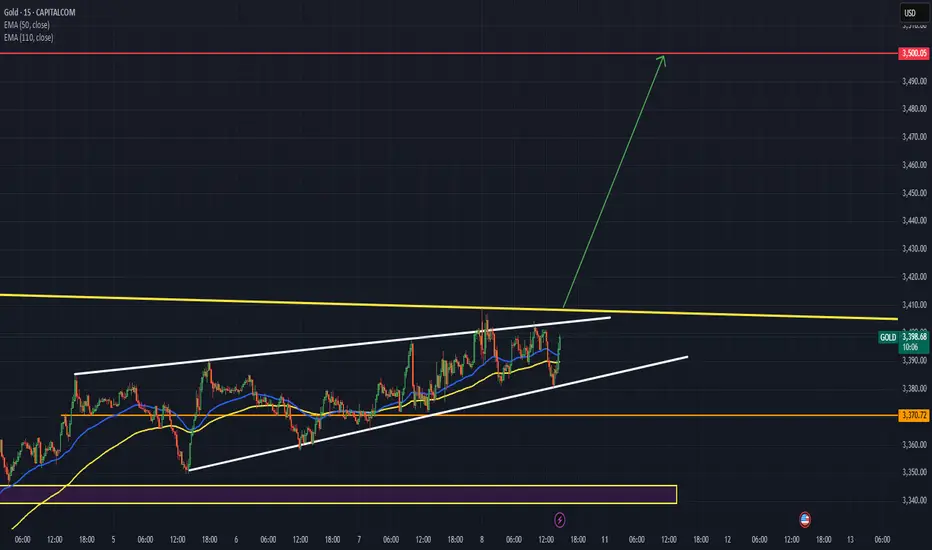
$3,600 Gold Incoming? The Accumulation Zone Says It All!Gold has been showing textbook price action. After years of testing, the long-term trendline was finally broken and then flipped into solid support, classic breakout-retest behavior.
Former resistance zones have consistently turned into support on the way up, confirming bullish strength. Now, price is consolidating in a tight range near all-time highs, this is not weakness, it's accumulation.
As long as the structure holds, this looks like a potential launchpad for the next leg higher.
Patience pays in gold; accumulation leads to expansion.
DYOR, NFA
Thanks for Reading!

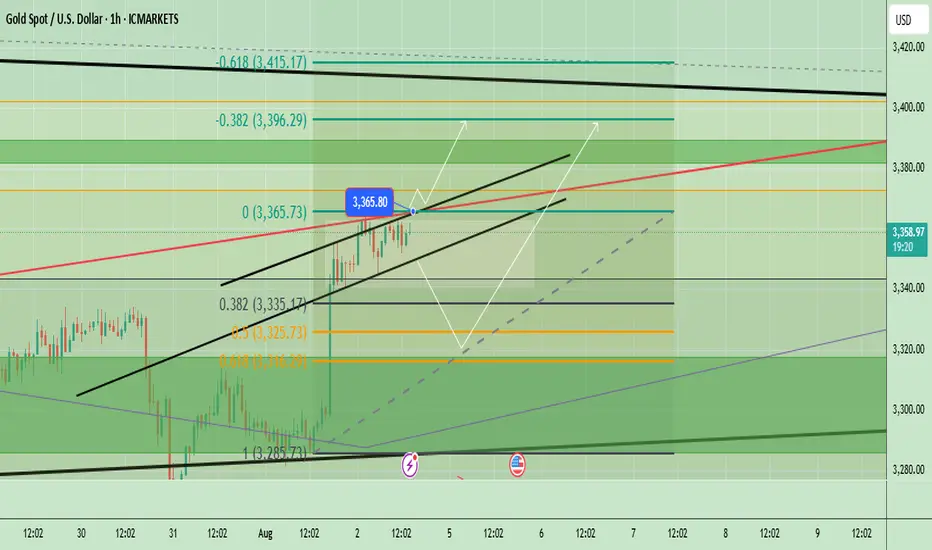
Gold Technical Analysis - Testing Key ResistanceGold has been showing a short-term bullish momentum after bouncing from the 3285 support zone, forming an ascending channel visible on the chart. The price is currently trading near 3361, close to the upper boundary of the channel and a key horizontal resistance level at 3365–3370. If the bullish momentum continues and price breaks above 3365–3370, we could see further upside toward 3396 and potentially 3400+. However, a failure to hold above this level could trigger a short-term retracement toward 3335–3325 support.
📈 Potential Scenarios:
- Bullish: If price sustains above $3,365, we could see an upside push toward $3,396 and possibly higher to $3,410 resistance.
- Bearish: A rejection near the channel top or $3,365 may lead to a pullback toward $3,325 (Fib 0.5) and then $3,285 support.
🔑 Key levels to watch:
- Upside: $3,365 → $3,396 → $3,410
- Downside: $3,335 → $3,325 → $3,285
- Trend Bias: Short-term bullish as long as price stays above 3325
Note
Please risk management in trading is a Key so use your money accordingly. If you like the idea then please like and boost. Thank you and Good Luck!