XAUUSDThe price on the 1h timeframe is within an ascending triangle, which can be promising. If the price breaks this pattern with bullish candles, it could easily rise by the distance of AB=CD.
Don’t forget to like and share your thoughts in the comments! ❤️
Xauusdt

XAUUSD (GOLD)As you can see, the price has reached the bottom of the ascending channel. If the price continues to follow this channel, it can rise again from here and return to its previous highs. My target for gold is 5950 dollars.
Don’t forget to like and share your thoughts in the comments! ❤️

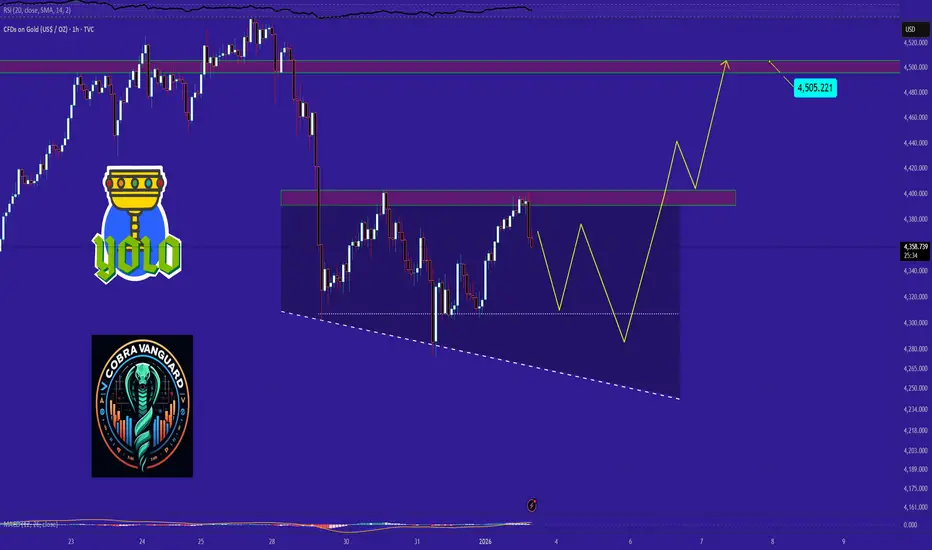
Gold has formed a potential bullish pennant pattern🚨📊 GOLD Update
Gold has formed a potential bullish pennant pattern 📈.
If the pattern plays out as expected,
the first target will be the green line level 🎯.
Waiting for confirmation,
breakout strength will be key.

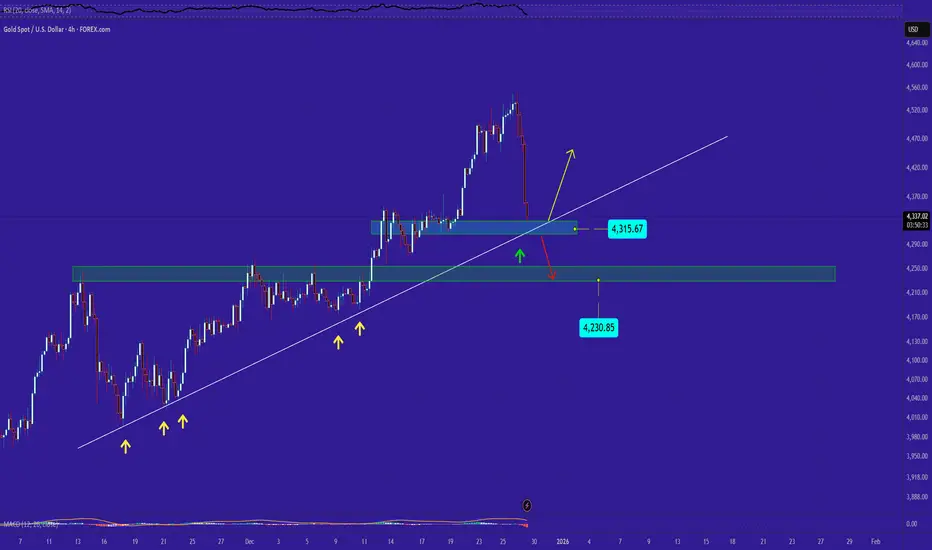
GOLD's SituationFor this drop, we can consider two support levels: one dynamic and one static. I’m hoping the dynamic support line can stop the decline. If not, and the dynamic support is broken, the price may fall down to around 4230.
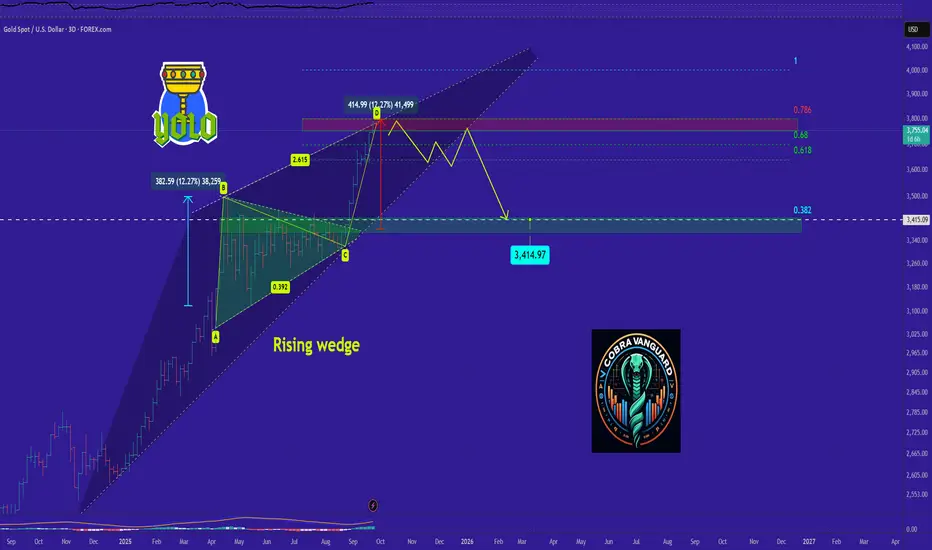
GOLD's SituationWe can be hopeful that after breaking out of the wedge, we will see significant price growth.AB=CD
Best regards CobraVanguard.💚
Give me some energy !!
✨We spend hours finding potential opportunities and writing useful ideas, we would be happy if you support us.
Best regards CobraVanguard.💚
Be careful with Gold !!!The price, in completing the corrective wave, can drop to the bottom of the ascending channel and then experience a strong rise back to the top of the channel.

XAU - Potential False Breakout Before Correction in Bearish FlagI expect a move toward the upper boundary of the bearish flag, with a possible false breakout before the market begins a deeper correction.
Upside targets are $4,450–$4,500, while the potential downside correction zone lies around $3,850–$3,800.

XAU/USD: Bearish Reaction Builds Below 4,130 ResistanceXAU/USD is approaching the edge of the resistance zone after a rebound from the $4,000 support area. Price remains within a wider consolidation, reacting to both the downward trendline and mid-range resistance.
If the market stays capped below 4,130, a drop toward 4,045 is likely as sellers regain short-term control. The overall pattern suggests a compressing structure, where bearish reactions within resistance zones continue to dominate.
❗️ Risks:
– Breakout above 4,130 could target 4,245, invalidating the bearish case.
– FOMC or macro news could push gold sharply higher.
– Failure to hold below mid-range may cause sideways drift instead of a clean drop.

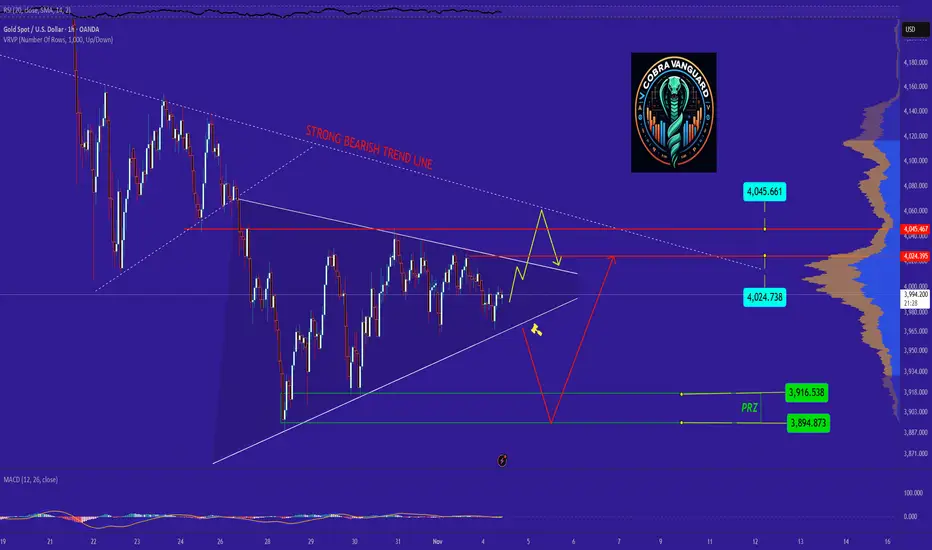
GOLD at the Brink Breakdown or Breakout?GOLD at the BrinkBreakdown or Breakout? —if the triangle breaks downward, it could fall toward the bearish PRZ zone. But if new positive news or rising Middle East tensions emerge, there's hope for a bullish move. For now, the news remains neutral.
What do you think—will GOLD fall or rise?
Gold Outlook after the Dip. What to expect NOW?The price correction has ended, and the price is now in a strong support zone according to Fibonacci levels. From this point onward, the price is expected to rise and retest its previous high.

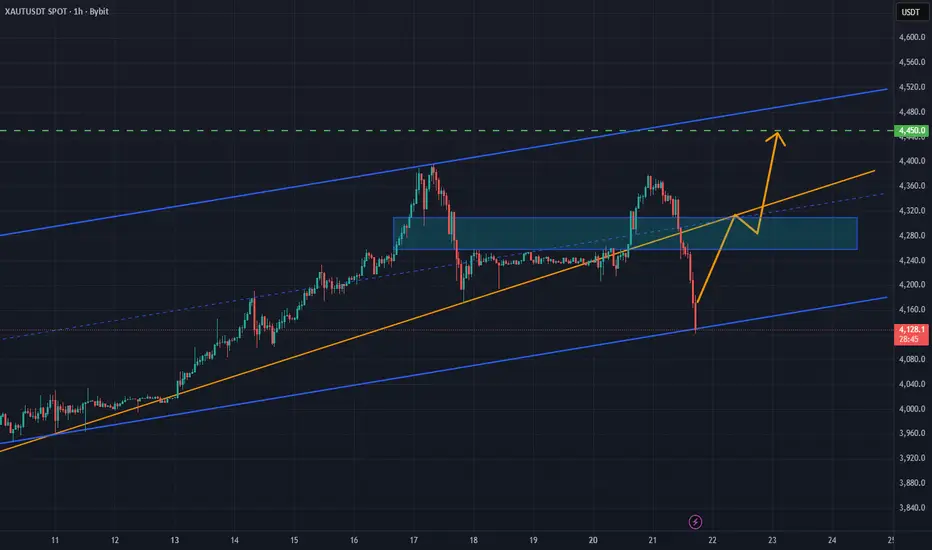
XAU/USD: Bullish Channel Structure Builds Toward Breakout ZoneXAU/USD continues to follow a bullish structure within an upward channel, forming impulse legs followed by measured pullbacks. The third test of the $4,380 resistance increases the likelihood of a breakout toward $4,450.
As long as price holds above the $4,250–$4,270 support zone, buyers remain in control. Momentum stays constructive, backed by higher lows and repeated rebounds from the trendline base.
Gold (XAUUSD) Weekly TF 2025Overview
This analysis outlines the structural Fibonacci confluences, scenario planning, and macro-aligned projections for Gold (XAUUSD) on the weekly timeframe. It integrates multi-layered Fibonacci extensions and retracements, mapping out key support and resistance levels, and proposes a nuanced primary scenario that includes both intermediate rallies and corrective movements.
Primary Scenario – Multi-Stage Movement Hypothesis
We anticipate that gold may initially extend higher from the current level (~$3,325) to test the 127.2% Fibonacci extension at $3,435, with the possibility of a further intermediate peak near $3,500. This level marks a psychological and technical resistance zone and could act as a temporary top.
Following this local peak, a corrective phase may unfold. This pullback could evolve into one of the two outlined correction scenarios:
1 TP Correction Scenario
Support Target: ~$2,950
Basis: 100% Fib extension confluence and prior resistance turned support
Expected Outcome: Price stabilizes at this level and resumes upward momentum
2 TP Correction Scenario
Support Target: ~$2,650
Basis: Strong historical structure + 100% Fib confluence from a broader cycle
Expected Outcome: This zone acts as a long-term demand accumulation area
Upon completion of the corrective structure, we expect gold to reinitiate its primary bullish trend.
Bullish Continuation Targets
TP1: ~$4,050 (161.8% Fibonacci extension)
TP2: ~$4,319 (261.8% Fibonacci extension)
These targets align with macroeconomic conditions, central bank accumulation trends, and long-term structural cycles.
Supporting Technicals
RSI: Holding above 50, indicating preserved bullish momentum
MACD: Positive crossover with widening histogram on weekly timeframe
Price Action: Strong support zone between $3,280–$3,300 aligning with 161.8% Fib retracement of the recent minor wave
Macro Fundamentals & Correlations
Central Bank Gold Demand: Sustained net buying by BRICS nations, particularly China and Russia, supports the structural bid on gold
Fed Policy: Market anticipates a prolonged pause or gradual rate cuts, favoring non-yielding assets like gold
DXY & US10Y Yields: Any further decline in DXY or softening yields would add tailwinds to gold
Crypto Correlation: During inflationary hedging or systemic risk periods, gold and crypto may correlate positively, especially with weakening USD
Intermarket Relationships: Gold, DXY, and TOTAL (Crypto Market Cap)
Gold vs. DXY (US Dollar Index)
Gold historically maintains an inverse correlation with DXY. A rising DXY tends to apply downward pressure on gold prices, while a falling DXY enhances gold's upside momentum.
Scenario Interactions:
If DXY breaks below 98, this could validate the bullish scenario for gold toward $3,435–$4,050.
If DXY rallies back above 100, it could trigger the correction scenarios ($2,950 or $2,650) in gold.
Gold vs. TOTAL (Crypto Market Cap)
Gold and TOTAL may show positive correlation during periods of USD weakening and global liquidity expansion.
Scenario Interactions:
If gold rallies toward $3,500 and TOTAL also breaks key resistance (e.g., $1.8T–$2T), this signals synchronized bullish risk appetite.
If gold corrects while TOTAL continues to rise, it could indicate rotation of liquidity from defensive to risk-on assets.
A simultaneous correction in both may occur if DXY strengthens aggressively or if macro shocks reduce global liquidity.
These intermarket relationships should be monitored continuously to assess the evolving macro context and validate the chosen scenario.
In the case of a gold correction toward $2,950 or $2,650, the impact on altcoins will hinge on the prevailing macroeconomic backdrop. If the correction stems from a healthy, technical rebalancing within a risk-on environment—without a concurrent surge in the U.S. dollar—it could signal a shift in capital from defensive assets like gold into more speculative plays, including altcoins. This type of capital rotation often benefits the crypto market, particularly if TOTAL (crypto market cap) holds or advances structurally. However, if the correction is caused by rising dollar strength, tightening financial conditions, or broader risk-off sentiment, altcoins may instead suffer alongside gold, as liquidity is withdrawn across the board. Therefore, the context and drivers behind gold’s correction are crucial in assessing its downstream effects on altcoin performance.
From a philosophical lens, gold's cyclical ascent and retreat mirrors the rhythm of nature and human experience—expansion, contraction, and renewal. Just as rivers carve valleys before surging toward the ocean, the market too must surrender gains to gather force. A correction in gold is not merely a financial event, but a moment of recalibration—an inhale before the next exhale of momentum. It invites reflection: whether wealth seeks refuge or ventures into risk, whether fear contracts or ambition expands. In this interplay, altcoins may inherit the restless spirit of capital in search of yield, as gold, the ancient anchor of value, briefly pauses in its timeless journey.
Conclusion
We present a multi-phased path for gold where:
An initial bullish breakout toward $3,435–$3,500 forms a short- to mid-term peak
A subsequent correction brings gold to either $2,950 or $2,650, depending on macro triggers
A renewed bull rally drives gold toward $4,050 and potentially $4,319 and beyond
This scenario reflects both the cyclical nature of market structure and the macro-fundamental backing that continues to support long-term gold strength.

XAUUSD Video Analysis Brief – Weekly Forecast Summary (2025)This video summarizes the key scenarios and technical outlook for Gold (XAUUSD) on the weekly timeframe, integrating both Fibonacci-based projections and macro fundamentals.
Core Setup
Gold is currently positioned near the 161.8% Fibonacci extension (~$3,276).
A breakout toward $3,500 is possible before a potential corrective move.
Scenario 1: Bullish Continuation
Gold breaks above $3,435 → rallies to $4300 → continues toward major Fibonacci targets:
TP: $4,320, which is the Fibonacci level 261.8%
Scenario 2: Correction First
Gold fails to hold above $3,435 → triggers a healthy correction to:
TP1: $2,920
TP2: $2,650
If support 161.8% level holds in the correction zone, a renewed bullish phase is expected.
Macro Alignment
Central bank gold buying (notably BRICS) supports the long-term bid.
Fed policy leaning dovish → tailwinds for gold.
Inverse correlation with DXY:
DXY below 98.95 → bullish for gold
DXY above 100 → signals correction
Effect on Altcoins
If correction is risk-on driven, capital may rotate into altcoins.
If triggered by macro stress or USD strength, alts may fall alongside gold.
This analysis offers a multi-scenario framework to navigate the next major moves in gold, with key levels to watch for traders, investors, and macro analysts alike.

GOLD is bearish now and many Traders don't see it !!As you can see, the price is within a descending wedge, and it has reached the upper boundary of this wedge. According to technical analysis patterns, the price has closely followed the AB=CD pattern, indicating a need for a slight correction. In the coming days, the price may range within this wedge, and if the pattern breaks, the price could drop to the Fibonacci levels shown.
$XAUTUSDt 300625 TRADE SETUPWaiting for Price to show its hand, then I'll take a Trade.
Overall 🔺BULLISH; anticipating the PWL to be souped where I will start hunting Entries to LONG.
For Entertainment. Not a Financial/Investment Advice.
What's your view❓

XRPUSDT UPDATE
Pattern: Falling Wedge Breakout
Current Price: \$2.5398
Target Price: \$3.90
Target % Gain: 55.29%
Technical Analysis: XRP has broken out of a falling wedge on the 1D chart with strong bullish momentum. The breakout is confirmed with a daily close above resistance and increased volume.
Time Frame: 1D
Risk Management Tip: Always use proper risk management.

$XAUUSD GOLDGold is putting on his best performance in the last few years.
In these phases, very often we can see an acceleration of movement
I also don't rule out the possibility that we break the channel up.
Gold remains a protective asset, and I want to say that this is not the top yet; now, every correction is a new entry point.
The question is, where will it be?
We will break this upward channel from below, stay under it for a while, and then go for new tops.
Now that all amateurs are convinced that everything is moving in the channel, we will break the channel down, and we need to go short. At the expense of these short positions, we will update the ATH. In 2025, I think it would be too easy.
Best regards EXCAVO
_____________________
Disclosure: I am part of Trade Nation's Influencer program and receive a monthly fee for using their TradingView charts in my analysis.

GOLD - Buy the RUMORS - SELL the news)GOLD - Buy the RUMORS - SELL the news)
market often front run some news evens and when it happens -0 make a reversal

xauusdtSupport and press the rocket to cheer me up
Observe the ten percent loss limit
Stay away from Bitcoins
Feel free to buy and sell and post your comments

Ready for CorrectionGold drops to 2830 to return to its trend line.
Give me some energy !!
✨We spend hours finding potential opportunities and writing useful ideas, we would be happy if you support us.
Best regards CobraVanguard.💚
_ _ _ _ __ _ _ _ _ _ _ _ _ _ _ _ _ _ _ _ _ _ _ _ _ _ _ _ _ _ _ _
✅Thank you, and for more ideas, hit ❤️Like❤️ and 🌟Follow🌟!
⚠️Things can change...
The markets are always changing and even with all these signals, the market changes tend to be strong and fast!!

Be careful with GOLD !!!As you can see, the price has made a fake breakout within the triangle, which is clearly visible on the MACD showing a bearish divergence. The price might drop to around 2685 and then try to break the triangle .
Give me some energy !!
✨We spend hours finding potential opportunities and writing useful ideas, we would be happy if you support us.
Best regards CobraVanguard.💚
_ _ _ _ __ _ _ _ _ _ _ _ _ _ _ _ _ _ _ _ _ _ _ _ _ _ _ _ _ _ _ _
✅Thank you, and for more ideas, hit ❤️Like❤️ and 🌟Follow🌟!
⚠️Things can change...
The markets are always changing and even with all these signals, the market changes tend to be strong and fast!!

GOLD road map (4h)The price will reach the top of Triangle = 2710 in the short term.Currently, the price is declining and it can go down to the 0.618 line and then reach the top of the triangle.
Give me some energy !!
✨We spend hours finding potential opportunities and writing useful ideas, we would be happy if you support us.
Best regards CobraVanguard.💚
_ _ _ _ __ _ _ _ _ _ _ _ _ _ _ _ _ _ _ _ _ _ _ _ _ _ _ _ _ _ _ _
✅Thank you, and for more ideas, hit ❤️Like❤️ and 🌟Follow🌟!
⚠️Things can change...
The markets are always changing and even with all these signals, the market changes tend to be strong and fast!!

