ElDoradoFx PREMIUM – GOLD ANALYSIS (30/10/2025, ASIA SESSION)🧠 XAUUSD (GOLD) – ASIA SESSION ANALYSIS (30/10/2025)
Professional Institutional Breakdown
⸻
1️⃣ Market Overview
Gold ended the NY session bearish after failing to sustain above 4,010, closing near 3,944. The market remains technically weak after a corrective bounce from 3,916, showing exhaustion under key EMAs. The current Asian range sits between 3,916 – 3,955, and the bias leans bearish unless price reclaims 3,985. The broader daily structure continues its retracement phase after the parabolic September–October rally.
⸻
2️⃣ Technical Breakdown
🔹 Daily (D1)
• Structure: Down correction within larger bullish channel.
• Candle: Small-bodied candle forming near the 20EMA, signaling indecision before potential continuation lower.
• Indicators: RSI at 47, below midline → bearish momentum intact. MACD histogram still negative.
• Key Levels: Support 3,850–3,820 | Resistance 4,005–4,040
📉 Outlook: Daily sentiment remains corrective-bearish. Price needs daily close above 4,005 to shift back bullish.
⸻
🔹 H1
• Structure: Lower highs and lower lows persist.
• EMAs: 20/50/200 aligned bearishly; price capped under the 200EMA (~3,978).
• RSI: 39 → mild recovery but still below 50 threshold.
• MACD: Bearish histogram fading; potential short-term relief rally before another drop.
• Zones: Overhead supply 3,955–3,965 + confluence with fib 61.8%.
📉 Outlook: Expect retracement into resistance followed by potential continuation lower.
⸻
🔹 15M–5M
• Minor bullish correction toward 3,950, but structure shows bearish compression.
• Liquidity resting above 3,955, likely to be swept before new leg down.
• MACD flattening; RSI approaching overbought (>60).
📊 Outlook: Watch for CHoCH or bearish engulfing in 3,955–3,965 zone to confirm re-entry short.
⸻
3️⃣ Fibonacci Analysis
Swing Reference: 3,993 → 3,916
• 38.2% = 3,946
• 50.0% = 3,955
• 61.8% = 3,964
🎯 Golden Sell Zone: 3,955 – 3,964
Confluence: H1 supply + descending EMA cluster.
⸻
4️⃣ High-Probability Trade Scenarios
📉 SELL Setup (Main Bias)
• Entry Zone: 3,955 – 3,964 (Golden Zone)
• Confirmation: 5M/15M bearish engulfing or CHoCH after liquidity sweep.
• TPs: 3,940 → 3,930 → 3,916 → 3,898 → 3,886
• SL: Above 3,976
💡 Rationale: Rejection from fib zone aligns with H1 structure continuation; best risk-reward short setup.
⸻
📉 SELL Continuation (Break & Retest)
• Trigger: < 3,930 confirmed break & retest
• Targets: 3,916 → 3,898 → 3,886
• SL: > 3,940
💡 Rationale: Trend continuation setup below local structure, confirming dominance of sellers.
⸻
📈 Countertrend BUY (Scalp)
• Zone: 3,916 – 3,924 (Asia demand)
• Confirmation: Bullish engulfing or double-bottom on 5M.
• Targets: 3,940 → 3,955 → 3,964
• SL: < 3,908
⚠️ Rationale: Pure liquidity scalp against trend; quick exits recommended.
⸻
💥 Breakout Opportunities
• Buy Breakout: > 3,985 → Targets: 4,013 / 4,030
• Sell Breakout: < 3,916 → Targets: 3,898 / 3,886 / 3,860
⸻
5️⃣ Fundamental Watch
• Asia session: Low-volume environment; volatility likely after Tokyo open.
• DXY stable around 106.00 → maintains downside pressure on gold.
• US GDP and unemployment claims upcoming — could impact NY sentiment.
⸻
6️⃣ Key Technical Levels
Type Levels
Resistance 3,955 / 3,964 / 3,985 / 4,013
Support 3,930 / 3,916 / 3,898 / 3,886
Golden Zone 3,955 – 3,964
Break Buy Trigger > 3,985
Break Sell Trigger < 3,916
⸻
7️⃣ Analyst Summary
Gold remains bearish in structure while inside a short-term corrective bounce. The 3,955–3,964 zone offers the highest probability for re-entry shorts with confirmation.
Below 3,930, sellers take control again targeting 3,898–3,886. Only above 3,985 would sentiment shift bullish toward 4,013–4,030.
📈 Institutional Bias: SELL rallies toward 3,955–3,964
📉 Invalidation: Sustained hourly close > 3,985
⸻
8️⃣ Final Bias Summary
📉 Overall Bias: Bearish
🎯 Primary Setup: Sell retracement 3,955–3,964 → Targets 3,916 / 3,886
⚠️ Alternate Setup: Buy scalp 3,916–3,924 (low probability)
🕐 Session Focus: Asia retracement sell or breakout below 3,916
⸻
🥇 ElDoradoFx PREMIUM 3.0 – PERFORMANCE 29/10/2025 🥇
📊 High volatility, clean recoveries, and strong finishes.
━━━━━━━━━━━━━━━
❌ SELL -40 PIPS
🔻 SELL +40 PIPS
⚪️ BUY LIMIT – Deleted
🔻 SELL LIMIT +40 PIPS
⚪️ BUY LIMIT – Deleted
🟢 BUY +40 PIPS
🔻 SELL +60 PIPS
❌ BUY -50 PIPS
🟢 BUY LIMIT +80 PIPS
🔻 SELL +210 PIPS
━━━━━━━━━━━━━━━
💰 GOLD TOTAL PIPS WON: +380 PIPS
📊 10 Signals → 6 Wins | 2 SL | 2 Deleted
🎯 Accuracy: 75%
━━━━━━━━━━━━━━━
🔥 Choppy day, but the team still closed strong — key levels respected with solid recoveries.
👏 Congratulations if you profited! ✅✅✅🚀🚀🚀
Xauusdupdate

GOLD Still Very Bearish , 2 Short Setups Valid To Get 500 Pips !Here is My 30 Mins Gold Chart , and here is my opinion , we are Below 3972.00 With 4H Candle And this never happened for a long time ! and we have a 4H Candle closure below it And Perfect Breakout and this give us a very good confirmation , so we have a good confirmation now to can sell after the price go back to retest the broken area 3972.00 and this will be my best place to sell to can use small stop loss , and i have another place if he price will not go up more to retest 3972.00 m we have a very good res level 3940.00 , if we have a good bearish price action when the price touch it we can sell from it and targeting 100 to 200 pips , and if the price didn`t give us a good bearish price action from it i will wait the price at 3972.00 to can sell and targeting 200 to 500 pips , if we have a daily closure above this area this mean this idea will not be valid anymore .
Reasons To Enter :
1- Perfect Breakout .
2- Clear Bearish Price Action .
3- Bigger T.F Giving Good Bearish P.A .
4- Bearish Control .
5- Perfect 4H Mins Closure .

GOLD Finally Bearish , Short Setup Valid To Get 300 Pips !Here is My 30 Mins Gold Chart , and here is my opinion , we finally Below 4050.00 With 4H Candle And this never happened for a long time ! and we have a 4H Candle closure below it And Perfect Breakout and this give us a very good confirmation , so we have a good confirmation now to can sell after the price go back to retest the broken area 4050.00 , and give us a good wicks as previous wicks ! and we can targeting 100 to 200 pips . if we have a daily closure above this area this mean this idea will not be valid anymore .
Reasons To Enter :
1- Perfect Touch For The Area .
2- Clear Bearish Price Action .
3- Bigger T.F Giving Good Bearish P.A .
4- Over Bought .
5- Perfect 30 Mins Closure .

ElDoradoFx PREMIUM – GOLD ANALYSIS (22/10/2025, ASIA SESSION)Gold (XAUUSD) is currently trading around 4,125, attempting a minor recovery after a strong bearish breakdown during the US session. Price found near-term liquidity around 4,106–4,100, where a short-term bounce is unfolding. Despite this pullback attempt, the overall structure remains bearish unless key resistance levels are reclaimed.
⸻
🔍 Technical Outlook
Daily Chart (D1)
• Strong bearish candle formed after rejection from 4,381.
• Price still above 20EMA and well above 50EMA, confirming a corrective move within a broader bullish trend.
• RSI cooling from overbought; now around mid-level, room for either further correction or bounce.
• MACD still positive but histogram weakening, suggesting potential retracement or pause.
Bias: Corrective bearish inside macro bullish trend.
⸻
1H Chart (H1)
• Clear bearish shift with BOS confirmed below 4,254 and 4,229.
• Rejection from 20EMA and 50EMA above (4,170–4,249) confirms intraday bearish bias.
• RSI recovering from oversold (26→38) indicating a potential pullback leg.
• If gold climbs into 4,160–4,198 zone and rejects, bearish continuation likely.
Intraday Bias: Bearish until H1 closes above 4,200–4,210.
⸻
15M Chart (M15)
• Minor CHoCH formed after bounce at 4,106, with price entering a corrective channel.
• RSI around 55 → short-term recovery phase.
• MACD histogram green but still shallow → possible retracement only.
• Price approaching first resistance around 4,140–4,150.
Short-term View: Pullback phase inside bearish structure.
⸻
5M Chart (M5)
• Series of higher lows forming → bullish momentum attempt.
• MACD positive with expanding green bars.
• RSI above 55 suggests buyers in short control, but nearing resistance.
⸻
✨ Fibonacci Golden Zone
Recent impulse: High 4,254 → Low 4,106
🔹 38.2% Fib = 4,160
🔹 50% Fib = 4,180
🔹 61.8% Fib = 4,198
✅ Golden Zone: 4,160 – 4,198
This zone aligns with intraday EMA resistance and H1 supply, making it a key sell area if rejection occurs.
⸻
🎯 High Probability Scenarios
✅ Bearish Continuation Setup (Preferred)
⚠️ Sell in the 4,160–4,198 Golden Zone upon bearish rejection.
🎯 Targets → 4,140 → 4,120 → 4,106 → 4,080
🛑 SL above 4,210
✅ Breakout Sell (Momentum Play)
⚠️ Sell below 4,106 (Break & Retest)
🎯 Targets → 4,080 → 4,060 → 4,040
🛑 SL above 4,120
⸻
🟢 Bullish Countertrend Setup (Lower Probability)
✅ Buy from 4,106–4,100 only if strong bullish engulfing + MACD flip appear.
🎯 Targets → 4,140 → 4,160 → 4,180
🛑 SL below 4,090
🟢 Bullish Breakout Setup (Structure Shift Only)
✅ Buy above 4,200 (Break & Retest)
🎯 Targets → 4,229 → 4,254
🛑 SL below 4,180
⸻
📅 Fundamental Outlook – Asia Session
• No major Asian economic catalysts early session → market may retrace or range.
• Traders likely positioning for NY session after heavy US selling.
• USD Index holding firm; any DXY weakness could extend pullback.
• Focus shifts to US jobless data and Fed sentiment later today.
⸻
⚠ Key Levels to Watch
Type Level Description
Resistance 4,140 / 4,160 First intraday rejection zones
Resistance 4,180 / 4,198 Fibonacci Golden Zone
Support 4,120 Minor intraday support
Support 4,106–4,100 Liquidity shelf
Support 4,080 Deep corrective target
⸻
✅ Summary
Gold is undergoing a corrective bounce within a bearish intraday trend. The Golden Zone (4,160–4,198) is the critical area for potential continuation sells if rejection is confirmed. A failure to clear 4,200 keeps sellers in control. Buyers only gain momentum above 4,200, or at deep retests near 4,106 with bullish confirmation.
🟢 Reversal Buy only if 4,106 holds with strength.
🔻 Main Scenario: Sell rallies from 4,160–4,198 zone.
📉 Break Confirmation: Sell below 4,106.
✨ Golden Zone: 4,160 – 4,198.
⸻
🥇 ElDoradoFx PREMIUM 2.0 – PERFORMANCE 21/10/2025 🥇
📊 GOLD TRADE RESULTS:
🔻 SELL +210 pips
🟢 BUY LIMIT +20 pips
❌ BUY –40 pips (SL)
🟢 BUY +70 pips
🟢 BUY +100 pips
🔻 SELL +210 pips
🟢 BUY +270 pips
---
💰 TOTAL GOLD PIPS WON: ✅ +840 pips
📈 RESULT: 7 Signals → 6 Wins | 1 SL
🎯 ACCURACY: 86%
---
🔥 Solid upward momentum and precision in reversals — swing continuation played out beautifully 📈💎
👏 Congratulations if you profited! ✅✅✅🚀🚀🚀

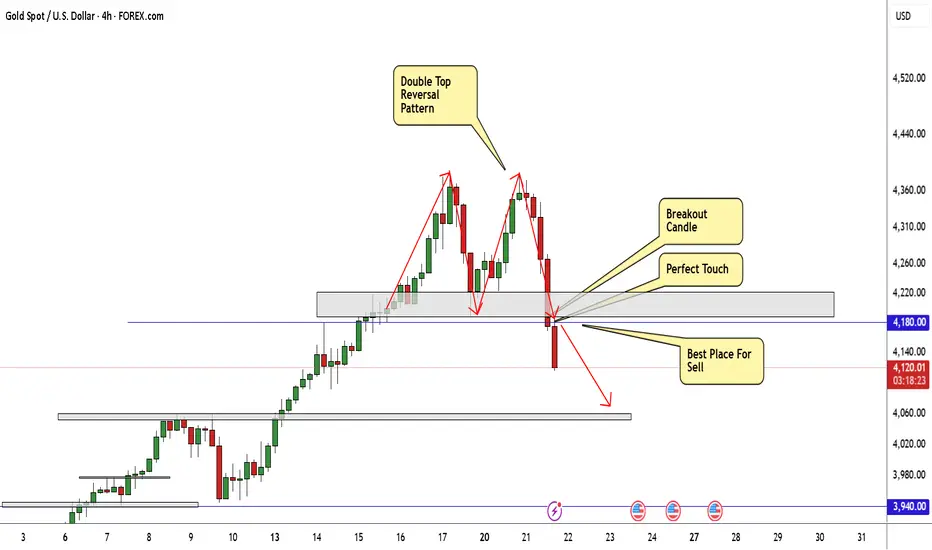
GOLD Finally Made Reversal Pattern , Short Setup To Get 400 PipsHere is my 4H Chart On GOLD , And finally the chart made a reversal pattern The price creating a very clear reversal pattern ( double top) and the price made a very good bearish price action now from good res area so we can enter a sell trade after the price back to retest the neckline to can use a small stop loss and targeting 200 to 400 pips , this is a good bearish movement after this massive movement to upside without any correction , so we will sell this pair for the next weeks .
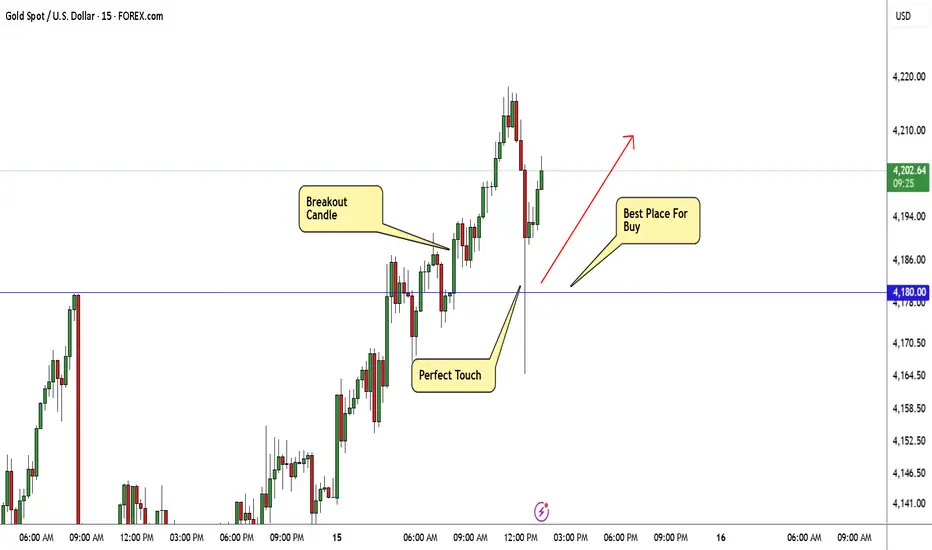
GOLD Breakout Done , Long Setup Valid To Get 300 Pips !Here is My 15 Min Gold Chart , and here is my opinion , the price going up very hard without any correction so we should move with it and we have a 4H Candle closure above our Res 4180.00 And Perfect Breakout and this give us a very good confirmation , so we have a good confirmation now to can buy after the price go back to retest the broken area 4180.00 One more time and we have already a great touch that take all stop losses before going up so i think the second touch will be better and will give us a good chance to enter with good stop loss , and we can be targeting 100 to 300 pips . if we have a daily closure below this area this mean this idea will not be valid anymore .
Reasons To Enter :
1- Perfect Touch For The Area .
2- Clear Bullish Price Action .
3- Bigger T.F Giving Good Bullish P.A .
4- The Price Take The Last High .
5- Perfect 4H Closure .
GOLD Continue To Upside ,Should We Buy It After Great Breakout ?Here is My 30 Min Gold Chart , and here is my opinion , the price going up very hard without any correction so we should move with it and we have a 4H Candle closure above our Res 4059.00 And Perfect Breakout and this give us a very good confirmation , so we have a good confirmation now to can buy after the price go back to retest the broken area 4059.00, and we can be targeting 100 to 200 pips . if we have a daily closure below this area this mean this idea will not be valid anymore .
Reasons To Enter :
1- Perfect Touch For The Area .
2- Clear Bullish Price Action .
3- Bigger T.F Giving Good Bullish P.A .
4- The Price Take The Last High .
5- Perfect 4H Closure .

BTC/USD (Bitcoin) chart on the 1D (Daily) timeframe..BTC/USD (Bitcoin) chart on the 1D (Daily) timeframe 👇
✅ Current Price: around $115,000
✅ Structure: Price bounced perfectly from the ascending trendline and cloud support zone.
✅ Trend: Bullish recovery forming after correction.
---
🎯 Target Levels
1. Primary Target: $122,000 – $124,000
This matches my marked “Target Point” area on the chart.
It’s also near the previous swing high and upper resistance zone.
2. Extended Target (if breakout continues): $126,000 – $128,000
Possible if daily candle closes above $124,000 with strong momentum.
---
🛡 Support / Stop-Loss
Strong support zone: $112,000 – $113,000 (trendline + Ichimoku cloud base).
Stop-loss (swing setup): below $111,000 — a clean invalidation of bullish structure.
---
🔍 Summary
Trend bias: Bullish
Buy zone: $114,000 – $116,000
Target 1: $122,000 – $124,000
Target 2: $126,000 – $128,000
Stop-loss: below $111,000

GOLD Best Places To Buy And Sell Cleared , 500 Pips Waiting !Here is m y opinion on GOLD On 30 Mins T.F , We have a Huge movement To Upside since Last 6 weeks , started between 3870.00 to 3980.00 so we can buy and sell Gold This Week from 2 areas , 3940.00 will be the best place for Buy and 3975.00 will be the best place for Sell , now the price very near buy area so we can wait the price to retest the support area and then enter a buy trade and targeting 3975.00 and when the price touch it and give us a good bearish P.A , we can enter a sell trade and targeting 3940.00 , It`s All Depend On Price action . I`m Sure that the main direction now is buy so i`m interesting to buy gold from 3940.00 but the best place for me will be 3895.00 cuz the price didn`t retest it until now and you can check my analysis about 3895.00 , so my res area it should be a scalping trade but my main focus will be on buy gold until end of the year .
Entry Reasons :
1- Highest Level The Price Touch It
2- Broken Res
3- New Support Created .
4- Clear Price Action .
5- Clear Support & Res .

XAU/USD 07 October 2025 Intraday AnalysisH4 Analysis:
-> Swing: Bullish.
-> Internal: Bullish.
Price had printed a bearish CHoCH. Where we were trading within an established internal range, however, bearish pullback was insignificant relative to recent price action, therefore, I will not classify the bullish, I have however marked this in red again.
Price has continued bullish printing further ATH's. Price has since printed a bearish CHoCH, which is the first indication, but not confirmation, of bearish pullback phase initiation, however, I will continue to monitor price with respect to dept of pullback.
Price is currently trading within and established internal range.
Intraday Expectation:
Price to trade down to either discount of internal 50% EQ, or H4 supply zone before targeting weak internal high priced at 3,977.400.
Alternative scenario: Price could potentially print higher-highs.
Note:
The Federal Reserve’s sustained dovish stance, coupled with ongoing geopolitical uncertainties, is likely to prolong heightened volatility in the gold market. Given this elevated risk environment, traders should exercise caution and recalibrate risk management strategies to navigate potential price fluctuations effectively.
Additionally, gold pricing remains sensitive to broader macroeconomic developments, including policy decisions under President Trump. Shifts in geopolitical strategy and economic directives could further amplify uncertainty, contributing to market repricing dynamics.
H4 Chart:
M15 Analysis:
-> Swing: Bullish.
-> Internal: Bullish.
Price continued bullish, printing further ATH's.
Price has printed a bearish CHoCH which indicates, but does not confirm, bearish pullback phase initiation. We are now confined with an establish internal range, however, I shall continue to monitor price with respect to depth of pullback.
Intraday expectation: Price to trade down to either M15 supply zone, or discount of 50% EQ before targeting internal high priced at 3,977.400
Alternative Scenario: Price could potentially target strong internal low as H4 TF enters it's bearish pullback phase.
Note:
Gold remains highly volatile amid the Federal Reserve's continued dovish stance, persistent and escalating geopolitical uncertainties. Traders should implement robust risk management strategies and remain vigilant, as price swings may become more pronounced in this elevated volatility environment.
Additionally, President Trump’s tariff announcements are expected to further amplify market turbulence, potentially triggering sharp price fluctuations and whipsaws.
M15 Chart:

GOLD Breakout Done , Long Setup Valid To Get 300 Pips !Here is My 30 Min Gold Chart , and here is my opinion , the price going up very hard without any correction so we should move with it and we have a 4H Candle closure above our Res 3895.00 And Perfect Breakout and this give us a very good confirmation , so we have a good confirmation now to can buy after the price go back to retest the broken area 3895.00 , and we can be targeting 100 to 300 pips . if we have a daily closure below this area this mean this idea will not be valid anymore .
Reasons To Enter :
1- Perfect Touch For The Area .
2- Clear Bullish Price Action .
3- Bigger T.F Giving Good Bullish P.A .
4- The Price Take The Last High .
5- Perfect 4H Closure .

GOLD Best Places To Buy And Sell Cleared , 1000 Pips Waiting !Here is m y opinion on GOLD On 30 Mins T.F , We have a Huge movement To Upside since Last 4 weeks , started between 3870.00 to 3895.00 so we can buy and sell Gold This Week from 2 areas , 3870.00 will be the best place for Buy and 3895.00 will be the best place for Sell , now the price very near buy area so we can wait the price to retest the support area and then enter a buy trade and targeting 3895.00 and when the price touch it and give us a good bearish P.A , we can enter a sell trade and targeting 3870.00 , It`s All Depend On Price action .
Entry Reasons :
1- Highest Level The Price Touch It
2- Broken Res
3- New Support Created .
4- Clear Price Action .

Gold Going Up Hard , Can We Get 250 Pips From This Wave ?Here is My 15 Min Gold Chart , and here is my opinion , the price going up very hard without any correction so we should move with it and we have a 4H Candle closure above our Res 3872.00 And Perfect Breakout and this give us a very good confirmation , so we have a good confirmation now to can buy after the price go back to retest the broken area 3872.00 , and we can be targeting 100 to 200 pips . if we have a daily closure below this area this mean this idea will not be valid anymore .
Reasons To Enter :
1- Perfect Touch For The Area .
2- Clear Bullish Price Action .
3- Bigger T.F Giving Good Bullish P.A .
4- The Price Take The Last High .
5- Perfect 4H Closure .

XAU/USD 01 October 2025 Intraday AnalysisH4 Analysis:
-> Swing: Bullish.
-> Internal: Bullish.
Price printed as per yesterday's intraday analysis whereby I mentioned in alternative scenario that price could print higher, however, weak internal high price target has changed.
Price is currently trading within an internal low and fractal high. CHoCH positioning is denoted with a blue horizontal dotted line.
Intraday Expectation:
Price to print bearish CHoCH to indicate bearish pullback phase initiation, price to then trade down to either discount of internal 50% EQ, or H4 supply zone before targeting weak internal high priced at 3,871.890.
Alternative scenario: Price could potentially print higher-highs.
Note:
The Federal Reserve’s sustained dovish stance, coupled with ongoing geopolitical uncertainties, is likely to prolong heightened volatility in the gold market. Given this elevated risk environment, traders should exercise caution and recalibrate risk management strategies to navigate potential price fluctuations effectively.
Additionally, gold pricing remains sensitive to broader macroeconomic developments, including policy decisions under President Trump. Shifts in geopolitical strategy and economic directives could further amplify uncertainty, contributing to market repricing dynamics.
H4 Chart:
M15 Analysis:
-> Swing: Bullish.
-> Internal: Bullish.
Price printed as per yesterday's intraday analysis whereby I mentioned price to trade down to either M15 supply zone, or discount of 50% EQ before targeting weak internal high priced at 3,871.890.
Price has printed a bullish iBOS.
CHoCH positioning is denoted with a blue horizontal dotted line.
Price is currently trading within an internal low and fractal high.
Intraday Expectation:
Price to print bearish CHoCH, to indicate, but not confirm, bearish pullback phase initiation. Price to then trade down to either M15 supply zone, or discount of 50% EQ before targeting weak internal high priced at 3,895.500.
Alternative Scenario: Price could potentially target strong internal low as H4 TF enters it's bearish pullback phase.
Note:
Gold remains highly volatile amid the Federal Reserve's continued dovish stance, persistent and escalating geopolitical uncertainties. Traders should implement robust risk management strategies and remain vigilant, as price swings may become more pronounced in this elevated volatility environment.
Additionally, President Trump’s recent tariff announcements are expected to further amplify market turbulence, potentially triggering sharp price fluctuations and whipsaws.
M15 Chart:

GOLD Breakout Done , Short Setup Valid To Get 200 Pips !Here is My 30 Mins Gold Chart , and here is my opinion , we finally Below 3750.00 With 4H Candle ! and we have a 4H Candle closure below it And Perfect Breakout and this give us a very good confirmation , so we have a good confirmation now to can sell after the price go back to retest the broken area 3750.00 , and we can targeting 100 to 200 pips . if we have a daily closure above this area this mean this idea will not be valid anymore .
Reasons To Enter :
1- Perfect Touch For The Area .
2- Clear Bearish Price Action .
3- Bigger T.F Giving Good Bearish P.A .
4- Over Bought .
5- Perfect 30 Mins Closure .

GOLD Very Bullish , Can We Buy Again And Get 200 Pips ?Here is My 30 Mins Gold Chart , and here is my opinion , the price going up very hard without any correction so we should move wit it and now we finally above 3760.00 With 4H Candle ! and we have a 4H Candle closure above it And Perfect Breakout and this give us a very good confirmation , so we have a good confirmation now to can buy after the price go back to retest the broken area 3760.00 , and we can targeting 100 to 200 pips . if we have a daily closure below this area this mean this idea will not be valid anymore .
Reasons To Enter :
1- Perfect Touch For The Area .
2- Clear Bullish Price Action .
3- Bigger T.F Giving Good Bullish P.A .
4- The Price Take The Last High .
5- Perfect 30 Mins Closure .

GOLD Breakout Done , Long Setup Valid To Get 200 Pips !Here is My 30 Mins Gold Chart , and here is my opinion , we finally above 3700.00 With 4H Candle ! and we have a 2H Candle closure above it And Perfect Breakout and this give us a very good confirmation , so we have a good confirmation now to can buy after the price go back to retest the broken area 3700.00 , and we can targeting 100 to 200 pips . if we have a daily closure below this area this mean this idea will not be valid anymore .
Reasons To Enter :
1- Perfect Touch For The Area .
2- Clear Bullish Price Action .
3- Bigger T.F Giving Good Bullish P.A .
4- The Price Take The Last High .
5- Perfect 30 Mins Closure .

Gold Price Falls After Fed DecisionGold Price Falls After Fed Decision
Yesterday, as expected, the Fed lowered its rate from 4.25%–4.50% to 4%–4.25%. Although rate cuts are generally seen as supportive for gold, the XAU/USD chart shows bearish price dynamics: after a short-term spike above $3700 (a new all-time high), gold retreated sharply, forming a long bearish candlestick (marked with a red arrow).
This may be explained by the fact that expectations of a rate cut had already been priced in, while at the press conference the Fed Chair struck a less “dovish” tone than the market had hoped for. While Jerome Powell did voice concerns about the labour market, he gave no clear signal of readiness for aggressive or rapid further cuts.
Technical Analysis of the XAU/USD Chart
At the start of the week, we:
→ drew a steep ascending channel (shown with orange lines);
→ suggested a potential move lower towards the orange dashed line (an additional support line plotted beneath the channel).
Indeed, the dashed line acted as support today. What are the possible scenarios?
Bearish view:
→ the long upper shadow of the candlestick marked with the arrow clearly points to strong selling pressure;
→ the price only briefly broke above the psychological $3700 level – a bull trap (or Liquidity Grab in Smart Money Concept terms);
→ $3675 has flipped from support to resistance.
Bullish view:
→ the dashed trendline has confirmed its role as support – it may help the price move towards the midline of the orange channel;
→ the $3600–$3625 area looks like solid backing. Following the rally in early September, gold repeatedly found support there without falling below it.
Considering that in early September the price was around $3450, the market still looks bullish overall. However, as we recently outlined three reasons why gold’s advance could stall, it now seems that the black line, drawn through lower lows, may serve as another bearish signal – this time on the lower timeframe.
This article represents the opinion of the Companies operating under the FXOpen brand only. It is not to be construed as an offer, solicitation, or recommendation with respect to products and services provided by the Companies operating under the FXOpen brand, nor is it to be considered financial advice.

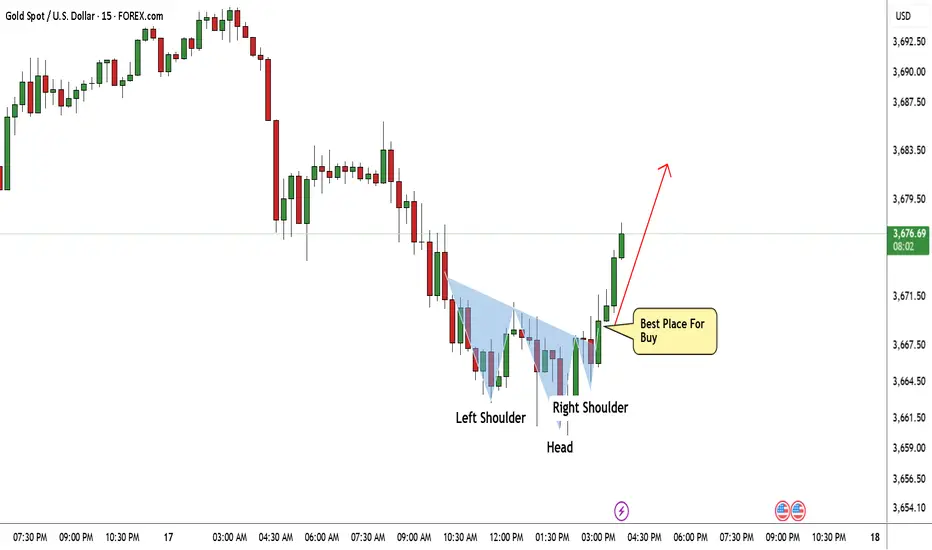
Gold Made A Clear Reversal Pattern , Long Setup To Get 200 PipsHere is my 15 Mins Chart On GOLD , The price creating a very clear reversal pattern ( Reversal head and shoulders pattern ) and the price made a very good bullish price action now and the price above my neckline. so we can enter a buy trade After the price go back to retest my broken neckline . For this trade we can be targeting from 100 : 150 pips with a decent stop loss.
Reasons To Enter :
1- Perfect Touch For The Area .
2- Clear Bullish Price Action .
3- Bigger T.F Giving Good Bullish P.A .
4- The Price Take The Last High .
5- Perfect 15 Mins Closure .
6- Reversal Pattern .
BTC/USD (Bitcoin vs USD).BTC/USD (Bitcoin vs USD)
Timeframe: 2-hour (2H)
Indicators: Ichimoku Cloud, Trendline, Support/Resistance zones
---
📊 Indicators Used
1. Ichimoku Cloud
Price recently broke above the descending trendline and is pushing into the cloud.
If it sustains above the cloud, that signals a potential trend reversal from bearish to bullish.
2. Support Zone (Green box)
Around 109,000 – 110,000 USD.
This is the base where buyers are stepping in.
3. Trendline Breakout
A downtrend line has been broken, suggesting the end of the short-term bearish momentum.
---
🎯 Targets (Based on my chart)
Target 1 (short-term): 117,173 USD
This is the first major resistance level.
Target 2 (medium-term): 123,000 USD
Next strong resistance zone and the final target marked on my chart.
---
⚠ Stop-Loss Suggestion
Below the support zone: ~108,500 – 109,000 USD
This protects against a false breakout.
---
✅ Summary
Breakout above downtrend line and moving into Ichimoku cloud = bullish signal.
First target: 117,173 USD
Second target: 123,000 USD
Stop-loss: Below 106,000 USD

Gold Price Stabilises Ahead of Central Bank DecisionsGold Price Stabilises Ahead of Central Bank Decisions
Following the ECB’s decision last week to leave interest rates unchanged, traders will closely monitor this week’s monetary policy announcements from the US Federal Reserve, the Bank of England, the Bank of Japan, and other central banks from Toronto to Taipei.
As the XAU/USD chart shows today, the gold price has stabilised after its recent record highs, with investors adopting a wait-and-see stance. The ADX indicator is trending lower, suggesting a diminishing directional momentum.
Key Drivers Influencing Gold Prices
Market participants are almost fully convinced that the Federal Reserve will cut rates by a quarter point this week, while also pricing in the likelihood of further reductions next year amid signs of labour market weakness. Lower rates are generally seen as supportive for gold, making it a more attractive asset relative to yield-bearing US Treasuries.
Additional factors underpinning bullish sentiment include:
→ Weakness in the US dollar.
→ Persistent geopolitical tensions.
→ Pressure on the Fed from Donald Trump, who recently attempted to dismiss Board Governor Lisa Cook.
→ Central bank gold purchases.
On the other hand, profit-taking could dampen demand. Nevertheless, gold prices remain elevated.
Technical Analysis of XAU/USD
Recently, we outlined three reasons why gold’s rally might pause. Since then, the price has consolidated within the $3,610–3,660 range.
This has confirmed the assumption that the median line of the long-term ascending channel is acting as resistance. The steep upward channel (marked with orange lines) has been broken.
What Could Happen Next
→ From a bullish perspective, the resistance levels at $3,510 and $3,575 have been broken to the upside and successfully retested – a sign of strong demand.
→ From a bearish perspective, the candlestick’s long upper shadow, where gold set its record high, reflects aggressive selling pressure.
An attempt to break below the $3,575 support level and the orange dotted line (an additional support trendline plotted beneath the orange channel) could happen.
However, whether this scenario materialises will largely depend on upcoming central bank announcements. Traders should brace for heightened volatility.
This article represents the opinion of the Companies operating under the FXOpen brand only. It is not to be construed as an offer, solicitation, or recommendation with respect to products and services provided by the Companies operating under the FXOpen brand, nor is it to be considered financial advice.

GOLD Very Bullish , Can We Buy Again And Get 200 Pips ?Here is My 15 Mins Gold Chart , and here is my opinion , we finally above 3639.00 and we have a 4H Candle closure above it and we have a Perfect Breakout and this give us a very good confirmation ,and also we have a reversal pattern and the price closed above neckline , so we have a good confirmation now to can buy from 3639.00 when the price back to retest it , we need the price to go back and retest it and give us a good bullish price action and then we can enter , we can targeting 100 to 200 pips . if we have a daily closure below this area this mean this idea will not be valid anymore .
Reasons To Enter :
1- Perfect Touch For The Area .
2- Clear Bullish Price Action .
3- Bigger T.F Giving Good Bullish P.A .
4- The Price Take The Last High .
5- Perfect 15 Mins Closure .
6- Reversal Pattern .

GOLD Breakout Done , Long Setup Valid To Get 200 Pips !Here is My 15 Mins Gold Chart , and here is my opinion , we finally above 3500.00 With Daily Candle ! and we have a 4H Candle closure above it And Perfect Breakout and this give us a very good confirmation , so we have a good confirmation now to can buy after the price go back to retest the broken area 3500.00 , and we can targeting 100 to 300 pips . if we have a daily closure below this area this mean this idea will not be valid anymore .
Reasons To Enter :
1- Perfect Touch For The Area .
2- Clear Bullish Price Action .
3- Bigger T.F Giving Good Bullish P.A .
4- The Price Take The Last High .
5- Perfect 15 Mins Closure .
