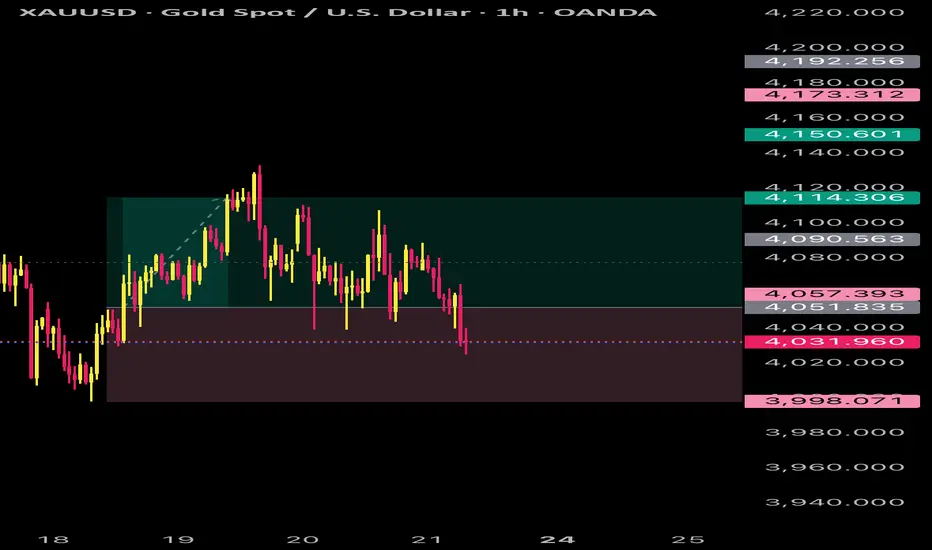
XAUUSD – H2 & H4 Technical Breakdown📌 H2 Chart (Left) – Short-Term Retracement
H2 maintains a clean bearish structure with lower highs along the descending trendline.
Price broke short-term support and is now retracing into a liquidity area at 4,050–4,065.
Expectation: a small liquidity grab → continuation lower.
➡️ Bias: SELL on retracement
➡️ Targets: 4,000 → 3,985
📌 H4 Chart (Right) – Bearish Continuation
H4 confirms a higher timeframe bearish trend after the CHoCH around 4,130.
The Liquidity Zone 4,062–4,082 aligns with trendline resistance.
This zone is likely to produce a rejection for the next push down towards HTF liquidity.
➡️ HTF Target: 3,965 – 3,980
🎯 SPHYN Final Bias
🔻 Overall Bias: Bearish
🔻 Optimal SELL zone: 4,060–4,082
🔻 Main Target: 3,965
Xauusdupdates

XAUUSD PROFITABLE Gold had behaved accordingly and hit take profit, next move can be to wait and relax for it to play out before executing
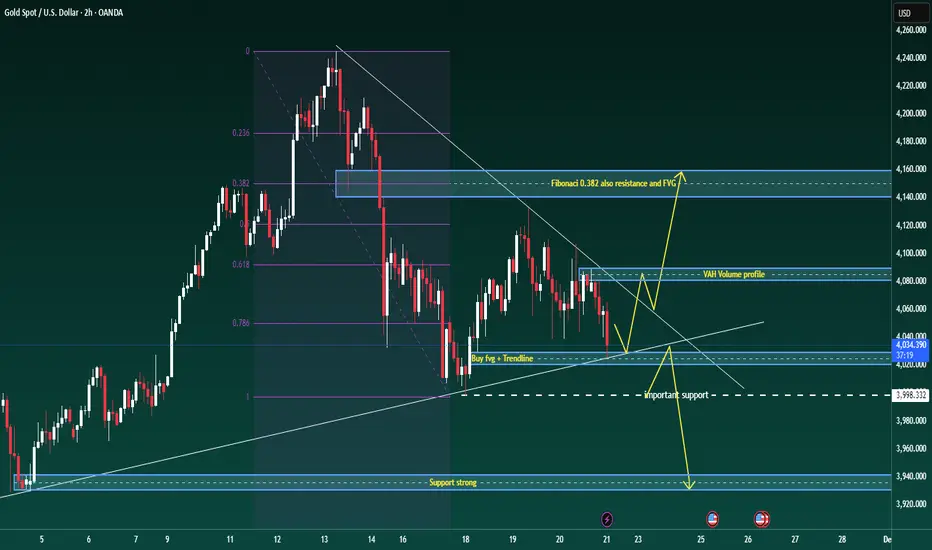
Gold is stuck in a wide range, ready for a decisive break.Good evening traders, Brian here with a fresh look at gold on the 2-hour chart.
Price is compressing in a broad sideways range, building energy for the next leg – the break from this structure will set the tone for the coming sessions.
Fundamental analysis
The core driver remains the Fed’s December decision. The market is effectively split on whether we see a cut or a delay:
A camp of institutions argues that rising unemployment and softer data could still justify a 25-basis-point cut in December, keeping pressure on the dollar and supporting gold on dips.
Others point out that the Fed is short of clean, up-to-date data and may prefer to wait until next year before committing to an easing cycle.
As a result, pricing for a December cut is roughly “fifty–fifty” and highly sensitive to the next run of labour-market and activity data.
In short: the macro backdrop is undecided, so intraday direction will be driven mainly by levels and liquidity until the next data catalyst hits.
Technical analysis
On the H2 chart, gold is in a broad consolidation after the recent sell-off:
Price is trading inside a descending structure, repeatedly respecting the short-term trendline from the recent high.
The Fibonacci retracement of the latest impulse shows the 0.382 level lining up with a prior fair-value gap and horizontal resistance – this forms a key rejection zone overhead.
Below price, there is a confluence of support where the rising trendline meets a small bullish FVG around 4027–4029, followed by a more important horizontal support band near 3998.
The volume profile highlights a Value Area High (VAH) around 4075–4080, which is likely to act as a reaction zone if price rotates back into it.
Until we break convincingly out of this structure, I treat it as a large accumulation range with a slight downside bias: sellers are still defending lower highs, but buyers are stepping in aggressively at trendline support.
Key levels
Resistance zones:
4080–4085 (VAH / short-term supply)
4135–4145 (Fibonacci 0.382 + FVG + structural resistance)
Support zones:
4027–4029 (trendline + FVG confluence buy area)
3995–4000 (important horizontal support)
3940 region (deeper support if the range finally breaks down)
Trade scenarios
1. Primary long – buy the trendline/FVG confluence
Entry: 4027–4029
Stop: 4023
Targets: 4035 – 4050 – 4068 – 4080
Idea: look for price to react at the rising trendline where it overlaps with the small FVG. A clean rejection candle or shift in intraday order flow from that zone sets up a rotation back towards the VAH and potentially the upper boundary of the range.
2. Break-and-retest short – if the trendline fails
Trigger: clear H1/H2 close below the rising trendline and the 4027 area
Plan: wait for price to retest the underside of the broken trendline / prior support
Entry: on rejection of that retest
Initial targets: 4000, then 3940 if momentum accelerates
This scenario treats any breakdown as a structural shift, using the retest as a lower-risk point to join the move rather than chasing the first leg.
3. Intraday scalp zones
These are discretionary, short-term opportunities for active traders:
Reaction sells: around 4085, and higher up if we spike into the 4135–4145 resistance band. Look for exhaustion or rejection patterns back into the range (potential targets 4060 then 4033).
Reaction buys: into 3998–4000 if we see a liquidity sweep below the current range, with tight stops and quick profit-taking back towards the mid-range.
XAU/USD Near Breakdown – Bears Eying Liquidity SweepGold remains under pressure after a stronger-than-expected NFP print reduced near-term Fed rate-cut expectations.
The USD stays moderately supported, while weak risk sentiment keeps gold in a cautious, defensive phase.
📊 Technical Snapshot (H1–M30)
Price continues to reject the descending trendline and the supply zone 4,054–4,078.
Lower highs structure intact → bearish momentum remains dominant.
Liquidity pockets sit at 4,013 and especially 3,989, a key downside magnet.
Any pullback toward 4,054 is likely just a retest before continuation lower.
🎯 MMF Intraday Plan
Primary Bias: SELL – follow the trend
Sell 4,054–4,078
SL: 4,090
TP: 4,013 → 3,989 → 3,975
Countertrend BUY (only at deep liquidity):
Buy 3,985–3,990
SL: 3,972
TP: 4,013 → 4,054
⚡️ MMF View
As long as price stays below the trendline and lower-high structure, gold remains in distribution.
A sweep of the 3,99x liquidity zone is highly likely before any meaningful reversal can form.

MARKET REMAINS RANGE-BOUND; WHAT ARE THE OPPORTUNITIES TODAY?1. Market Context
Gold continued to trade in a cautious manner yesterday as the market digested the hawkish FOMC minutes.
Despite safe-haven buying at the lower levels, the upper resistance zones remained firm, keeping the price within a well-defined range.
Buying interest remains strong around 4010–4000.
Sellers are consistently defending the 4130–4133 resistance region.
The 4080–4085 area acts as a key equilibrium zone — holding leads to sideways movement, while a breakout may trigger a directional move.
With no major data releases scheduled, gold is expected to continue its range-bound behaviour throughout the session.
2. BUY Zones
🎯 Primary BUY Levels:
4010
3998
🎯 Extended BUY Range:
4010 – 4015
4035 – 4040
→ These support regions have held firmly in recent sessions and are suitable for intraday pullback entries.
3. SELL Zones
🔥 Primary SELL Levels:
4130 – 4133
🔥 Extended SELL Range:
4148 – 4150
→ These areas align with strong overhead resistance and have shown reliable reaction points.
4. Key Level to Monitor (Trend Trigger)
📌 4080 – 4085 (Fibo 0.5 – 0.618)
A decisive break above 4085 may shift intraday sentiment towards bullishness → BUY setups become favourable.
If 4085 holds, the market is likely to sustain its range-bound movement → continue BUY at support and SELL at resistance.
5. Suggested Trading Approach
Trading style: SL 10 points – TP 10 points
Prefer BUY near strong support; SELL only at established resistance
Avoid entering trades in the mid-range (high noise, low conviction)
Execute trades only when the price tests pre-defined zones
If 4085 breaks with momentum → switch to a trend-following approach
⭐ Quick Summary
BUY: 3998 / 4010 / 4010–4015 / 4035–4040
SELL: 4130–4133 / 4148–4150
Key Zone: 4085 — breakthrough → BUY bias
Setup: SL 10 points – TP 10 points

GOLD – MARKET STILL RANGE-BOUND, WHERE ARE TODAY’S OPPORTUNITIES1. Market Context
Gold continued to move cautiously yesterday as the market digested the hawkish FOMC minutes.
Safe-haven demand is still present at lower levels, but the upper resistance zones remain strong, keeping gold trapped within a range.
Buyers are defending well around 4010–4000.
Sellers continue to block any attempt near 4130–4133.
The zone 4080–4085 remains the “balance point” — holding → sideways, breaking → trend shift.
With no major new data ahead, gold is likely to keep trading within its key zones for today’s session.
2. BUY Zones (Primary Focus)
🎯 Ideal BUY:
4010
3998
🎯 Extended BUY:
4010 – 4015
4035 – 4040
→ These are strong support areas used repeatedly in recent sessions, suitable for intraday rebounds.
3. SELL Zones
🔥 Ideal SELL (major resistance):
4130 – 4133
🔥 Extended SELL:
4148 – 4150
→ These resistance levels have shown consistent reactions, fitting short-term SELL setups.
4. Key Zone to Watch – Trend Trigger
📌 4080 – 4085 (Fibo 0.5 – 0.618)
Clear break above 4085 → prioritize BUY, as gold may shift into an intraday bullish move.
If 4085 holds → continue range trading, BUY at support – SELL at resistance.
5. Suggested Trading Strategy
Style: SL 10 points – TP 10 points
BUY at strong support – SELL at major resistance
Avoid mid-range entries (noisy, high stop-out risk)
Only enter when price touches the zone
If 4085 breaks strongly → follow the trend, avoid counter-trend SELLs
⭐ Quick Summary
BUY: 3998 / 4010 / 4010–4015 / 4035–4040
SELL: 4130–4133 / 4148–4150
Key zone: 4085 — break → BUY bias
Setup: SL 10 points – TP 10 points

XAU/USD: Gold's Final Correction Before a Strong Rebound📊 Market Structure – Elliott Wave + SMC
Gold has completed impulse wave 1–5 at the peak of 4,207 USD and is entering an Elliott correction phase in the form of ABC .
Wave A : bottomed at Demand Zone 4,008 – 4,020 USD
Wave B : retraced upwards, creating consecutive Equal Highs and small BoS but has not broken the larger structure
Wave C : is forming, may extend down to the Demand Zone if the price loses 4,030
SMC signals reinforce the scenario of a completed correction:
A series of Equal Lows → the market still has liquidity below to "sweep" towards the Demand Zone
The area BoS – 4,076 is the decisive structure: if not broken upwards, the correction trend continues
The area FVG + Resistance 4,152 USD is the target for a major retracement wave after completing wave C
=> In summary: the market is in the final phase of correction. Once wave C is completed, gold is likely to rebound strongly in the larger trend.
💎 Key Technical Zones
🔹 Demand Zone – Main BUY area
4,008 – 4,020 USD
→ Strong Demand confluence + Elliott wave C + liquidity below.
→ High probability of reversal.
🔹 Reaction Zone – Temporary reaction area
4,030 – 4,040 USD
→ If the price retraces early but hasn't swept the bottom → the correction may still continue.
🔹 Supply & FVG Zones (Strong resistance)
4,152 – 4,207 USD
→ Main target of the retracement wave after the ABC pattern is completed.
🎯 Trading Plan – Vincent’s Execution Map
1️⃣ BUY Setup – According to Wave C (top priority)
Wait for the price to complete wave C at the Demand Zone:
Entry: 4,012 – 4,020
SL: below 3,984
TP1: 4,076
TP2: 4,128
TP3: 4,152
TP4: 4,207
→ This is the main setup of the day, confluence of both SMC + Elliott.
2️⃣ BUY Aggressive – Early buy according to Break of Structure
If the price breaks BoS 4,076 before reaching Demand:
Entry: 4,070 – 4,076
SL: 4,040
TP: 4,128 – 4,152 – 4,207
→ Setup for those who want to catch the impulsive wave early.
3️⃣ SELL Scalp – Small trend (not the main trade)
Only enter when the price retraces to Fibo:
Entry: 4,092 – 4,106
SL: 4,116
TP: 4,040 → 4,020
→ Short-term scalp, aiming to complete wave C.
🧠 Vincent’s View
The overall trend still leans towards Bullish Reversal after correction.
As long as the price holds Demand Zone 4,008 – 4,020 , gold can rebound strongly back to the target of 4,152 – 4,207.
“Liquidity always shows the way – patience is the real advantage.” ⚜️
⏰ Timeframe: 1H
📅 Updated: 21/11/2025
✍️ Analyzed by: Captain Vincent

Bias Still Bearish, But Confirmation Below 4050 Is Needed1. What Happened Yesterday
Gold continued to trade inside the well-defined 4050–4100 range discussed in the previous analysis.
Aside from a few small spikes, price respected the boundaries perfectly, confirming this as the current “decision zone” for the market.
2. Current Market Context
My outlook remains bearish, but as mentioned yesterday, nothing meaningful happens until 4050 breaks cleanly.
This level is acting as the floor of the range, while 4100 caps every bullish attempt.
We are simply waiting for confirmation.
3. Technical Outlook
The levels are very straightforward:
- Below 4050 → bearish continuation
A decisive break opens the path toward 3900, which remains the primary downside target.
- Above 4100 → bullish extension
A clear breakout and stabilization above 4100 would give scope for a move toward 4200.
Until one of these levels goes, expect more range-bound trading.
4. Trading Plan
No changes from yesterday:
Bias stays bearish, but only with confirmation below 4050.
If price breaks above 4100, short-term upside to 4200 becomes the higher-probability scenario.
5. Conclusion
Gold is trapped in a tight range, and the next major move will be decided by a clean breakout from 4050 or 4100.
For now, patience is key.

Moving sideways and waiting for a breakout🔍 1. Descending Trendline (red line)
This is an important dynamic resistance.
Price has touched the descending trendline many times and been rejected → the overall trend still leans bearish.
Each retest of the trendline that fails to break gives a sell signal.
👉 Only when price closes above the descending trendline will the short-term trend have a chance to reverse.
🟦 2. Upper Resistance (light blue zone)
This is the area where the market previously made a strong reversal → strong supply zone.
If price breaks the trendline and moves toward this zone, it is a high-probability area where selling pressure may appear again.
🟩 3. Key Support (green zone)
Price has reacted many times at this support zone → strong support.
This is also where price can form a reversal pattern if buyers return.
👉 If price breaks below this support, the bearish trend will continue strongly toward the lower support zone.
🔄 4. Trading Scenarios
Scenario 1: Breakout of the descending trendline → Price moves up to resistance
Price may bounce from the current support area → move up to retest the descending trendline.
If the trendline is broken and retested successfully → target is the major resistance zone above.
For BUY:
Wait for a break & retest of the descending trendline.
BUY GOLD : 4000 - 3998
Stoploss : 3988
Take Profit : 100-300-500pips
SELL GOLD : 4130 - 4132
Stoploss : 4142
Take Profit : 100-300-500pips

XAUUSD GOLD ANALYSIS What’s Moving the Market Today? 21NovemberOANDA:XAUUSD GOLD ANALYSIS What’s Moving the Market Today? (November 21, 2025)
Welcome back to Trade with DECRYPTERS, where we turn complex charts into clean buy & sell zones.
Keep it simple let levels guide your decisions.
*📰 Market Overview*
Gold is consolidating after failing to extend above the intraday reaction zone, hovering near $4,070–4,080 as the Dollar Index holds firm around 99.0.
A steady dollar, fading rate-cut expectations and slow macro flows all limit immediate upside.
Volatility remains muted as markets wait for PMI data and fresh signals from the Fed.
Buyers continue defending dips, but sellers are active in the higher scalp zones.
*Key fundamentals driving today’s move:*
📈 DXY steady near 99.0 → caps bullish momentum
🏦 Fed pause confirmed; December cut odds drop to ~22%
🌍 Geopolitical risks + tariffs continue supporting safe-haven demand
🏛 Central bank demand strong: +634t YTD, up 28% YoY
📊 ETF flows: Q3 +222t inflows, but November shows light outflows as investors book profits
*📆 What’s Ahead Key Events to Watch*
🔸 PMI – Nov 21
Manufacturing expected ~49 & Services ~51.
Weak PMI = increased cut bets → gold bullish.
Strong PMI = DXY bounce → gold dips toward lower zones.
🔸 FOMC Meeting – Dec 16
Markets price a clear pause (78%) but a dovish surprise could unlock upside toward 4,150+.
Hawkish language may trigger a sweep into deeper demand (3,978–3,962).
🔸 Geopolitical Risk Premium
Tensions in US–China, Mideast and Eastern Europe continue to keep gold supported.
Any escalation = instant safe-haven spike; calmness = DXY strength → gold softens.
*🟩 GOLD TECHNICAL LEVELS*
Price continues to respect the mid-range structure with buyers defending the lower band and sellers reacting strongly at intraday supply.
After testing 4032–4049 demand, gold pushed back toward 4070–4080, confirming buyers still active.
*🎯 EQUILIBRIUM (EQ): 4,065.00*
Hold above EQ = bullish intraday momentum toward 4,094 → 4,105 → 4,123
Stay below EQ = re-test lower supports 4,050 → 4,032 with possible deeper sweep later
*🟩 📌 SCALP BUY AREA: 4,032 – 4,050*
Strong demand zone lining up with CB/ETF accumulation areas.
Ideal for intraday dip-buys during low volatility windows.
First reaction zone for bullish setups, especially inside the astrology short window.
If this breaks cleanly, expect a fast move toward 3,978–3,962.
*🟥 📌 SCALP SELL AREA: 4,094 – 4,105*
Repeated rejection zone — sellers remain active here.
Perfect for fading rallies with tight stops above 4,110.
If volume breaks above it, momentum quickly shifts to 4,123+.
This zone forms the short-term ceiling of current consolidation.
*🔺 📌 BULLISH BREAKOUT LEVEL: 4,123+*
A confirmed breakout above this level flips structure bullish.
Targets extend toward 4,148 → 4,165.
Usually triggered by macro catalysts (PMI/FOMC/geo shocks).
Watch for fakeouts if volume is weak.
*🔻 📌 SMART MONEY BUY ORDERS: 3,962 – 3,978*
Deep liquidity pocket where institutions are loading positions.
Expect sharp V-shaped reversals if this zone is tapped.
Only comes into play on deeper corrections or heavy data surprises.
Reclaim above 4,000 from here = strong upward momentum.
*📌 CONCLUSION*
Gold remains locked in a tight range, respecting both demand and supply zones as the EQ at 4,065 continues to act as the true pivot for direction. Holding below it opens the path for a controlled dip into deeper demand, while any strong break above EQ can trigger a clean push toward 4,123+. With macro data and geopolitical risk still guiding sentiment, patience and level-to-level execution remain the winning edge. Stay focused, let price come to your zones.
Please support me with your likes & comments to motivate deeper daily analysis!
Share your charts and thoughts let’s grow together.
Best Regards,
M. MOIZ KHATTAK | Founder, TRADE WITH DECRYPTERS

XAU/USD: Gold Adjusts, Awaiting Fibo 4,092 Confirmation📊 Market Structure
Gold is moving in the ABC–D–E adjustment pattern after a strong decline from the peak. Current structure:
Wave (C) peaks at the 4,128 – 4,130 USD region and strong selling pressure appears.
The price then creates a temporary bottom (D) but does not touch the Demand Zone at 4,007 USD, indicating the BUY side still has strength.
Currently, the price is in a small upward adjustment phase to form wave (E).
Key points:
The major trend still leans towards an increase as long as the bottom at 4,007 USD is not broken.
The BUY side is looking for a complete structure to continue pushing up to the FVG region.
💎 Key Technical Zones
1. Fibo Retracement Zone — 4,092 USD
Confluence region of:
Fibo 0.5 – 0.618
Adjustment structure (small wave)
→ Suitable for light SELL scalp, according to candle reaction signals.
2. FVG Zone — 4,128 – 4,151 USD
This is a large FVG region, coinciding with the market's "loss cost."
If the price pushes up as expected in wave (E), this is the main SELL region of the day.
3. Supply Zone — 4,207 – 4,210 USD
Extremely strong region, if the price breaks the FVG, it will move to this region.
This is the extended target for the BUY side if the market rises strongly.
4. Demand Zone — 4,007 – 4,020 USD
The strongest liquidity bottom region of the session.
If the price breaks 4,092 and does not maintain structure, gold will retest this region before a major increase.
🎯 Trading Plan – According to the current chart
1️⃣ SELL Scalp – Main scenario
Wait for the price to retrace to the Fibo 4,092 USD region and observe the reaction:
Entry: 4,092
SL: 4,105
TP1: 4,075
TP2: 4,060
TP3: 4,030 (lower FVG)
→ This is a short-term scalp order, suitable for the current weak market.
2️⃣ SELL Setup – FVG Zone
If the price breaks 4,092 and runs up to FVG:
Entry: 4,126 – 4,151
SL: 4,160
TP1: 4,092
TP2: 4,060
TP3: 4,030
→ This is the best SELL region of the day.
3️⃣ BUY Setup – Demand Zone
Only activate if the market drops deeply:
Entry: 4,020 – 4,007
SL: 3,995
TP1: 4,060
TP2: 4,092
TP3: 4,128 – 4,151
→ Buy according to the major trend when the price reaches the liquidity bottom region.
🧠 Vincent’s View
The current market is in a controlled adjustment phase.
Priority:
✔ SELL scalp at 4,092
✔ Beautiful SELL at 4,126–4,151
✔ BUY only activates when reaching 4,020–4,007
The major trend is still waiting to complete the wave pattern to push up to the Supply Zone 4,207 USD.

Markets Shocked by NFP; Gold Outlook Stays BullishThe long-delayed NFP report has finally been released—and the numbers shocked the market. Nonfarm payrolls increased by 119K, more than double the forecast of 50K, while August’s figure was sharply revised down to -40K. This surprisingly strong report effectively shattered the narrative that the U.S. economy is heading toward a “hard landing.”
At the same time, however, the unemployment rate rose from 4.3% to 4.4%, hitting a four-year high. This combination of strong job growth and rising unemployment paints a contradictory picture—providing ammunition for both hawks and doves.
More importantly, due to the government shutdown, the October jobs report has been completely canceled. Data for October and November will be merged and released in December—one week after the next FOMC meeting. This means the Fed will base its upcoming policy decision mainly on this outdated September report.
Meanwhile, news surfaced that the U.S. has submitted a “peace plan draft” to Ukraine. Against the backdrop of ongoing battlefield escalation, this sudden hint of possible ceasefire has reignited global risk aversion.
In the short term, the September NFP report weakens expectations for a December rate cut, pushing the dollar higher and putting pressure on gold.
In the medium term, however, the absence of October data, rising unemployment concerns, risks of escalation in the Russia–Ukraine conflict, and expectations of a global rate-cut cycle beginning around 2026 all provide solid support for gold bulls.
As a result, gold is likely to continue its broader upward trend after a period of consolidation.
On the 2-hour chart, gold is currently capped by the MA60. If it breaks above and stabilizes, the price may retest the 4150–4200 region.
If it fails to break through, a pullback toward 4050–4000 is likely.
On the daily chart, MA60 around 3918 remains a strong structural support.
Considering both fundamentals and technicals, the primary approach remains buying on dips.
Those who prefer high-frequency trading can also sell at key resistance levels.
Maintain proper risk management, stay patient, and let the market reveal the next major opportunity.

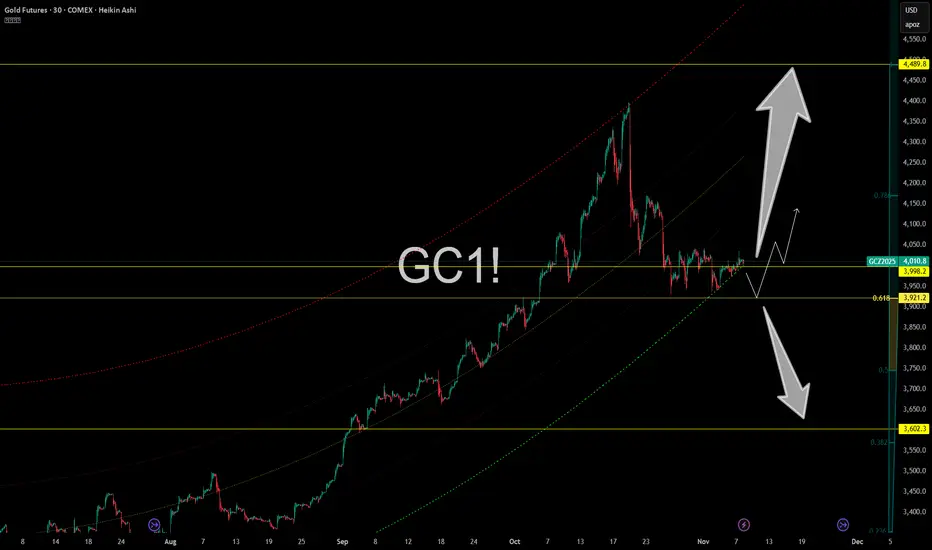
Gold Futures – Compression Before Explosion?Gold (GC1!) is coiling tightly just above the $3,998 level, teasing a big move as it hugs the 0.618 fib zone at $3,921. It’s the definition of compression — and when gold coils like this, something always gives.
📍 Key levels on the radar:
$3,998 – Current pressure zone
$3,921 – Fib support + breakout base
$3,602 – Worst-case flush if demand fails
$4,489 – Fibonacci extension target if this rips
We’ve got an ascending pitchfork, clean market structure, and a massive range breakout setup. These kinds of patterns don’t sit idle for long.
Gold remains a beast in uncertain macro conditions — don’t underestimate what happens when fear, rates, and inflation mix.
Trading Wisdom 📜
The bigger the coil, the nastier the move. Don’t focus on direction — focus on readiness. Gold pays those who stay patient and deadly.
Disclaimer: What you read here is not financial advice — it’s high-level market philosophy from the FXPROFESSOR himself. Risk is real, and your capital is your responsibility. Learn, adapt, evolve.
One Love,
The FXPROFESSOR 💙
Gold Trade Secured 350 Pipsprice manipulated higher sweeping BSL to then engulf and BOS to the downside to target SSL

Gold Trade Set Up Nov 20 2025overall im still bearish on gold. I will want to see price respect the fib levels and sweep BSL followed by internal 5m-15m bearish engulfing and CSID to target SSL and lower fib levels

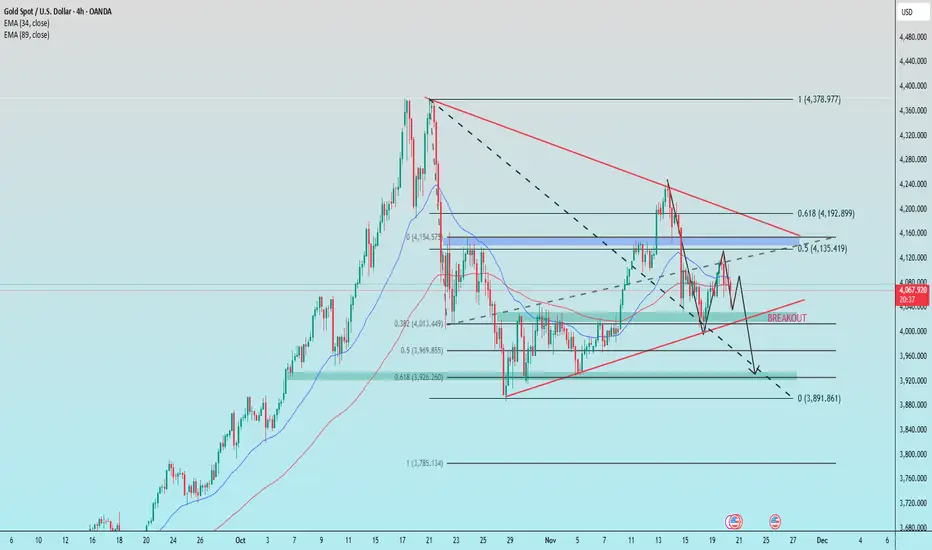
NONFARM returns after many days of closure1. Trendline
Descending trendline (upper): Strong dynamic resistance, price is repeatedly rejected → main trend remains bearish.
Ascending trendline (lower): Dynamic support, but has just been broken downward → buying pressure is weakening.
2. Key Support Levels
3,926 – 3,969 (Fibo 0.5–0.618): Strong confluence zone, the main target if the ascending trendline breaks.
3,891 (Fibo extension 1.0): Deep support, potential area for a short-term bottom.
3. Key Resistance Levels
4,135 – 4,155 (Fibo 0.5 + supply): Strongest resistance, price faced strong rejection here.
4,192 – 4,200 (Fibo 0.618): Higher resistance, aligned with the descending trendline → strong selling confluence.
Trade Ideas
BUY GOLD : 3948 – 3950
Stoploss: 3938
Take Profit: 100–300–500 pips
SELL GOLD : 4148 – 4150
Stoploss: 4160
Take Profit: 100–300–500 pips
Gold’s Pullback Bias PersistsGold is showing a trend of oscillating decline at low levels today. From the 4-hour chart perspective, gold is expected to trade in a range during the Asian and European sessions. Multiple layers of resistance lie at 4,125 and 4,187 above, making a short-term breakout quite challenging.
Below, focus on the short-term support around 4,040 - 4,045. Technically, the bias remains towards a correction and pullback, with the key psychological level of 4,000 coming under repeated pressure.
Specifically, we will patiently await the non-farm payrolls data tonight and adjust our strategy based on the actual figures. However, we also need to anticipate the possibility of a pre-data breakdown driven by market expectations before the release.
Refrain from trading aggressively around the middle range—avoid chasing orders and wait patiently for key levels to enter positions.
Buy 4040 - 4045
SL 4030
TP 4090 - 4100 - 4110
Sell 4100 - 4110
SL 4120
TP 4050 - 4040 - 4030

XAUUSD — Deep Narrative Breakdown Through Liquidity & Imbalance🔶 Welcome to “Imbalanced” — A Market Logic Space
This page is focused on clean charting, liquidity behavior and imbalance-based price delivery.
I share structured narratives, premium/discount zones, and disciplined execution models for XAUUSD.
No signals.
No promotions.
Just pure market logic.
If you value clarity over noise, you’ll feel at home here.
The current structure on Gold continues to respect algorithmic delivery, with price moving between well-defined inefficiencies and liquidity pockets.
After the previous displacement, price began building a distribution inside premium, leaving a clear trail of imbalances above and sell-side liquidity resting below.
The chart highlights multiple areas of interest:
• Imbalance & BISI above:
Price has yet to revisit these inefficiencies, suggesting unmitigated zones remain inside premium. These areas represent where the algorithm last delivered impulsively and where future reactions may form once liquidity conditions shift.
• Equal lows (EQL) & Sell-side liquidity:
Beneath the current range sits a cluster of equal lows—textbook liquidity. These resting lows often act as a magnet for engineered pushes, creating clean narrative continuation toward discount levels.
• SIBI in discount:
The lower imbalance zone aligns with a logical draw, given the repetitive taps at the mid-range and the market’s tendency to rebalance inefficiencies left behind during fast moves. This SIBI remains a major reference point for understanding how the next leg might unfold.
Overall, the chart is not about predicting but about reading the story the market is writing:
liquidity creation, imbalance expansion, and the delivery toward areas where inefficiency and resting liquidity coexist.
This is a narrative-driven read, focusing solely on structure, flow, and algorithmic footprints—nothing more, nothing less.
The market leaves the clues; our job is to decode them.
— Imbalanced | Precision in Price Delivery

GOLD ANALYSIS What’s Moving the Market Today? November 20, 2025OANDA:XAUUSD GOLD ANALYSIS What’s Moving the Market Today? (November 20, 2025)
Welcome back to Trade with DECRYPTERS, where we turn complex charts into clean, practical buy & sell zones that anyone can understand.
Our goal is simple: react to levels, not emotions.
Follow the zones, follow the structure the market will guide you.
*📰 Market Overview*
Gold slipped after failing to hold above $4,100, drifting back into the mid-range as the Dollar Index (DXY) pushes toward 100.15.
December rate-cut expectations have cooled to around 50%, reducing bullish momentum for metals.
Markets remain fragile with data uncertainty, Fed division, and global tensions all contributing to volatility.
*Key Drivers Behind Today’s Move:*
📈 DXY Strength → A stronger dollar limits upside for gold.
🏦 Fed Minutes Split → Policymakers prefer a “wait & watch” stance, keeping gold range-bound.
📉 Shutdown Data Gaps → Missing CPI/NFP prints create unpredictable volatility bursts.
🌍 Geopolitical Tensions → US–China, Mideast and Ukraine-Russia keep safe-haven flows alive.
🏛 Central Bank Demand → Q3 +220 tonnes; Poland & Kazakhstan leading accumulation.
📊 ETF Flow Behavior → After a record +222t Q3 build, November shows slight outflows but AUM stays near all-time highs — meaning investors are still holding heavy gold exposure.
*📆 What’s Ahead — Key Events to Watch*
🔸 FOMC Meeting – Dec 9–10
Rate cuts remain a coin toss. A surprise hawkish stance could pressure gold quickly, while a dovish tone fuels moves toward upper ranges.
🔸 CPI / NFP Drop After Shutdown Delay
With imputed CPI around ~3.0% core expected, any surprise deviation triggers instant volatility.
Clustered data releases = strong intraday whipsaws.
🔸 Geopolitical Risk Premium
Escalations boost gold instantly.
Calm periods = USD strength and pressure on metal prices.
*🟩 GOLD TECHNICAL LEVELS*
Gold pulled back toward $4,050, but buyers are still active above the $4,000 handle.
The chart currently shows a controlled range with liquidity on both sides — a perfect environment for level-based trading.
*🟩 📌 BUY AREA: 4,005 – 4,028*
Strong accumulation zone where previous demand stepped in.
If price taps into this region, expect sharp rejections and bullish reaction candles.
This zone remains valid as long as gold does not break below $4,000.
Best area for swing & intraday long setups.
*🟥 📌 SELL AREA: 4,107 – 4,121*
This is your first reaction zone previous rejections, wick prints, and liquidity sweeps occurred here.
Expect immediate resistance on first touch.
Ideal short-term scalp sell region unless a clean breakout occurs.
Break above → opens room toward 4,150.
*📝 CONCLUSION*
Gold is playing a tight game between demand at 4,005–4,028 and selling pressure at 4,107–4,121, with EQ hovering near the mid-range.
Holding below EQ favors a deeper pullback into the buy zone, while a clean reclaim above EQ shifts momentum toward 4,148–4,165.
Until CPI/FOMC hits, gold remains range-bound with controlled volatility.
If gold close above 4100 we can see it to 4180
Stay patient.
Follow the levels.
Let the market hit your zones not your emotions.
🙌 Your Support Matters
Please support this analysis with your likes & comments it helps motivate me to share more detailed insights with you.
Feel free to drop your charts & views in the comments. I always reply!
Best Regards,
M. MOIZ KHATTAK | Founder – TRADE WITH DECRYPTERS

GOLD HIT TAKE PROFIT Gold has hit take profit and now we wait to target another trade to the upside will post more about the trades that will be taken on gold XAUUSD

XAUUSD SHORT SETUP ( 20 NOV 2025 )If you have doubt on our trades you can test in demo.
OANDA:XAUUSD SHORT SETUP
📊 EP: 4059.400
💵 TP: 4033.252
❌ SL: 4072.330
Trade Ideas:
Idea is clearly shown on chart + we have some secret psychologies and tools behind this.
Trade Signal:
I provide trade signals here so follow my account and you can check my previous analysis. So don't miss trade opportunity so follow must.

XAU/USD: Gold in Downtrend, Waiting for Demand Surge⏰ Timeframe: 30m
📅 Update: 11/20/2025
🔍 Market Context
After the technical rebound at the beginning of the week, gold returns to adjust within the descending channel pattern, indicating that short-term upward momentum is temporarily weakening.
The current structure reflects a rebalancing state after the price was rejected at the 4,127 USD supply zone – coinciding with the 30-minute frame Supply Zone.
However, the Demand Zone below still plays an important role in maintaining the medium-term upward structure.
📊 Technical Structure
Supply Zone (4,127 USD): main resistance area, confluence with the nearest peak – where the price was strongly rejected during the Asian session.
OB Bearish (4,106 USD): short-term supply area, highly likely to be retested after completing the adjustment phase.
Demand Zone (4,013 USD): main support area in the descending channel, also the confluence point between the channel boundary and the lower liquidity zone.
Liquidity Sweep: signal indicating that lower liquidity has been absorbed, opening up the possibility of forming a higher low.
🎯 Market Outlook
High probability scenario:
1️⃣ Price continues to fluctuate within the descending channel, retesting the 4,013 USD Demand Zone.
2️⃣ If a clear price reaction occurs, the market is likely to break the channel, opening up a technical rebound to OB Bearish 4,106 USD or Supply Zone 4,127 USD.
3️⃣ Losing the 4,013 USD area will temporarily invalidate the rebound structure, bringing the price back to a lower balance area around 3,990 USD.
🧠 Analyst’s View
Gold is in a corrective pullback phase – where the market needs to regenerate liquidity before forming a new expansion wave.
A reasonable scenario is sweep – retest – expansion: sweep lower liquidity, retest the supply area, then determine the main trend for the end of the week.
Buyers still have a slight advantage as long as the Demand Zone is maintained.
🛡️ Risk Note
This is a phase of market liquidity accumulation, fluctuations may be erratic.

XAU/USD – Inverse H&S Forming, Gold Eyes Bullish Reversal🔍 Market Context
Early today, Gold dropped nearly 70 points, but immediately rebounded strongly from 4040, signaling aggressive BUY interest and a clear rejection of downside continuation.
On the H2 chart, XAU/USD is shaping a clean Inverse Head & Shoulders pattern — a classic reversal structure that often precedes a strong bullish expansion.
The macro layer for today is packed with high-impact catalysts:
📌 Key Data & Events – 20 Nov
Speech by U.S. President Donald Trump
Barkin (2027 FOMC voter) speaks on economic outlook
Federal Reserve FOMC Meeting Minutes
Williams (permanent FOMC voter) speech
U.S. Unemployment Rate
Non-Farm Payrolls (NFP)
Initial Jobless Claims
➡️ A heavy news lineup capable of triggering high volatility and validating (or rejecting) the reversal pattern.
📊 Technical Analysis – MMF View
Gold bounced sharply from BUY ZONE 4044–4046 with strong volume.
The market structure is creating a complete Inverse H&S formation.
The Neckline Zone 4101–4111 is the key breakout level — clearing this zone opens the door for a full bullish reversal.
Trendline compression + liquidity sweeps show buyers gaining control.
Strategy for today: BUY bias. SELL only for quick scalps.
🎯 MMF Daily Trading Plan
BUY (Priority Setup – Swing / Intraday)
Buy 4046–4048
SL: 4039
TP: 4060 → 4085 → 4100 → 4125
✔️ BUY aligns with the reversal pattern + fresh liquidity shift.
SELL (Scalping Only)
Sell 4146–4148
SL: 4154
TP: 4132 → 4120 → 4110
✔️ SELL only if price taps liquidity at upper supply and rejects clearly.
⚠️ Key Levels to Watch
4101 – 4111 – 4142 → liquidity clusters + breakout confirmation
4029 → major support in case volatility spikes from news
🧠 MMFLOW TRADING Outlook
If Gold holds its corrective pullback and breaks above the Neckline (4101–4111), we may see a strong continuation toward:
4146 → 4187 → 4210+
The Inverse H&S on H2 is a powerful bullish setup — smart positioning favors building long exposure and holding into high-impact events.
