Selena | XAUUSD 2H — Bullish Continuation SetupFOREXCOM:XAUUSD
Market Overview
Price has built liquidity through multiple sweeps and consolidations, suggesting a possible continuation phase. If price retests the demand zone and holds, buyers may step in to push toward upper structure resistance levels.
Key Scenarios
✅ Bullish Case 🚀
If price holds above 4,157 zone
→ 🎯 Target 1: 4,300
→ 🎯 Target 2: 4,375–4,400 (major resistance / channel top)
❌ Bearish Case 📉
Break and close below 4,052 invalidation zone
→ 🎯 Downside Target: 4,000–3,950 support range
Current Levels to Watch
Resistance 🔴: 4,300 | 4,375–4,400
Support 🟢: 4,157 | 4,122 (demand zone)
Invalidation ⚠️: 4,052
⚠️ Disclaimer: This analysis is for educational purposes only — not financial advice.
Xauusdupdates

Gold Trade Set Up Dec 5 2025Gold has broken above PDH and tapped into a strong supply area with SSL, Low range liquidity and PDL below. So i will be looking for 5m-15m bearish engulfing and CISD to make a correction lower to sweep SSL

XAUUSD - Time to buy gold now...XAUUSD (GOLD) was recently in a short term downtrend for a few weeks but has now shown some clear bullish movements ahead. XAUUSD (Gold) has broken out of a downward trend channel that was acting as strong resistance, The price is very likely to head to the next strong resistance level which is marked as the take profit zone (green line). Time to buy GOLD now!

XAUUSD: Inverse H&S Points Toward 4270 TargetHi!
Gold has formed a clear Inverse Head & Shoulders structure, signaling a potential bullish reversal. The support zone around the head held strongly, forming the left shoulder, head, and right shoulder in sequence. Price has now broken above the neckline, confirming the pattern and showing renewed bullish momentum.
If price retests the neckline successfully, it can provide a higher-probability long entry. A sustained hold above this level keeps the bullish structure intact, with the measured target projected near 4265–4270 USD.
However, if price dips deeper, the right scenario remains a potential bullish retest, as long as the structure stays above the neckline zone. Only a drop back below the head invalidates the pattern.
Overall, as long as buyers defend the neckline, the market maintains a bullish outlook toward the target zone.
Disclaimer: As part of ThinkMarkets’ Influencer Program, I am sponsored to share and publish their charts in my analysis.

Gold price analysis May 12Gold continues to maintain an impressive upward momentum in today's session, showing that the bulls are still in control of the market and the immediate target is heading straight towards the 429x resistance zone in the US session. At the moment, BUY setups continue to be the main strategy, as long as the bullish structure is not broken.
Trading plan:
BUY Now: 4220
Buy Trigger: When a price rejection signal appears at the support zones 4170 - 4195 - 4115
Target: 4290
Risk: The trend will weaken if the H4 candle closes below the trendline at 4170. If this happens, it is necessary to pay special attention to the next large trendline zone around 4115.
The trend is still favorable for the buyers, so prioritize BUY entry points until the bullish structure is clearly broken.

GOLD ANALYSIS What’s Moving the Market Today?(December 05, 2025)OANDA:XAUUSD GOLD ANALYSIS What’s Moving the Market Today?(December 05, 2025)
Welcome back to Trade with DECRYPTERS, where we decode smart-money footprints into clean, actionable buy & sell zones.
Keep it simple. Trust the levels. Follow the plan.
📰 Market Overview
Gold continues its upward rotation after reacting perfectly from Smart Money Buy Orders earlier this week. Price is now pushing toward major liquidity pockets and approaching premium sell zones, keeping bulls firmly in command despite mild USD stabilization.
The U.S. Dollar Index remains soft following post-election volatility, hovering near structural lows. Combined with elevated geopolitical tensions and aggressive central-bank accumulation, gold continues to operate inside a macro-bullish environment.
With key U.S. data releases (ADP, ISM Services, PCE) and the December 9–10 FOMC meeting ahead, markets remain cautious but structurally bullish. Gold is respecting the premium discount rotation cleanly, offering multiple low-risk, high-probability setups for disciplined traders.
🔍 Key Fundamentals Driving Today’s Move
📈 88% probability of a December rate cut → lower yield competition boosts gold
💵 USD stabilizing but not strengthening → downside limited
🌍 Geopolitical tensions elevated → strong safe-haven premium
🏦 Central banks remain net buyers (634t YTD) → consistent long-term accumulation
📊 Core PCE at 2.9% → keeps Fed leaning dovish
Gold’s strength remains driven by a powerful combination of macro uncertainty + structural demand + smart-money order flow.
📰 Insights from Key Sources
Spot gold rose 1% to $4,199.19/oz on Nov 28, signaling renewed buying interest and aggressive dip-accumulation.
Bank of America projects gold could reach $5,000/oz by 2026, backed by tight supply, low inventories, and persistent monetary support.
Deutsche Bank raised its 2026 average gold forecast to $4,450/oz (up from $4,000), citing ETF inflows and sustained central-bank demand.
Australian miners are ramping up exploration to capitalize on the rally.
South Africa has opened its first underground gold mine in 15 years (Qala Shallows), aiming to stockpile ore amid record prices.
Structural supply constraints remain a bullish driver, supporting higher long-term price projections.
These insights reinforce the institutional bias: long-term accumulation remains strong, and the upside narrative is supported by both fundamentals and supply-demand dynamics.
📆 KEY EVENTS TO WATCH
🔸 Core PCE Data — Recently Released
A major Federal Reserve–driven volatility catalyst.
Latest Core PCE: 2.9% YoY
Latest Monthly Change: 0.2% MoM
If Core PCE comes in softer than expectations:
✔️ Strengthens the December rate-cut narrative
✔️ Supports a continuation toward premium sell zones (4245 → 4264 → 4284)
✔️ Confirms easing inflation pressure and boosts non-yielding assets like gold
If Core PCE comes in hotter than forecast:
✔️ Sparks temporary USD strength
✔️ Expect a liquidity sweep into discount zones (4203 → 4189 → 4167)
✔️ Real direction usually follows after the stop-hunt, not the initial candle
🔸 Geopolitical Landscape
Geopolitical tensions continue to amplify intraday volatility:
🌍 Escalation → safe-haven spike into premium zones
🌤️ Calm → controlled pullbacks into buy zones
Trend remains bullish, but momentum varies depending on global risk sentiment.
Geopolitics generally strengthens the prevailing smart-money trend rather than reversing it.
🟩 GOLD TECHNICAL LEVELS
Gold continues to respect its rising structure, reacting cleanly from discount zones and rotating toward institutional premium blocks. Price currently sits just below major sell-side liquidity.
🟩 📌 SMART MONEY BUY ORDERS: 4147 – 4167
Primary institutional demand zone with ~$22 million in resting buy-side liquidity.
Expect:
✔️ Strong reaction on first tap
✔️ Accumulation & mitigation
✔️ Higher-low formations inside bullish channel
Break below 4147 opens liquidity toward 4108 → 4075.
🟩 📌 SCALP BUY AREA: 4203 – 4189
Short-term discount zone for:
✔️ Intraday long scalps
✔️ Retracement continuation setups
✔️ Mid-range liquidity grabs
A break of 4189 brings price back into the deeper Smart Money Buy Zone.
🟧 📌 SCALP SELL AREA: 4245 – 4254
Short-term distribution zone ideal for:
✔️ Quick reaction shorts
✔️ Intraday pullbacks
✔️ Stop runs before testing the major premium zone
Rejection sends price back toward 4200–4210 liquidity.
🔺 📌 SMART MONEY SELL AREA: 4264 – 4284
High-probability institutional distribution zone with $33 million in sell-side orders.
Expect:
✔️ Manipulation wicks into premium
✔️ Liquidity grabs above local highs
✔️ Swing reversal setups near range extreme
A decisive break & hold above 4284 opens continuation toward 4310 → 4325.
📌 Conclusion
gold remains firmly bullish as long as the 4147–4167 Smart Money Buy Zone is protected, with price continuing its clean rotation between institutional discount and premium levels. With unemployment data set to inject volatility, expect engineered liquidity sweeps before the true direction unfolds. The broader narrative of dovish policy, geopolitical risk, and heavy central-bank accumulation keeps the upside intact. Stay patient, trust the zones, and let smart-money footprints guide every decision.
🙌 Support the Analysis
If this breakdown brought value to your trading:
👍 Drop a like
💬 Comment your levels
📈 Share your charts with the community
Let’s grow together.
Best Regards,
M. MOIZ KHATTAK | Founder — TRADE WITH DECRYPTERS

XAUUSD – Watching Key Support Level for Possible Continuation MoGold on the 15-minute chart is approaching an important structure zone.
The upper marked area shows where strong sellers previously reacted, creating a sharp reversal.
Price is now moving toward the lower boundary, which is the key level to watch.
If this level gives way, the chart projection illustrates a deeper continuation path.
This analysis is shared only for chart study and educational purposes.
✅ Analysis (Based on Your Markup)
Price faced clear rejection from the upper area around 4,241.59, showing strong selling interest in that zone.
After the rejection, a series of lower highs and lower lows has formed, suggesting weakening bullish momentum.
The support around 4,164.85 is the major structure level on your chart.
The blue arrow projection indicates a possible scenario where price retests the area above and then continues lower if the support level fails.
The idea highlights how the market could move into a deeper downside expansion once structure breaks.
Overall, the chart represents a bearish continuation concept that depends on price breaking the lower boundary.

Gold Uptrend: Retest 4,211 to Surge to 4,236 → 4,254After the Asian session, gold continues to maintain a short-term upward structure as prices consistently create higher lows (HL) and remain trading above the rising trendline. The weakening USD due to expectations of a dovish Fed is also supporting the flow of funds back into precious metals.
Currently, the market is entering a "compression" zone below resistance, signaling signs of accumulation before a new expansion phase.
📊 Technical Outlook – MMF Flow (H1)
1️⃣ Key Supports
4,211 – 4,212 → important retest zone + trendline confluence + previous HL low.
4,187 – 4,188 → deeper support, strong previous buying zone.
When prices hold above 4,211 → short-term trend remains bullish.
2️⃣ Key Resistances / Liquidity Zones
4,236 → nearby supply zone, liquidity cluster.
4,254 – 4,255 → expansion target, large liquidity zone above.
Prices are reacting at the descending trendline, but the upward momentum remains in control.
🧭 Trading Scenario according to MMF
▶️ Main Scenario – BUY with the trend
Wait for price retest:
🔹 BUY zone: 4,211 – 4,213
🔹 SL: below 4,206
🔹 TP1: 4,236
🔹 TP2: 4,254
Logic: Price breaks the intraday down structure, creates higher HL, and is gradually approaching the descending trendline → high breakout potential.
▶️ Alternative Scenario – Deeper BUY
If the market "flushes" to take liquidity:
🔹 BUY at 4,187 – 4,189
TP similar to the main scenario.
🎯 Daily Bias Summary
Bias: Bullish when prices hold above 4,211.
Priority: BUY at retest → SELL only for short-term scalping.
Target: 4,236 → 4,254 is a liquidity zone that the market can easily be pulled up to sweep.

XAUUSD: Continue to buy low and sell high within the rangeYesterday’s strategy was to sell near $4,230 and buy near $4,160, and as it turned out, gold touched the $4,230 region after the ADP release, then continued to fall sharply to below $4,180.
If you executed positions according to yesterday’s strategy, you should have secured substantial profits—congratulations.
The ADP report showed a 32,000 decline in private payrolls, signaling further deterioration in the U.S. labor market and raising concerns that conditions may be worse than previously expected.
Yesterday’s ADP release was the final labor data before the December FOMC meeting. While the weaker-than-expected figures boosted expectations for a Fed rate cut—which should have been bullish for gold—prices instead declined.
Why? Because the impact of the rate-cut expectation had already been priced in ahead of time.
In my view, a 25 bps rate cut is essentially locked in, and barring any major surprises, gold is unlikely to break new highs in the short term. At the same time, with rate cuts on the horizon, the probability of a large downside move is also limited.
This suggests gold is likely to remain in a range-bound environment.
The upper boundary of the range remains at $4,230, while support holds in the $4,150–$4,160 zone.
In the short term, selling at the top of the range and buying at the bottom remains the primary trading approach. If conditions change, I will update the strategy accordingly.
If you have a different view, feel free to leave a comment—good luck to everyone in the market.

XAU/USD: Pullback to OB & Fibo, then upward trend!1. Market Context
In the M30 timeframe, the price is in a correction phase after forming a strong bottom area around 4,192–4,195. From there, the market has generated a series of positive signals: the price line gradually moves higher, with consecutive CHoCH appearances, indicating weakening selling pressure and a shift in cash flow towards accumulation.
The resistance area of 4,230–4,240 remains a significant barrier. If it is broken with a clear closing candle, the upward structure will be confirmed, and the price may expand to higher areas.
2. Key Price Areas (SMC Mapping)
Upper Resistance
4,230–4,240: strong reaction area, acting as the first barrier.
4,255–4,256: the next expansion area when the upward trend is confirmed.
4,289–4,290: the final target in the expansion structure of the upward wave.
Support Area – Buying Point
4,200–4,216: OB combined with Fibo area, where the price may adjust to regenerate liquidity before rising.
4,192–4,195: strong low area, where the market has reacted strongly before.
3. Fibo & Price Action
In the current upward move, the price has approached the 0.786 Fibo and encountered resistance at 4,230–4,240. A correction to the 0.382–0.5 area (corresponding to OB 4,200–4,216) would be reasonable before the market continues to retest higher areas.
Notable price action signals:
The consecutive appearance of bullish CHoCH indicates that buying pressure is in control.
The 4,192 low is still protected and acts as an important low of the recovery phase.
If the price retests the OB cleanly, this is a good trigger point for a new upward move.
4. Trading Plan
Preferred Scenario: Buy according to structure
Buy Waiting Area: 4,200–4,216 (OB + Fibo)
Stop Loss: below 4,192
Targets:
4,230–4,240
4,255
4,289–4,290
Confirmation Conditions
The price needs to clearly break the resistance area of 4,230–4,240 to trigger upward momentum.
The retest of the OB must occur with reduced liquidity and a confirming candle pattern.
5. Summary
The market structure shows a short-term upward trend is forming. The price is likely to adjust to the 4,200–4,216 area before continuing upwards to 4,240 and further to 4,255–4,290.
The appropriate strategy is to wait to buy in the OB & Fibo area under the condition of clear confirmation signals.

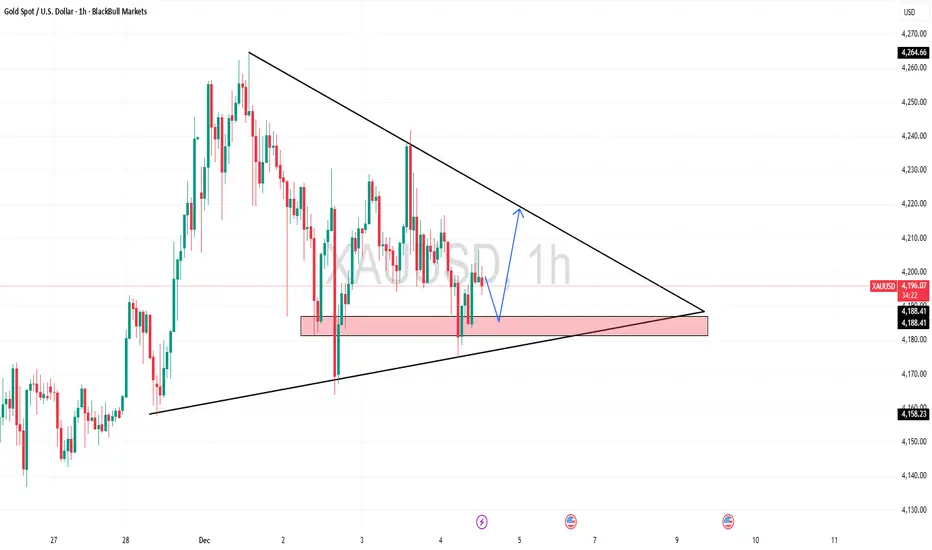
XAU/USD: Gold Consolidates, Awaiting Pullback for Breakout📊 Market Structure (H1)
Gold is moving within a converging triangle pattern – with the bottom being pushed higher by buying pressure, while the top is continuously blocked by the H1 descending trendline.
After the previous strong decline, the market has consecutively created bullish ChoCH , indicating that capital flow is starting to return, but the pivotal supply remains at the OB Bearish 4.23x area – where the price is currently stuck.
Currently, the price is testing the upper edge of the triangle + supply area, which is primarily used for distribution and liquidity sweep. → Not an optimal area for FOMO BUY.
💎 Key Levels – Important Areas
• OB Bearish – 4.23x: confluence with descending trendline → high probability area for strong reaction or Liquidity Sweep.
• FVG – 4.21x: H1 price gap, the market tends to return to fill before continuing.
• OB Bullish – Buy Zone – 4.201: H1 demand + lower edge of current range → priority area to observe BUY according to trend.
• Liquidity Buy – 4.170: lower liquidity area → price may sweep deep before bouncing strongly if the medium-term uptrend remains effective.
• Upper Target – 4.25x: expanded target if gold successfully breaks the converging triangle.
🎯 Trading Plan – Trading Scenarios
1️⃣ Priority Scenario: Pullback to OB Bullish
If the OB Bearish 4.23x area reacts (wick rejection, reversal pattern, weakening momentum), expect the price to retreat to:
→ FVG 4.21x
→ OB Bullish 4.201
At the 4.20x area, if a bullish ChoCH / engulfing / strong pin bar appears, this will be a reasonable BUY area according to the trend.
Suggested TP:
• TP1: FVG 4.21x
• TP2: Retest OB Bearish 4.23x
• TP3 expanded: 4.25x area if price breaks the triangle
Invalidation: H1 closes below 4.195 → stay out and wait for reaction at Liquidity 4.170.
2️⃣ Alternative Scenario: Deep Sweep to Liquidity Buy
If OB Bullish 4.20x does not hold and the price breaks down strongly, do not catch the falling knife.
→ Wait for gold to reach Liquidity Buy 4.170
→ Observe reaction: long wick, selling pressure depletes, new HL formation…
Only BUY again when the signal is clear.
If the 4.170 area is broken strongly by an H1 candle → temporary uptrend structure loses effectiveness, reduce volume or stay out until the market stabilizes.
⚠️ Risk Management
This is a trading plan based on an idea – not an immediate entry signal.
Do not BUY directly at the 4.23x resistance area.
Be patient for a pullback to the discount area (4.20x – 4.17x) and always set clear risk.
“Liquidity tells the truth — structure confirms the path.” ⚜️
⏰ Timeframe: H1
✍️ Analysis by: Captain Vincent

HOT GOLD: PCE ENDS THE PARADOX!📰 Fundamental Analysis (FA): Opposing Forces
US Labor EXTREMELY STRONG (Lowest unemployment in 3 years, job reduction 53%) Leading to USD INCREASE.
Forecast of RATE CUT 85%+ (Next week) + Geopolitical risks Leading to STRONG SUPPORT for non-yielding Gold.
Decision Point: Await today's PCE Index data. Higher than expected PCE will be a strong shock for Gold!
🎯 Technical Analysis (TA):
Price is compressed within an accumulation range.
SELL Zone (Supply Zone): 4,220 - 4,231
Wait for reaction here to find Short opportunities.
BUY Zone (Demand Zone): 4,180 - 4,193
Wait for confirmation candles to find Long opportunities.
💡 Core Strategy
Market lacks clarity. Avoid big bets before PCE. Safe trading is to wait for a breakout or surf within the narrow range of 4,180 - 4,231 and manage risk tightly!
#XAUUSD #PCE #Gold #Forex #Trading

XAUUSD – Brian | Volume Profile & TrendlineXAUUSD – Brian | Volume Profile & Trendline: prioritize Sell, wait for a “good deal” in the liquidity zone
1. Market snapshot
On H1, gold is touching the trendline just as yesterday's scenario – this is an area where strong price reactions may occur.
The current structure shows that the price is gradually distributing below the trendline, with no clear signal that buyers have regained control.
In the short term, Brian prioritizes the Sell scenario, utilizing the POC – VAH – FVG areas of the Volume Profile to find entry points.
2. Volume Profile – Key price areas to note
Short-term POC/VAH area around 3,488–3,492 (according to his chart):
This is an area where dense trading occurred, the profile “bulges” out, indicating strong market interest.
When the price returns to this area, a reaction is expected – suitable for entering orders in the current priority direction.
Sell-side liquidity below: If gold cannot hold the POC/VAH area and is pushed down, the liquidity area below will become a reasonable target for the next downward move.
Gold is likely to fluctuate sideways on Friday to close the weekly candle below the trendline, then consider a clearer break at the start of next week.
3. Trading scenario for next week
Scenario 1 – Prioritize Sell at the Volume Profile area
Main mindset: When the price returns to the POC/VAH areas above, prioritize finding short signals instead of chasing buys.
Watch for clear candle reactions (long upper tail, pin bar, engulfing…) at the thick profile area.
Target: Gradually close towards lower liquidity areas (sell-side liquidity) below.
Depending on price behavior, the target can be expanded if selling pressure intensifies at the start of the week.
Scenario 2 – Break trendline & buy the retracement
If gold decisively breaks the downtrend line, closes above, and maintains the new structure:
Then, the strategy will shift to buying the retracement at the trendline itself (now acting as support).
The POC/VAL area below will then become a reasonable “buy zone” to follow the new upward trend.
In summary: before a clear break occurs, Brian still prioritizes selling at high liquidity areas, rather than rushing to catch the bottom.
4. Fundamental context – Large capital still supports gold
Central banks are increasing gold purchases:
In October, global central banks net purchased +53 tons of gold, the highest level since 11/2022.
This figure increased by +194% compared to July, marking the third consecutive month of increased purchasing speed.
This indicates: Short-term selling pressure may appear around the trendline/resistance, but long-term capital flow still favors gold.
Any deep declines later may still attract buying power from large institutions.
5. Risk management suggestions
Maintain the mindset: Sell is the current priority scenario, not the only option – if the structure changes, be ready to switch to buy.
Do not overlook the nearest liquidity/swing low area to place SL – avoid dragging SL too far due to emotions.

WILL GOLD STILL GO SIDEWAYS TODAY? WHAT DO YOU THINK?1. Overview
Yesterday's candle formed a Doji → the market is hesitant, not showing a clear main trend.
Today, if the candle closes below the support zone → prioritize SELL,
If the candle closes above the resistance zone → prioritize BUY.
2. Expected Trend
The market is likely to move sideways within the range:
4170 ⇄ 4220
Strategy: Trade according to the zone – follow the breakout of any boundary.
3. BUY ZONES
4180-4175
4155-4160
🔸 SL: 100 pips
🔸 TP: 100 pips
4. SELL ZONES
4217-4220
4230-4333
4240-4244
4260-4265
🔸 Wait for a clear price reaction in the zone before entering a trade.
5. Important Notes
Plan applies before the 22:00 news.
Break any zone, then follow that zone. Do not try to catch tops and bottoms.

WILL GOLD STILL GO SIDEWAYS TODAY? WHAT DO YOU THINK?1. Overview
Yesterday's candle formed a Doji → the market is hesitant, not showing a clear main trend.
Today, if the candle closes below the support zone → prioritize SELL,
If the candle closes above the resistance zone → prioritize BUY.
2. Expected Trend
The market is likely to move sideways within the range:
4170 ⇄ 4220
Strategy: Trade according to the zone – follow the breakout of any boundary.
3. BUY ZONES
4180-4175
4155-4160
🔸 SL: 100 pips
🔸 TP: 100 pips
4. SELL ZONES
4217-4220
4230 -4234
4240-4244
4260-4265
🔸 Wait for a clear price reaction in the zone before entering a trade.
5. Important Notes
Plan applies before the 22:00 news.
Break any zone, then follow that zone. Do not try to catch tops and bottoms.

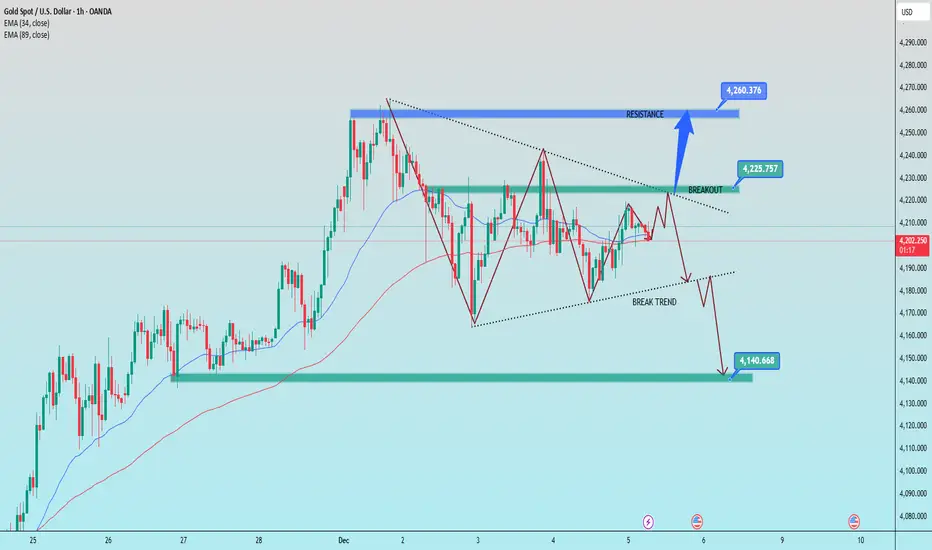
Gold price developments at the end of the week of December 51️⃣ Trend Line
Descent trend line (above – dashed line)
Price has been touched and rejected several times → becomes strong dynamic resistance.
The 4,225–4,230 price zone is a key area:
→ Valid breakout = opens upward momentum towards 4,260.
→ Failed breakout = price returns down following the previous trend.
Ascending trend line (below – dashed line)
This is dynamic support that maintains the short-term upward structure.
If price breaks through this trend line, a downtrend will activate.
2️⃣ Support Area – Key Resistance
4,225 – 4,230:
Confluence of the descending trend line + the previous supply zone → a designated area for buyers.
4,260 – 4,265:
Strongest resistance. When price touches this area, a downward reaction is likely.
Support
4,190 – 4,195:
The first area to be tested if the trend line is broken.
4,140 – 4,135 (lower green zone):
Very strong support – the main target if the downtrend is confirmed.
📌 Trading Signals
BUY GOLD: 4,140 – 4,138
Stop Loss: 4,130
Take Profit: 100 – 300 – 500 pips
SELL GOLD: 4,260 – 4,262
Stop Loss: 4,270
Take Profit: 100 – 300 – 500 pips
Gold’s Oscillatory SeesawGold is in a consolidative oscillation following a high-level pullback. Short-term volatility remains limited amid profit-taking activities and anticipation of upcoming economic data, while the medium-to-long-term trend is still underpinned by multiple core factors. Today, the price has fluctuated around the critical $4,200 level in a seesaw pattern, displaying distinct characteristics of a high-level oscillation with "limited downside and moderate upside momentum," as long-short divergence remains pronounced.
On the downside: The immediate short-term support remains in the $4,170 – $4,175 range, with key focus on the $4,153 – $4,155 zone. A break below this interval could trigger further downside movement, making it a crucial defensive level for medium-term bulls.
On the upside: The near-term resistance is at $4,220. A successful breakout and hold above this level may pave the way for a rally toward the $4,250 – $4,265 range.
Overall, today’s consolidative pullback in gold represents a short-term correction rather than a trend reversal. Operationally, traders can adopt a range-trading strategy of "buying low and selling high" for the time being, with key attention on the breakout of the $4,200 level. Meanwhile, remain vigilant of the guiding role of subsequent ISM Services PMI and PCE data on the market.
Trading Strategy:
Buy 4175 - 4185
SL 4170
TP 4220 - 4230 - 4240
Sell 4220 - 4230
SL 4240
TP 4190 - 4180 - 4170

GOLD Buying Trade idea From the Support LevelHello Traders
In This Chart GOLD HOURLY Forex Forecast By FOREX PLANET
today Gold analysis 👆
🟢This Chart includes_ (GOLD market update)
🟢What is The Next Opportunity on GOLD Market
🟢how to Enter to the Valid Entry With Assurance Profit
This CHART is For Trader's that Want to Improve Their Technical Analysis Skills and Their Trading By Understanding How To Analyze The Market Using Multiple Timeframes and Understanding The Bigger Picture on the Charts
GOLD Resistance Ahead!
HI,Traders !
#GOLD keeps growing
But will soon hit a horizontal
Resistance of 4229.11
So after the retest we will
Be expecting a local
Bearish correction !
Comment and subscribe to help us grow !

Gold Trade Set Up Dec 4 2025Price swept PDL and SSL to the left also tapping into 1h and 15m demand zones so i will be targeting higher BSL and PDH for a continuation higher

Gold (XAU/USD) Breakout Setup: Demand Zone Retest and Upside TarOverall Structure
The chart shows Gold Spot (XAU/USD) on the 30-minute timeframe, and it highlights:
A descending channel (blue parallel trendlines).
A support zone (yellow box).
A stop-loss zone (red area).
A long (buy) projection toward a high target point around 4,265.
1. Descending Channel
The price has been moving inside a clearly defined downward-sloping channel.
Currently, the price is:
Testing the upper boundary of the channel.
Showing signs of attempting a breakout.
This suggests momentum may be shifting.
2. Strong Support Zone (Yellow Box)
The highlighted yellow zone around 4177 – 4160 acts as:
A demand zone where buyers previously stepped in.
The chart suggests a potential retest of this area before a bullish push.
The projected price action line (blue sketch) shows:
Dip → retest support → breakout → rally.
3. Stop-Loss Zone (Red Area)
Under the yellow support sits a stop-loss / invalidation zone around:
4160.107 (marked explicitly)
This implies that if price drops below this level, the bullish scenario becomes invalid.
4. Bullish Target
The projected target is drawn high above the current price:
4265.369 – 4265.645
This is a large upward move, suggesting:
A breakout from the channel
A continuation to a new high
The vertical grey rectangle indicates the expected profit zone of the trade.
5. Trade Logic Implied by the Chart
Bullish thesis:
Step 1: Price dips back into 4177 → 4160 zone
Step 2: Buyers defend the zone
Step 3: Breakout above descending channel
Step 4: Rally toward 4265 target
This is a classic pullback-to-support before breakout structure.
Risk:
Break below 4160 invalidates the buy idea.
6. What This Chart Suggests
In summary:
Bullish signals:
A descending channel that often breaks upward after weakening momentum.
Strong demand zone highlighted.
Clear projection showing expected reversal and breakout.
Bearish risk:
If support fails, downside continuation is likely

XAUUSD - buy gold now...XAUUSD was recently in a short term downtrend for a few weeks but has now shown some clear bullish movements ahead. XAUUSD (Gold) has broken out of a downward trend channel that was acting as strong resistance, The price is very likely to head to the next strong resistance level which is marked as the take profit zone (green line). Time to buy GOLD now!

ElDoradoFx – GOLD ANALYSIS (04/12/2025, LONDON SESSION)1️⃣ Market Overview
Gold enters the London session after a strong bearish impulse that established a new intraday swing low at 4,175.17. Price is now retracing into a multi-timeframe premium zone, where both 15M and H1 fibo golden zones overlap, creating the highest-probability rejection area of the session.
The market remains in a corrective pullback against the higher-timeframe bullish structure, but London volatility is likely to determine whether price continues the sell leg into 4,163, or breaks above 4,214 to shift short-term momentum.
⸻
2️⃣ Technical Breakdown (D1, H1, 15M–5M)
🔹 Daily (D1)
• Macro trend remains bullish, with price trending above higher-timeframe demand (4,053–4,100).
• Current candles show exhaustion after the expansion toward 4,240s.
• RSI mid-range → neutral to corrective.
• D1 can support deeper pullback before continuation.
⸻
🔹 H1
Swing High: 4,264.58
Swing Low: 4,163.76
• Clean bearish correction from the 4,264 high.
• Price now pulling back toward 4,202–4,214, a premium zone combining fibo + supply + EMA retests.
• As long as price remains below 4,214, bears remain in control intraday.
• BOS confirms bearish structure; lower highs forming.
⸻
🔹 15M–5M
Swing High: 4,221.53
Swing Low: 4,175.17
• Strong impulse down → BOS → CHoCH confirming bearish micro-trend.
• Current retracement into 4,198–4,204 aligns perfectly with 15M golden zone.
• MACD showing weakening upside momentum as price approaches premium.
• Liquidity built above 4,192–4,204 likely to be swept before directional move.
⸻
3️⃣ Fibonacci Analysis (Dual-Frame Confluence)
📐 15M Fibo (Intraday Precision)
4,221.53 → 4,175.17
• 38.2% = 4,192.75
• 50% = 4,198.35
• 61.8% = 4,203.94
🎯 15M Golden Zone: 4,198 – 4,204
⸻
📐 1H Fibo (Stronger Trend Validity)
4,264.58 → 4,163.76
• 38.2% = 4,202.48
• 50% = 4,214.17
• 61.8% = 4,225.86
🎯 1H Golden Zone: 4,202 – 4,214
⸻
🔥 Combined High-Probability Golden Zone
4,198 – 4,214
This is the most powerful zone of the session:
✔ 15M + 1H fibo overlap
✔ Supply zone
✔ Liquidity pool
✔ BOS retest zone
✔ EMA rejection potential
This is where London session generates its highest-probability sell setups.
⸻
4️⃣ High-Probability Trade Scenarios
⸻
📉 SELL Scenario (Primary Bias – Continuation)
Sell Zones:
🔸 4,198 – 4,204 (15M golden zone)
🔸 4,202 – 4,214 (1H golden zone + HTF premium)
🎯 Targets:
→ 4,187
→ 4,178
→ 4,175
→ 4,163
🛑 SL: Above 4,214
⚡ Confirmation:
5M CHoCH, wick rejections, MACD momentum shift.
⸻
📉 SELL Breakout Setup
Trigger: Break below 4,175.17
Retest: 4,178–4,182 fails
🎯 Targets:
→ 4,163
→ 4,153
→ 4,140
🛑 SL: Above 4,182
⸻
📈 BUY Scenario (Countertrend Reaction Only)
Buy Zone: 4,175 – 4,163 (liquidity sweep zone)
🎯 Targets:
→ 4,187
→ 4,198
→ 4,204
🛑 SL: Below 4,158
⚡ Confirmation: BOS + strong rejection + volume.
⸻
📈 BUY Breakout Setup
Trigger: Break & H1 close above 4,214
Retest: 4,210–4,214 hold as support
🎯 Targets:
→ 4,221
→ 4,231
→ 4,239
🛑 SL: Below 4,210
⸻
5️⃣ Fundamental Watch
• London opening volatility expected after Asia’s corrective retracement.
• DXY mixed; no clear macro driver yet → liquidity-driven session.
• US data later will define whether deeper pullback continues or bullish reversal forms.
• Watch for liquidity sweeps at: 4,192, 4,198, 4,204, 4,214.
⸻
6️⃣ Key Technical Levels
Resistance: 4,198 / 4,204 / 4,214 / 4,221
Support: 4,187 / 4,178 / 4,175 / 4,163
Golden Zone: 4,198 – 4,214
Break Buy Trigger: > 4,214
Break Sell Trigger: < 4,175
⸻
7️⃣ Analyst Summary
Gold is in a well-defined corrective pullback after a strong bearish impulse. Price is now approaching the highest-probability sell zone of the day, where 15M and 1H fibos align with supply and liquidity. As long as the market remains below 4,214, the intraday bias stays bearish toward 4,175 → 4,163.
Only a confirmed reclaim above 4,214 shifts the bias into bullish continuation.
⸻
8️⃣ Final Bias Summary
📉 Primary Bias: Sell from 4,198–4,214 into 4,178–4,163
📈 Alternative Bias: Bullish continuation only above 4,214
⸻
🥇 ElDoradoFx PREMIUM 3.0 – PERFORMANCE 03/12/2025 🥇
⚡ Precision Trading. Clean Execution.
📈 BUY +60 PIPS
📈 BUY +50 PIPS
⚠️ SELL LIMIT – Deleted
📉 SELL +70 PIPS
📉 SELL LIMIT +20 PIPS
📈 BUY +110 PIPS
📉 SELL +40 PIPS
📉 SELL +210 PIPS
📈 BUY +110 PIPS
❌ BUY –30 PIPS (SL)
📈 BUY +110 PIPS
⚖️ BUY +20 PIPS
📈 BUY +60 PIPS
📈 BUY +170 PIPS
━━━━━━━━━━━━━━━
💎 SWING TRADES – STILL RUNNING
🔵 BUY → +3,005 PIPS
🟣 BUY → +2,260 PIPS
🟢 BUY → +1,390 PIPS
📊 Multi-day bullish structure remains intact while intraday setups continue delivering high-probability executions.
━━━━━━━━━━━━━━━
💰 TOTAL PIPS GAIN: +1000 PIPS
🎯 14 Signals → 13 Wins
🔥 Accuracy: 93%
━━━━━━━━━━━━━━━
✅ Strong, controlled session — clear trend alignment and premium-level precision.
More setups loading tomorrow… stay sharp and stay ready 📈✨
— ElDoradoFx PREMIUM 3.0 Team 🚀
