XAUUSD SHORT SETUP ( 20 NOV 2025 )If you have doubt on our trades you can test in demo.
OANDA:XAUUSD SHORT SETUP
📊 EP: 4059.400
💵 TP: 4033.252
❌ SL: 4072.330
Trade Ideas:
Idea is clearly shown on chart + we have some secret psychologies and tools behind this.
Trade Signal:
I provide trade signals here so follow my account and you can check my previous analysis. So don't miss trade opportunity so follow must.
Xauusdupdates

XAU/USD: Gold in Downtrend, Waiting for Demand Surge⏰ Timeframe: 30m
📅 Update: 11/20/2025
🔍 Market Context
After the technical rebound at the beginning of the week, gold returns to adjust within the descending channel pattern, indicating that short-term upward momentum is temporarily weakening.
The current structure reflects a rebalancing state after the price was rejected at the 4,127 USD supply zone – coinciding with the 30-minute frame Supply Zone.
However, the Demand Zone below still plays an important role in maintaining the medium-term upward structure.
📊 Technical Structure
Supply Zone (4,127 USD): main resistance area, confluence with the nearest peak – where the price was strongly rejected during the Asian session.
OB Bearish (4,106 USD): short-term supply area, highly likely to be retested after completing the adjustment phase.
Demand Zone (4,013 USD): main support area in the descending channel, also the confluence point between the channel boundary and the lower liquidity zone.
Liquidity Sweep: signal indicating that lower liquidity has been absorbed, opening up the possibility of forming a higher low.
🎯 Market Outlook
High probability scenario:
1️⃣ Price continues to fluctuate within the descending channel, retesting the 4,013 USD Demand Zone.
2️⃣ If a clear price reaction occurs, the market is likely to break the channel, opening up a technical rebound to OB Bearish 4,106 USD or Supply Zone 4,127 USD.
3️⃣ Losing the 4,013 USD area will temporarily invalidate the rebound structure, bringing the price back to a lower balance area around 3,990 USD.
🧠 Analyst’s View
Gold is in a corrective pullback phase – where the market needs to regenerate liquidity before forming a new expansion wave.
A reasonable scenario is sweep – retest – expansion: sweep lower liquidity, retest the supply area, then determine the main trend for the end of the week.
Buyers still have a slight advantage as long as the Demand Zone is maintained.
🛡️ Risk Note
This is a phase of market liquidity accumulation, fluctuations may be erratic.

XAU/USD – Inverse H&S Forming, Gold Eyes Bullish Reversal🔍 Market Context
Early today, Gold dropped nearly 70 points, but immediately rebounded strongly from 4040, signaling aggressive BUY interest and a clear rejection of downside continuation.
On the H2 chart, XAU/USD is shaping a clean Inverse Head & Shoulders pattern — a classic reversal structure that often precedes a strong bullish expansion.
The macro layer for today is packed with high-impact catalysts:
📌 Key Data & Events – 20 Nov
Speech by U.S. President Donald Trump
Barkin (2027 FOMC voter) speaks on economic outlook
Federal Reserve FOMC Meeting Minutes
Williams (permanent FOMC voter) speech
U.S. Unemployment Rate
Non-Farm Payrolls (NFP)
Initial Jobless Claims
➡️ A heavy news lineup capable of triggering high volatility and validating (or rejecting) the reversal pattern.
📊 Technical Analysis – MMF View
Gold bounced sharply from BUY ZONE 4044–4046 with strong volume.
The market structure is creating a complete Inverse H&S formation.
The Neckline Zone 4101–4111 is the key breakout level — clearing this zone opens the door for a full bullish reversal.
Trendline compression + liquidity sweeps show buyers gaining control.
Strategy for today: BUY bias. SELL only for quick scalps.
🎯 MMF Daily Trading Plan
BUY (Priority Setup – Swing / Intraday)
Buy 4046–4048
SL: 4039
TP: 4060 → 4085 → 4100 → 4125
✔️ BUY aligns with the reversal pattern + fresh liquidity shift.
SELL (Scalping Only)
Sell 4146–4148
SL: 4154
TP: 4132 → 4120 → 4110
✔️ SELL only if price taps liquidity at upper supply and rejects clearly.
⚠️ Key Levels to Watch
4101 – 4111 – 4142 → liquidity clusters + breakout confirmation
4029 → major support in case volatility spikes from news
🧠 MMFLOW TRADING Outlook
If Gold holds its corrective pullback and breaks above the Neckline (4101–4111), we may see a strong continuation toward:
4146 → 4187 → 4210+
The Inverse H&S on H2 is a powerful bullish setup — smart positioning favors building long exposure and holding into high-impact events.

Gold Drops, Rebounds, Drops Again – Structure Still Bearish1. What Happened Yesterday
Gold reacted perfectly from the indicated sell zone, dropping almost 800 pips in a very short period.
However, immediately after the decline, the market turned violent with a 600-pip reversal, followed by another 700-pip drop overnight.
Such chaotic swings clearly show a battle between bulls and bears, with neither side managing to seize full control so far.
2. Current Market Context
This is one of the most difficult types of environments to trade:
- Momentum is uncertain
- Volatility is extreme
- Direction changes rapidly
Still, certain levels remain crucial for identifying the next move.
3. Technical Outlook
Key levels to watch:
- 4050 support → absolutely critical for bulls
A break and sustained move below 4050 would likely open the path toward a retest of 3900
- 4100 zone → immediate upside barrier
A clean stabilization above 4100 could finally give bulls the strength to push toward 4200
Without a decisive break of either level, expect more volatile two-sided trading.
4. Trading Plan
As of now, my bias remains bearish, unchanged from yesterday.
However, I remain aware of the strong intraday volatility and the possibility of fast upside spikes.
My main scenarios:
- Below 4050 → bearish continuation, targeting 3900
- Above 4100 → bullish momentum, possible rise toward 4200
Until one of these breaks occurs, expect Gold to remain noisy and difficult.
5. Conclusion
Gold is in a highly unstable phase, with sharp 600–800 pip swings in both directions. The market is fighting for direction, but structurally, the bearish bias still dominates unless price regains stability above 4100.

GOLD LOSES MOMENTUM AFTER FOMC – BUY OR SELL OPPORTUNITY TODAY?1. Market Context
Yesterday, the market showed a clear risk-averse sentiment, leading safe-haven flows into gold. This pushed the price back up to retest the 4130–4133 resistance zone — an area where gold has repeatedly failed to break through.
During the US session, the FOMC minutes were released with a notably hawkish tone:
The Fed is not ready to cut interest rates yet.
They want more data before the December meeting.
Some members even want to maintain a tighter stance.
This message weakened gold’s bullish momentum, causing the price to correct down from the highs.
2. BUY Zones for the Day
🎯 Ideal BUY (highest priority):
4010
3998
🎯 Extended BUY:
4010 – 4015
4035 – 4040
→ These are solid support areas, suitable for traders looking to catch intraday rebounds.
3. SELL Zones
🔥 Strong SELL (major resistance):
4130 – 4133
🔥 Extended SELL:
4148 – 4150
→ Both zones align with multi-tested resistance levels that have shown strong reactions.
4. Special Zone to Watch – Trend Decision Point
📌 4080 – 4085 (Fibo 0.5 – 0.618)
If price breaks above 4085 clearly, gold may shift to an intraday bullish trend → prioritize breakout BUY, avoid SELL setups.
If 4085 holds, the market remains in range → continue BUY at support & SELL at resistance.
5. Suggested Trading Strategy
Style: SL 10 points – TP 10 points
Priority: BUY at clear support and SELL at strong resistance
Avoid trading in the mid-range (high noise, easy to get stopped out).
Enter positions only when price touches key zones — avoid chasing moves.

GOLD FALTERS POST-FOMC – BUY OR SELL NOW?1. Market Context
Yesterday, the market had a risk-averse sentiment, so safe-haven flows poured into gold, pushing the price to test the resistance area of 4130–4133 – where gold had previously failed multiple times.
During the US session, the FOMC minutes were released with a rather "hawkish" tone:
The Fed is not yet ready to cut interest rates.
Wants to see more data before December.
Some members even want to maintain a tighter stance.
This news weakened gold's upward momentum, and the price adjusted down from the peak.
2. BUY Zones for the Day
🎯 Ideal BUY (highest priority):
4010
3998
🎯 Extended BUY:
4010 – 4015
4035 – 4040
→ These are reliable support zones, suitable for a trading style that catches the rebound.
3. SELL Zones
🔥 Strong SELL (hard resistance):
4130 – 4133
🔥 Extended SELL:
4148 – 4150
→ Both zones coincide with resistance that has reacted well multiple times before.
4. Special Zone to Watch – TREND DECISION
📌 4080 – 4085 (Fibo 0.5 – 0.618)
If the price clearly breaks 4085, gold may change trend for the day → prioritize BUY on breakout, limit SELL.
If 4085 holds, the market remains sideways within the range and continues the strategy of BUY support – SELL resistance.
5. Suggested Trading Strategy
Style: SL 10 points – TP 10 points
Priority: BUY at clear support – SELL at strong resistance
Avoid trading in the middle zone (noise – easy to hit SL).
Place orders only when the price hits the zone – don't fomo in between.

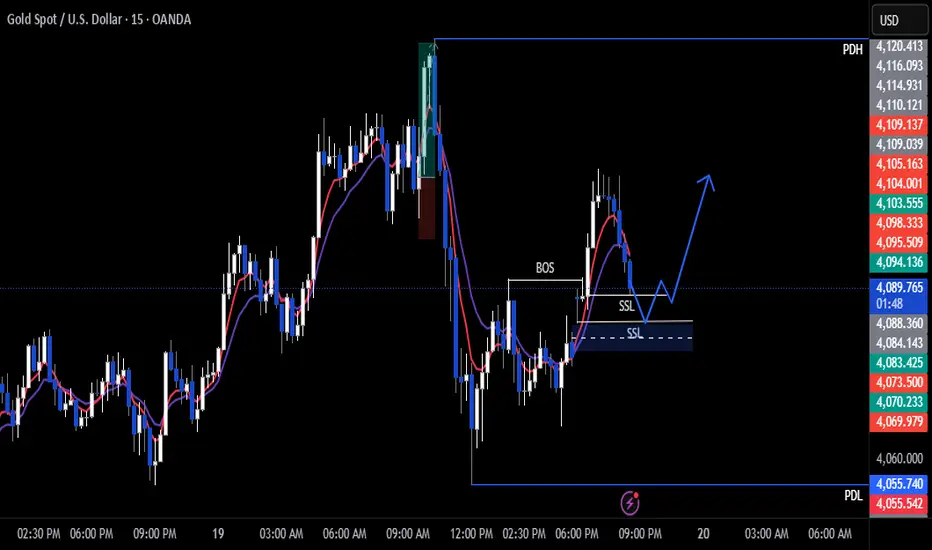
Gold Trade Set Up Asia Session Nov 19 2025Gold Pushed down during New York session sweep SSL but then closes above 4h swing low and BOS to the upside on the 1h and 15m so i want to see internal SSL swept along with a test of the gap to then wait for 5m-15m bullish engulfing candle and CISD to target PDH
Gold Price Outlook: Strong Support Rebound Toward 4,255XAU/USD – Technical Analysis (16 Nov 2025)
Overall Market Context
Gold experienced a sharp decline after breaking out of its rising channel, reaching a major support zone between 4,050 – 4,065. Price is currently stabilizing above that support, attempting to form a short-term base for a bullish correction.
1. Key Technical Zones
🔵 Major Support Zone (Strong Demand)
4,050 – 4,065
This zone has acted as the first strong buy reaction after the breakdown.
Multiple wick rejections show aggressive buyers waiting here.
A clean break below → opens deeper correction towards 4,025 – 4,030.
🟦 Immediate Resistance Zones
4,100 – 4,110
First intraday resistance.
Price must break above this to confirm bullish momentum.
4,120 – 4,130
Secondary resistance.
A break above this confirms the reversal structure.
🎯 Main Bullish Target
4,255 – 4,260
This aligns with:
Former channel midline projection
Fibonacci extension zone
Previous major swing high area on the chart
The chart clearly marks the bull target at 4,255.718.
2. Market Structure Breakdown
🔻 Previous Trend
Price was trading inside an ascending channel (yellow lines).
Broke down sharply → entered correction phase.
Now attempting a bullish re-entry after hitting strong support.
🔄 Current Price Behavior
Price is forming higher lows on the micro-trend after the spike down.
A short-term wedge/bull flag structure is developing.
Bulls are defending support aggressively.
3. Expected Move (Based on Your Chart Projection)
Primary Bullish Scenario ✔️ (Most Probable)
Hold above 4,070 – 4,085
Break above 4,100 → 4,110
Pullback retest
Push toward 4,130
Bull continuation toward the target 4,255
This matches the yellow arrow path drawn on your chart.
4. Bearish Alternative Scenario ❗
If gold breaks below 4,050 with strong momentum:
Next support → 4,025 – 4,030
Deeper correction back toward 3,990–4,000 zone becomes possible.
But currently buyers are controlling the support zone.
5. Summary
Structure: Reversal attempt after channel breakdown
Momentum: Neutral → turning bullish
Key Level to Break: 4,110
Bull Target: 4,255
Support Holding: Strong
Bias: Bullish above 4,070, bearish only below 4,050 RUS:NG1! RUS:SI1! RUS:GD1! RUS:SV1! RUS:USDRUB.P RUS:MX1! RUS:NA1! RUS:RI1! RUS:IRUS.P RUS:PD1! RUS:ED1!
If you want, I can also generate:
✅ Trading signal in multiple languages
✅ Short-term & long-term forecast
✅ Buy/Sell zones with risk management
Just tell me!

XAUUSD(GOLD): From Previous Setup to this,POV remain the sameGold touched our risk entry and zone and dropped around +800 pips. We expect the price to continue falling and break through the channel. Once we have confirmation, we can focus on the risk area rather than having two selling entries. You can choose from three targets based on your setup. Please manage your risk effectively while trading gold. We wish you the best.
Good luck and trade safely.
Team Setupsfx_

Gold Recovers, Targeting FVG & Liquidity Zone 4.20x📊 Market Structure
Gold has completed a deep decline from the 4,20x zone and continuously created bearish BoS, indicating sellers controlled the period from 14–18/11.
However, a significant sign appeared when:
Price created an Order Block at 4,008 USD
Then surged to create a Change of Character (ChoCH) on the H1 timeframe
The market maintained higher lows on the intraday structure
This indicates that selling momentum has weakened, and buyers are starting to rebuild a short-term bullish structure.
Currently, the price is approaching the Supply & Resistance zone at 4,086 USD – the zone confirming the strength of the BUY side.
If the price decisively breaks this zone, the next targets are clear:
FVG 4,150 USD
Liquidity Zone 4,202 USD – where old peak liquidity is concentrated
💎 Key Technical Zones
• Order Block: 4,000 – 4,009 USD → the main reversal zone of the current rally
• Supply & Resistance: 4,078 – 4,086 USD → trend confirmation point
• FVG Zone: 4,132 – 4,150 USD → zone where a corrective reaction may occur
• Liquidity Zone $$$: 4,195 – 4,205 USD → target of large capital flows
🎯 Trading Plan – Prioritize BUY according to structure
1️⃣ BUY Setup – Trend Following
Activated when price breaks and retests the 4,086 USD zone:
Entry: 4,086 – 4,090
SL: 4,058
TP1: 4,132
TP2: 4,150
TP3: 4,202
→ This is the highest probability setup: a new uptrend is forming + retesting the invalidated supply zone.
2️⃣ BUY Setup 2 – Deep Retracement (safer)
If the price is rejected at 4,086 and returns to test the lower zone:
Entry: 4,050 – 4,058 (Premium Zone on chart)
SL: 4,028
TP: 4,086 → 4,132 → 4,150
→ This setup offers a higher R:R, suitable for patient traders.
3️⃣ SELL Scalp – For intraday only
If the price hits FVG 4,150 and shows strong rejection signals:
Entry: 4,148–4,150
SL: 4,160
TP: 4,130 → 4,100
→ Not for swing traders. This is merely a technical reaction at the FVG zone.
🧠 Vincent’s View
The main trend of the day leans towards recovery – expanding towards upper liquidity.
As long as the price remains above 4,008 USD, the BUY side will continue to lead the market.
“Follow the structure, follow the liquidity — the market never lies.”

Gold Rebounds, But Sellers Likely Preparing for Another Drop1. What Happened Yesterday
Gold finally rebounded after the steep 2500-pip drop from the recent top.
Although I anticipated this rebound, my preferred buy zone around 3970 was never reached. Instead, Gold dipped only slightly below the 4000 figure, then climbed to the 4080 zone.
This confirms that buyers are still active
2. Current Market Context
In my view, this bounce is just a corrective move, not the start of a new bullish leg.
Momentum remains bearish, and the market structure still favors another wave of selling.
3. Technical Outlook
Key levels to watch:
- 4120–4140 → resistance zone and ideal area to hunt for new short entries
- 4080 → intraday pivot
- 3900 → next major target and strong technical support
As long as Gold stays below 4140, the path of least resistance remains to the downside.
4. Trading Plan
My plan going forward is simple:
- Look for shorts on rallies into 4120–4140
- Hold a downside target at 3900
- Reassess only if Gold breaks and stabilizes above 4140
Until then, selling strength continues to make the most sense.
5. Conclusion
Gold’s rebound was expected — but limited. With the broader trend still bearish, I anticipate another decline, potentially toward the 3900 zone. Any rally into resistance should provide attractive selling opportunities.

Gold’s Next Rebound May Break 4100 for 4120-4140 RangeCurrently, gold’s attempt to break through 4100 has failed, and it has pulled back to around 4080. If it rebounds again, it will most likely break through 4100 directly and fluctuate within the 4120 - 4140 trading range
Accurate signals updated daily. They serve as a reliable guide for trading issues – feel free to refer to them. Hope they help!

Gold pullbacks present buying opportunities.The gold pullback has ended, with a steady rebound after retracing to the 4000 psychological level, forming an upward trend.
Therefore, the strategy should focus on buying, following the mainstream trend.
From the current price action, the 4100 resistance level has been broken and has now become support. The Fibonacci retracement level also shows the 0.382 Fibonacci retracement is around 4092.
The 1-hour moving average for gold has turned upwards, indicating continued upward momentum. After breaking and stabilizing above 4100, gold is now steadily rising on the 1-hour chart. The 4090 area has formed short-term support, and a pullback to the 4090-4100 range presents a buying opportunity.
Therefore, we simply need to wait for a pullback to the 4090-4100 range to buy.
I personally believe the US session will provide such an opportunity.

Gold RalliesToday, after the Asian session opened, gold did not continue the previous day’s downward trend but oscillated upward overall. This shows that after a short adjustment at the opening, bullish momentum has once again taken the upper hand, with strong market absorption capacity.
The key support level for today is 4025 - 4030, and the strong support remains the 4000 integer mark. A break below this level may trigger panic selling in the market.
For the upper resistance, we focus on 4120. If it breaks through smoothly, we expect it to surge towards the 4150 - 4180 range.
Buy 4080 - 4085
SL 4070
TP 4100 - 4110 - 4120
Sell 4120 - 4125
SL 4135
TP 4090 - 4080 - 4070

XAUUSD - Time to buy gold...XAUUSD was recently in a short term downtrend for a few weeks but has now shown some clear bullish movements ahead. XAUUSD (Gold) has broken out of a downward trend channel that was acting as strong resistance, The price is very likely to head to the next strong resistance level which is marked as the take profit zone (green line). Time to buy!

Gold Trade Set Up Nov 19 2025Gold is trading above PDH and has shifted to bullish structure now making HH/HL on the 1h and has filled the 4h FVG already, so i want to first see a test of 1h demand and/or 75 fib to then looking for internal 5m-15m bullish engulfing candle and CISD to take price higher to BSL

XAUUSD in rising channel Market is in Rising wedge channel and I'm still on upside.
What are my conditions For This setup?
- 1st buying area will be 4095-4085 and target will be 4135 - 4145 & 4160 in extension.
Second if H4 closed below 4080 then market will test 4050.

An upward trend line has formed,be wary of a breakout above 4100#XAUUSD TVC:GOLD OANDA:XAUUSD
The intraday short limit order has been closed with profit, but there is still some room for a short-term pullback. The hourly chart shows an upward trend line below, with the 4H middle line converging with the MA5 and MA10 moving averages around 4077. The hourly moving averages also point to around 4077, which is also a previous area of dense trading volume, and may provide some support in the short term. Therefore, if gold prices pull back to 4082-4077 during the European session, I think we can try to go long on gold with a small position.

Gold: Fakeout Completed, Pennant Target is on goingHi guys!
Gold just completed a textbook sequence of bearish structures. After the strong drop that formed the flagpole, price consolidated inside a pennant pattern. This type of setup typically continues in the direction of the prior move, and the measured target sits around $3,946, which aligns with your highlighted zone.
Before breaking lower, price formed an inverse head and shoulders, the reaction to the target of this pattern happened and we saw a clear fakeout right above the trendline.
As long as Gold stays below this broken trendline, the expectation is for a retest/rejection, followed by continuation toward the pennant’s full target.
The overall structure still favors the downside unless the market reclaims the fakeout region convincingly.
Disclaimer: As part of ThinkMarkets’ Influencer Program, I am sponsored to share and publish their charts in my analysis.

XAU/USD 19 November 2025 Intraday AnalysisH4 Analysis:
-> Swing: Bullish.
-> Internal: Bullish.
Analysis and bias remains the same as analysis dated 20 October 2025.
Price has printed as per previous intraday expectation by printing a bearish CHoCH which indicates, but not confirms, bullish pullback phase initiation.
Price is currently trading within an established internal range, however, I will continue to monitor price with regards to depth of pullback.
Intraday expectation:
Price to continue bearish, react at either discount of 50% internal EQ, or H4 supply zone before targeting weak internal high priced at 4,380.990.
Note:
The Federal Reserve’s sustained dovish stance, coupled with ongoing geopolitical uncertainties, is likely to prolong heightened volatility in the gold market. Given this elevated risk environment, traders should exercise caution and recalibrate risk management strategies to navigate potential price fluctuations effectively.
Additionally, gold pricing remains sensitive to broader macroeconomic developments, including policy decisions under President Trump. Shifts in geopolitical strategy and economic directives could further amplify uncertainty, contributing to market repricing dynamics.
H4 Chart:
M15 Analysis:
-> Swing: Bullish.
-> Internal: Bullish.
As per analysis dated 14 November 2025, price has printed a bearish CHoCH to indicate, but not confirm bearish pullback phase initiation.
Price is currently trading within an established internal range.
Intraday expectation:
Price to trade down to either discount of 50% internal EQ, or M15 demand zone before targeting weak internal high, priced at 4,245.195
Note:
Gold remains highly volatile amid the Federal Reserve's continued dovish stance, persistent and escalating geopolitical uncertainties. Traders should implement robust risk management strategies and remain vigilant, as price swings may become more pronounced in this elevated volatility environment.
Additionally, President Trump’s tariff announcements, particularly against China, are expected to further amplify market turbulence, potentially triggering sharp price fluctuations and whipsaws.
M15 Chart:

GOLD HIGH PROBABILITY BUY SOON!!!🚨 XAUUSD HIGH PROBABILITY BUY SETUP 🚨
* Here We Can See Clearly The Next Potential Moves For GOLD Coming Hours.
* Keep Your Eyes Close On Your Trading Positions.
* Happy PIP Hunting Traders.
FXKILLA.

Gold Near 4100: Breakout or Reversal?As of now, gold is maintaining a steady upward consolidation, with the price briefly approaching 4100—well in line with expectations. Most traders should have captured this wave of profit. The next focus is whether gold can break above the 4100 resistance zone. Based on the 4H chart structure, the market still shows potential for an upside breakout.
In the U.S. session, several key speeches and the FOMC meeting minutes will be released, which could trigger significant volatility. If your account is not in ideal condition, make sure to manage risk in advance.
From a technical perspective, the major short-term resistance remains the 4110–4114 area. If the news supports the bullish side, the price could extend toward 4136–4150, and with the boost from tomorrow’s NFP data, a test of 4200 is also possible.
However, if sentiment favors the bears, gold may fall back toward 4000, with further supports at 3980 and 3940/3896.
Overall, from tonight’s U.S. session to tomorrow’s NFP release, the market is entering another period of heightened volatility—full of both risks and opportunities. If you cannot react to rapid price swings, it’s safer to wait for a selling opportunity after an upward spike or a buying opportunity after a pullback, and avoid chasing highs or panic selling at lows.

Gold: 4000 Breakdown → 4080 Breakout, Short StrategyAfter breaking below the key level of 4000 today, gold staged a minor rebound. It then oscillated within the 4030-4050 range and rebounded again during the US session, successfully breaking above 4080 so far.
Resistance above remains significant – we can continue to go short at high levels
Accurate signals updated daily. They serve as a reliable guide for trading issues – feel free to refer to them. Hope they help!
