XAUUSD structure is still bullish XAUUSD structur is still bullish
I will buy on every DIP
As I mentioned 4180-4190 area is my buy zone .
Secondly if H4 closed below 4175 then market will retest my 4145-4135 structural demand zone where I will start buying again .
Target remain same 4245 then 4275 on intraday
Xauusdupdates

Xauusd Tradse Satup Trade Setup
You placed a sell trade with:
Entry: ~4217
Stop Loss: ~4227
Take Profit: ~4206 (approx – based on green zone)
This is a 1:1.2 to 1:1.5 RR short position.

XAUUSD buy and sell level to look forGOLD on Friday with montly close price significantly moved to montly high. As with the new montly open, price is in a pullback to antoher important daily support level.
There is a significant rejection on the lowertimeframe which now moving in down trend on 1h and 15minutes timeframe. Price level 4154.70 is a key liquidity zone with strong impulse created from the level on Friday before weekend closer can be test and may have another rejection to the resistance.
Therefore looking for possible sell on 4195.00 level and upon rejection, possible buy on 4155.00

XAUUSD– Retracement Toward Last Week’s 50% Level?Gold is currently experiencing a corrective pullback after failing to sustain highs near the November peak. Price is showing early signs of weakness as it dips back into the mid-range structure, suggesting that a deeper retracement is likely before any continuation.
A key expectation here is a fill toward the 50% level of last week’s candle, which aligns closely with the 4,143 – 4,134 zone. This area also overlaps with previous demand, making it a strong reaction level.
🟢 Plan A – Deeper Pullback to Demand
Price continues to decline toward the 4,143–4,134 support/demand zone.
This area includes:
The 50% retracement of last week’s candle
Previous consolidation and breakout zone
A structural demand block on 2H
If price reacts strongly here with bullish wicks and momentum, a long entry becomes favorable.
Possible Entry: 4,143–4,134
Potential Targets:
TP1: 4,190
TP2: 4,225
TP3: 4,268
Invalidation: Clear breakdown below 4,134 with bearish continuation.
🔵 Plan B – Bullish Rejection Above Mid-Zone
If sellers fail to push price toward 4,143 and the market holds above the 4,225 zone, gold may shift into a bullish continuation structure earlier than expected.
A strong bounce here could lead to:
Retest of 4,268 (major resistance)
Potential continuation into 4,300+
Entry Idea: Bullish rejection from 4,225 support
Targets:
4,268 (main resistance)
4,300+ extension move
Invalidation: Drop back below 4,200 with momentum.

XAU/USD 02 December 2025 Intraday AnalysisH4 Chart:
-> Swing: Bullish.
-> Internal: Bullish.
Analysis and bias remains the same as analysis dated 20 October 2025.
Price has printed as per previous intraday expectation by printing a bearish CHoCH which indicates, but not confirms, bullish pullback phase initiation.
Price is currently trading within an established internal range, however, I will continue to monitor price with regards to depth of pullback.
Intraday expectation:
Price to continue bearish, react at either discount of 50% internal EQ, or H4 supply zone before targeting weak internal high priced at 4,380.990.
Note:
The Federal Reserve’s sustained dovish stance, coupled with ongoing geopolitical uncertainties, is likely to prolong heightened volatility in the gold market. Given this elevated risk environment, traders should exercise caution and recalibrate risk management strategies to navigate potential price fluctuations effectively.
Additionally, gold pricing remains sensitive to broader macroeconomic developments, including policy decisions under President Trump. Shifts in geopolitical strategy and economic directives could further amplify uncertainty, contributing to market repricing dynamics.
H4 Chart:
M15 Analysis:
-> Swing: Bullish.
-> Internal: Bullish.
Price has printed as per analysis dated 14 November 2025 where I mentioned price to trade down to either discount of 50% internal EQ, or M15 demand zone before targeting weak internal high, priced at 4,245.195.
Price subsequently printed a bearish CHoCH, however, as mentioned yesterday, I would closely monitor price with respect to depth of pullback.
Price did not pull back with any significance, therefore, I will apply discretion and not classify an iBOS. I have marked this with red dotted and dashed lines.
Price has since printed another bearish CHoCH.
We are currently trading within an established internal range, however, as per yesterday, I will continue to monitor price with respect to depth of pullback.
Intraday expectation:
Price to trade down to either discount of 50% internal EQ, or M15 demand zone before targeting weak internal high, priced at 4,264.700.
Note:
Gold remains highly volatile amid the Federal Reserve's continued dovish stance, persistent and escalating geopolitical uncertainties. Traders should implement robust risk management strategies and remain vigilant, as price swings may become more pronounced in this elevated volatility environment.
Additionally, President Trump’s tariff announcements, particularly against China, are expected to further amplify market turbulence, potentially triggering sharp price fluctuations and whipsaws.
M15 Chart:

Technical corrections do not mean reversal of the bullish trend#XAUUSD OANDA:XAUUSD TVC:GOLD
📊 From the current structure, gold rebounded to a high of around 4264 yesterday before fluctuating downwards.
💠 However, the price of gold has not yet effectively broken below the daily MA5 and MA10, and there is still some support below.
📈 The brief pullback is a build-up for a better rise later.
🌈 As I said yesterday, the technical indicators showed a bearish divergence, indicating a need for technical correction. Therefore, it is not surprising that gold prices will fall in the short term.
💡 The key focus for today is the daily MA5 and MA10. The first support level is at 4205-4195. If the price retraces to this level, you can consider a small long position in gold, with appropriate SL orders.
💡 If the price falls below the 4205-4195 support zone, it is advisable to remain on the sidelines and not rush into further trading. Because the downside potential may open up, the price may fall back to the 4160-4140 Fibonacci retracement zone in the short term. This area will determine whether the upward trend can continue. Pay close attention to any stabilization signals in this area during the day.

GOLD: Intense long-short dynamicsGold is trading in a high-level oscillation today with intense long-short dynamics. While strong fundamental supports such as Federal Reserve rate cut expectations underpin the price, upward momentum is constrained by profit-taking activities. In early trading, a surge in profit-taking sales triggered a sharp intraday decline; although the price rebounded subsequently, the momentum and sustainability remained weak. Overall, gold has oscillated within a high range
Going forward, focus should be on the U.S. November ISM Manufacturing PMI data and Fed policy developments. If gold breaks below the $4,200 support level, it is likely to move toward the $4,173 – $4,180 range.
In terms of resistance: The immediate short-term resistance lies around $4,230, where the price has faced repeated rejection during rebounds— a breakthrough is required to unlock further upside momentum. The $4,260 – $4,270 range represents a key resistance zone that bulls have failed to breach in multiple recent attempts, boasting strong selling pressure. On the daily chart, a breakout above $4,280 is necessary to break the triangular consolidation pattern and initiate a new upward cycle.
Trading Strategy:
Buy 4200-4210
SL 4185
TP 4230 - 4240 - 4250
Sell 4225 - 4230
SL 4235
TP 4200 - 4195 - 4190

GOLD IN HAND WITH FED'S PUSH: ADJUSTMENT IS AN OPPORTUNITY!Wonderful! I will create another headline focusing on market dynamics and fundamental factors, excluding specific price levels, but still maintaining appeal and information.
🐂 GOLD IN HAND WITH FED'S PUSH: ADJUSTMENT IS AN OPPORTUNITY! 🚀
1. Fundamental Push
Main Support Force: Expectations of a dovish Fed and weak US economic data (PMI ISM 48.2) are weakening the USD and increasing bets on a Fed rate cut in December, strongly supporting Gold.
Geopolitical risks remain a potential "lifeline."
2. Technical Analysis & Opportunity
The main structure (1H) remains an Uptrend. The current price drop is a Pullback.
Strategic BUY Zone (DPZ):
Range: $4,195.961 – $4,199.760 (Converging with the Uptrend Line).
Action: WAIT TO BUY (LONG) when a confirmed reversal signal appears in this zone.
Targets:
TP1 (Short-term): $4,219.953
TP2 (Long-term): $4,244.426
Stop Loss:
Set a safe SL below DPZ, for example: Below $4,190.00.
🔥 Conclusion: As long as XAU/USD holds above the Uptrend Line and DPZ, we prioritize seeking BUY opportunities to continue the main trend.
#XAUUSD #Gold #GoldAnalysis #ForexTrading #FED #USD #LongOpportunity #MarketStructure

What do you think about gold’s movement today?Hello traders!
What do you think about gold’s movement today?
Market Context
This morning, the Fed Chair delivered a speech without mentioning any economic updates. Despite that, gold still showed a corrective move, indicating that the SELL side remains dominant at the moment.
Main Strategy for Today
Prefer SELL setups
Stop selling only if price breaks above 4,246 — a key level defended by sellers.
Consider SELL entries at the previous high 4,265.
Additional SELL reaction zone to watch: 4,227 – 4,225.
BUY on deeper pullbacks
Ideal BUY zone: 4,194 – 4,190
closer BUY zone: 4,209 – 4,206
→ Only BUY if strong support reactions or reversal patterns appear.
Risk Management
Stop Loss (SL): 100 pips
Take Profit (TP): 100 pips
→ Maintain consistent risk throughout the session.
Do you think gold will continue to face bearish pressure and break lower,
or will it bounce from these deeper support zones and regain momentum?

Where Can Gold (XAUUSD) Take a Correction?Looking at your chart, Gold is moving up in a short-term recovery, but there are strong resistance zones above where a correction (downward move) can happen.
1️⃣ Zone: 4113 – 4120 (Current Area)
This is a minor resistance.
Small pullback is possible but not a major reversal zone.
2️⃣ Major Resistance Zone: 4143 – 4147
This is the first strong supply zone.
Price fell sharply from this zone earlier.
This is the most likely area for correction.
3️⃣ Strong Resistance: 4176 – 4180
If price continues upward, this is the next major resistance.
High probability that gold will correct from here.
4️⃣ Upper Resistance: 4200 – 4207
This aligns with your upper trendline.
This is the highest and strongest reversal zone.
A deep correction can start from here.
Stay Tuned For More Updates

XAUUSD (GOLD) – TECHNICAL ANALYSIS (1 Hour)1️⃣ Trend Analysis
The market is in a strong uptrend.
Price is trading above the 50 EMA and 100 EMA, which confirms bullish momentum.
Every small pullback is being bought → buyers are in control.
2️⃣ Support & Resistance (from your chart)
Major Resistance
4250 – 4252 → This is a very strong resistance zone.
Price touched this area multiple times but failed to break → sellers active here.
Support Levels
4205 – First strong support
4200 – Psychological + technical support
4175 – Deeper support (near EMA zone)
3️⃣ RSI Analysis
RSI = 65 → bullish momentum, not overbought yet.
No bearish divergence → trend is healthy.
4️⃣ Price Action Summary
Price is stuck under 4252 resistance.
Wicks appear on top → indicating rejection.
If breakout doesn’t happen, a pullback is possible.
5️⃣ Possible Next Moves
🎯 Bullish Scenario (More likely)
If price closes above 4252, then:
Target 1: 4265
Target 2: 4280–4300
A clean breakout will continue the strong uptrend.
🟥 Bearish Scenario (if rejection continues)
If price gets rejected again at 4252:
Target 1: 4230
Target 2: 4205
Target 3: 4175 (EMA support)
🔥 My Recommended Trading Plan
✔️ Buy Setup (Safe Trade)
Buy only after 4252 breakout + retest
Stop Loss: 4240
Take Profit 1: 4265
Take Profit 2: 4280
✔️ Sell Setup (Counter-trend, risky)
Sell only if price rejects from 4252 again
SL: 4260
TP1: 4230
TP2: 4205
📌 Final Conclusion
Gold is strongly bullish, but 4252 is a very strong resistance.
Breakout = big buy opportunity
Rejection = small short opportunity
Stay Tuned For More Updates

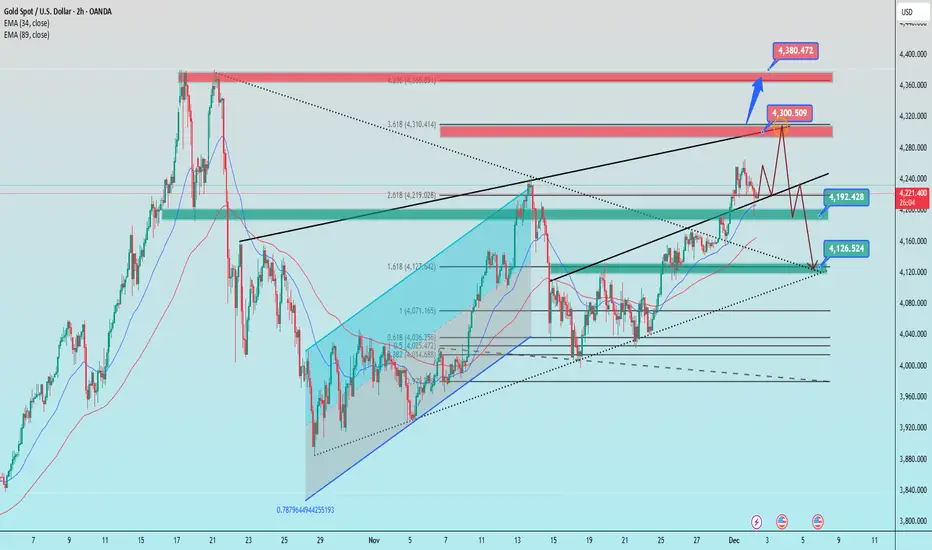
Scenario after the speech of the FED chairman on December 21️⃣ Trendline
Ascending trendline (lower black line)
This is the main dynamic support of the current trend.
Price is retesting the trendline after a strong bounce → holding above it keeps the bullish structure intact.
Descending trendline (upper black line)
A strong dynamic resistance from the higher timeframe, aligning with the 2.618 Fibonacci extension.
Price reacted and weakened when touching it → indicating selling pressure emerging.
2️⃣ Key Support & Resistance Zones
Resistance
4,300 – 4,315: Confluence of
✔ 3.618 Fibonacci extension
✔ Descending trendline
✔ Previous supply zone
→ This is the strongest reversal area.
Upside target if broken:
→ 4,375 – 4,380 (Fibo 4.236 + higher-timeframe supply zone).
Support
4,192 – 4,200:
✔ Demand zone
✔ Confluence with EMA + retest of ascending trendline
→ This is the short-term support.
4,125 – 4,130:
✔ Confluence with major ascending trendline
✔ 1.618 Fibonacci extension
→ This is the strong support – target if breakdown occurs.
3️⃣ Fibonacci Structure
The previous bullish wave completed a classic Fib extension pattern:
✔ 1.618 → 4,127
✔ 2.618 → 4,219
✔ 3.618 → 4,310
→ This reflects a fully extended wave, increasing the probability of a correction.
4️⃣ Price Scenarios
Scenario 1 (primary – correction expected)
Price rejects strongly at 4,300 →
🔻 Drops to 4,192 → if broken → moves toward 4,125 (major bounce zone).
Scenario 2 (bullish breakout)
If an H4 candle closes above 4,310, the move may extend toward 4,375 – 4,380.
Trade Ideas
BUY GOLD : 4193 – 4191
Stoploss: 4183
Take Profit: 100 – 300 – 500 pips
SELL GOLD : 4300 – 4303
Stoploss: 4313
Take Profit: 100 – 300 – 500 pips
GOLD BIGGEST FALL COMING ? IS THE END OF BULL RUN ? GOLD H1 !!Greetings
Gold H1 Time Frame We Have A Strong Selling Zone On Multi Time Frames And Gold Has Gaves Us Confirmation For Sell , It Has Respected The Selling Zone And Gold Price Gives Rejection From Selling Zone Now We Have To Sell Gold With A Confirmation Patterns And Structures Target Will Be Sell Side Liquidity
200 / 500 Pips Move We Need To Capture, Pending Sell Side Liquidity
Gold Buying Zone

“Resistance Rejection → Bearish Pullback Toward Support🟡 GOLD (XAU/USD) – Bearish Rejection from Major Resistance 🟥📉
🔍 Key Technical Insights
Price rejected the major resistance zone around 4,245 – 4,255
Rising Support Line has been broken → signals weakening bullish momentum ❌
Current structure favors a pullback toward demand area
Market seeking liquidity below recent swing lows 💰
🎯 Suggested Targets (with stickers)
Target Type Price Area Sticker
TP1 → Support Retest 4,210 – 4,215 🎯
TP2 → Demand Zone 4,195 – 4,205 📉💰
📌 TP1 is your high-probability target
📌 TP2 is for extended move if bearish momentum continues ⬇️
📌 Trade Setup Idea
📍 Sell Entry Zone:
➤ 4,238 – 4,245 (after failed breakout)
❌ Stop-Loss:
➤ Above 4,255
🎯 Take Profit:
➤ TP1: 4,215 🎯
➤ TP2: 4,200 📉💸
🧭 Overall Market Outlook
Factor Bias
Short-term Trend Bearish Pullback 🔻
Liquidity Downside targets in focus 💧
Resistance Reaction Strong rejection 🚫

Gold Price Outlook – Trade Setup (XAU/USD)📊 Technical Structure
OANDA:XAUUSD Gold rejected the $4,251–$4,265 Resistance Zone, forming a clear lower-timeframe reversal after failing to sustain the early Asian session push. Price has slipped back toward the $4,220 handle, signalling buyer exhaustion near the upper boundary of the recent range.
The chart shows a clear downward reaction from resistance, with price now rotating lower toward the $4,210–$4,198 Support Zone. A sustained break below $4,220 increases the likelihood of a deeper pullback into support.
As long as gold remains capped beneath $4,251–$4,265, the near-term structure favours bearish retracement before the next directional move develops.
A decisive 1H close above $4,265 would invalidate the bearish scenario and reopen the path toward $4,280–$4,300.
🎯 Trade Setup
Idea: Sell into the rejection from resistance, targeting a pullback toward support.
Entry: $4,251 – $4,265
Stop Loss: $4,271 (above resistance zone)
Take Profit 1: $4,210
Take Profit 2: $4,198
Risk–Reward Ratio: ≈ 1 : 2.64
Bias remains bearish in the short term while price holds below $4,251–$4,265. A 1H close above this zone invalidates the setup.
🌐 Macro Background
According to FXStreet, gold edged higher to near $4,230 earlier on Tuesday as markets continue to price in an 87% chance of a December Fed rate cut, supported by weaker US manufacturing data. The ISM Manufacturing PMI fell for the ninth consecutive month to 48.2, reinforcing expectations of monetary easing and generally supporting gold.
However, renewed demand for the US Dollar and softer Chinese physical gold demand at elevated prices have started to cap upside momentum. The Financial Times reported weakening retail gold activity in China due to high prices and heavier tax burdens, reducing fundamental demand.
This week’s key US data — ADP, ISM Services, and PCE inflation — will determine near-term USD flows. Stronger numbers may lift the dollar and add pressure to the XAU/USD downside, aligning with the bearish pullback illustrated on the chart.
🔑 Key Technical Levels
Resistance Zone: $4,251 – $4,265
Support Zone: $4,210 – $4,198
📌 Trade Summary
XAU/USD failed to break above the $4,251–$4,265 resistance zone and is now rotating lower, in line with renewed USD demand and weakening Chinese gold buying. While broader Fed rate-cut expectations still support the medium-term bullish bias, the near-term structure favours a pullback toward $4,210–$4,198. The setup supports selling rallies beneath resistance, with caution ahead of major US macro releases.
⚠️ Disclaimer
This analysis is for reference only and does not constitute trading advice. Trading involves significant risk, and proper risk management is essential.

ElDoradoFx – GOLD SESSIONS ANALYSIS (02/12/2025, ASIA SESSION)
Price is currently trading inside the intraday compression zone after a corrective pullback from the 4,264 weak-high region. Structure remains bullish on higher timeframes, but the 5M–15M show exhaustion and possible deeper retracement if liquidity below 4,225 is taken first. Asia Session likely sets the liquidity grab for London/US continuation.
⸻
📊 TECHNICAL OUTLOOK
🔹 D1 (Daily)
• Bullish structure remains intact with clean BOS from mid-November.
• Price retested the ascending trendline + premium discount region (4,050–4,000) and bounced aggressively.
• Current target remains 4,275–4,310 if intraday structure maintains its bullish flow.
🔹 H1
• Clear rising channel; price rejected upper boundary at 4,264.
• Current pullback still respects EMAs + trendline support around 4,225–4,215.
• A break below 4,215 opens room for a deeper correction into 4,183–4,175.
🔹 15M–5M
• Compression forming a descending micro-channel.
• Multiple CHoCHs showing indecision.
• Liquidity sits both above 4,240–4,245 and below 4,225–4,220.
• Expect Asia to sweep one side before choosing direction.
⸻
🟦 Fibonacci Golden Zone
Last swing:
Swing Low → 4,142
Swing High → 4,264
Golden Zone (0.618–0.705):
➡️ 4,215 – 4,203
This remains the high-probability buy zone if price retraces deeper.
⸻
🎯 HIGH PROBABILITY ZONES
🟥 SELL SETUP (If Asia sweeps liquidity up first)
Sell Zone: 4,240 – 4,248
Entry Confirmation: CHoCH on 5M + rejection wicks
Targets:
• TP1: 4,230
• TP2: 4,215
• TP3: 4,203 (Golden Zone)
STOP: Above 4,252
🟩 BUY SETUP (Preferred if price dips first)
Buy Zone: 4,225 – 4,215
Ideal Buy Level: 4,218
Targets:
• TP1: 4,240
• TP2: 4,255
• TP3: 4,275 (Weak High)
STOP: Below 4,205
⚡ Breakout Setups
Bull Breakout:
Buy above 4,248
Targets → 4,262 / 4,275 / 4,295
Bear Breakout:
Sell below 4,215
Targets → 4,203 / 4,183 / 4,175
⸻
📌 FUNDAMENTAL WATCH
• Asia Session has no major red folder news, but liquidity conditions remain thin.
• Expect the real move during London Open tomorrow.
• US ISM data (tomorrow) may drive strong volatility — trade with caution.
⸻
📍 KEY LEVELS
Type Level
Resistance 4,240 / 4,248 / 4,262
Support 4,225 / 4,215 / 4,203
Golden Zone 4,215 – 4,203
Breakout (Bull) 4,248
Breakout (Bear) 4,215
⸻
📝 SUMMARY
• Market still bullish on higher timeframes, but intraday is corrective.
• Best conditions: Buy the dip into 4,225–4,215 (GZ just below).
• Alternative: Sell a liquidity sweep into 4,240–4,248.
• Asia Session likely sets the trap — main move expected in London.
Bias:
➡️ Bullish as long as price stays above 4,215
❌ Bearish below 4,215
⸻
— ElDoradoFx PREMIUM 3.0 Team 🚀
⸻
🥇 ElDoradoFx PREMIUM 3.0 – PERFORMANCE 01/12/2025 🥇
📌 DAILY RESULTS
✅ SELL +40 PIPS
✅ BUY +20 PIPS
✅ BUY +210 PIPS
✅ BUY +20 PIPS
✅ BUY +40 PIPS
✅ BUY +100 PIPS
✅ BUY +100 PIPS
✅ SELL +15 PIPS
✅ BUY +100 PIPS
✅ BUY +40 PIPS
━━━━━━━━━━━━━━━
🔥 SWING TRADES – STILL RUNNING
📈 BUY → +3,005 PIPS
📈 BUY → +2,260 PIPS
📈 BUY → +1,390 PIPS
━━━━━━━━━━━━━━━
💰 TOTAL PIPS GAIN: +685 PIPS
🎯 Out of 10 signals we secured 10 WINS.
🔥 Phenomenal start to December — precision, discipline, and results.
Congratulations if you profited!
✅✅✅🚀🚀🚀

Why USD is a forex King !USD continues to show why it’s considered the king of the forex market—its strength sets the tone across major pairs. I’m watching how its momentum influences broader market structure

Gold Stabilizes Above $4,200 – Bullish OscillationGold has shown an oscillatory upward trend overall today. Bolstered by multiple positive factors including expectations of a Federal Reserve interest rate cut, its price has stabilized above the $4,200 mark and has been trading within a relatively high - level range throughout the session. Nevertheless, there is a risk of a mild technical correction in the short term.
In the near term, the key resistance level for Gold stands at $4,255. Having failed three previous attempts to break through this level, a large number of profit - taking sell orders have accumulated here, making it a strong resistance zone.
The immediate support level is at $4,200, which has transformed into a critical support barrier after being breached. If the gold price undergoes a further pullback, the range of $4,170 - $4,175 will act as subsequent support.
Should the price successfully break through the $4,255 resistance level, it is expected to advance toward the $4,280 - $4,300 range. In the event of a failure to break through this resistance, the price will likely fluctuate within the high - level range, though the downside room for correction is anticipated to be limited.
Trading Strategy:
Buy 4190 - 4200
SL 4180
TP 4240 - 4245 - 4250
Sell 4250 - 4255
SL 4265
TP 4230 - 4220 - 4210

XAUUSD Bullish Continuation With Structure Support – Intraday ViGold continues to respect its rising structure after building higher lows. The recent pullback was absorbed inside the marked support region, and price is now pushing back toward the upper range.
The structure suggests strength as long as price holds above the lower support band.
Key Technical Areas:
Support / Hold Zone: 4,186 – 4,220 region
Reaction Area: 4,235 – 4,245
Resistance / Upper Range: 4,280 – 4,295
Technical Outlook:
As long as price remains above the support zone, bullish continuation remains possible toward the upper range. A clear hold above recent highs may open further upside potential, while a breakdown below support would invalidate the structure.
This is a technical analysis idea for educational and charting purposes only.
If you want, I can also give you:
✅ A shorter version
✅ A caption for social media
✅ A more professional/advanced version
✅ A matching hashtag set

XAUUSD: Pullbacks are opportunities; remain bullishThe direction I've been aiming for these past two days has been correct, but unfortunately, the limited pullback in gold prices hasn't provided a suitable entry opportunity.
Currently, gold remains in an overall bullish trend. Gold has been consistently hitting new recent highs, indicating continued bullish strength. Pullbacks during the US session present buying opportunities. Now that gold is testing lower levels again, consider buying in the 4220-4230 support zone.
Looking at the 1-hour chart, the moving averages are still in a bullish golden cross and diverging upwards, suggesting further upward momentum and potential for continued gains.
Gold is currently in a bullish trend; pullbacks present buying opportunities. Trade with the trend.
Trading strategy:
Buy gold at 4220-4230
TP1: 4255
TP2: 4280
Set your stop-loss order according to your own situation. Good luck!

Xauusd Possible Scenarios (Next 24–48 Hours)1. Market Structure
Gold recently made a strong bullish rally (left side of chart), followed by a sharp correction and is now consolidating in a sideways range.
Current structure shows:
Lower highs forming
Higher lows weakening
Price compressing → triangle / squeeze zone
This indicates indecision and a potential big breakout coming soon.
📈 Bullish Scenario
Gold climbs back above 4106, holds, and breaks the trendline.
Target 1: 4150
Target 2: 4200
Target 3: 4250
Bullish trigger: Break and close above 4120 on 4H.
📉 Bearish Scenario
If price breaks 4000 – 4030 support:
Target 1: 3985
Target 2: 3920
Target 3: 3870
Bearish trigger: Strong 4H candle close below 4025.
For More Updates Stay Tuned

Gold Trade Set Up Dec 1 2025Gold remains bullish making HH/Hl on the 1h and 4h but i want to see internal 5m-15m structure play out first before looking to take buys towards BSL

Perfectly predicting market trends, continue to go long#XAUUSD TVC:GOLD OANDA:XAUUSD
✅ As I analyzed last week, with the weekly and monthly charts closing, the overall trend remains bullish. Not only did it rise as expected, reaching 4245, but it even touched a high of around 4255. It then quickly fell back, with 4245-4255 forming short-term resistance. If this resistance is broken, the bulls will continue to rise and may even reach the previous high.
📊 Currently, gold prices are holding above the daily MA5, so we maintain our bullish outlook. After a brief test, gold prices rallied again. The next step is to consider a small long position when the price retraces to the 4233-4220 range.
