XAUUSD: Pullbacks to support levels present entry opportunitiesThere’s no need to panic over gold’s pullback—the retracement is healthy and provides a better opportunity to re-enter long positions.
From the daily chart, gold remains firmly in a bullish structure this week. The rally during the Asian session followed by a corrective pullback is a normal consolidation move and does not change the overall bullish trend. It’s important to recognize that this is a retracement, not a reversal.
On the 1-hour chart, the key support zone is $4,142–$4,150, a level that has been repeatedly validated in previous sessions. Therefore, as long as gold’s pullback holds above this zone, I believe the bullish outlook remains intact.
Trading Plan:
Buy at: $4,142–$4,150
Take Profit 1: $4,170
Take Profit 2: $4,200
Stop-loss: Based on individual risk tolerance
Xauusdupdates

gold await breakout#XAUUSD base on H4 past candle and price movement, we expect price to retest 4187 for bearish reverse.
Sell limit 4187, target 4140, SL 4198.
Above the rectangle 4199-4200 holds bullish breakout to buy. Below the down rectangle on H1 closure will continue bearish also.

Gold Trade Set Up Nov 28 2025Price created a new HH on the 1h in Asia session then reversed in London to test 1h demand and bounced off it. Overall i am still bullish. internally price swept low range liquidity so i will want to see 5m-15m engulfing candle to continue higher to BSL

GOLD: Rally followed by a pullbackGold is showing a trend of rallying in the Asian session followed by short-term pressure today. While strongly supported by expectations of a Fed rate cut, it also faces high-level pressure from the weekly and monthly closing. The intraday trend is likely to be a "rally followed by a pullback".
After contesting near the middle band and trend line yesterday, gold chose to break upward. Despite the inertial upward momentum in the Asian session, the MACD indicator on this timeframe has shown a downward divergence, signaling a potential pullback risk. We need to focus on the European and American session trends closely,if the rally fails to sustain after moving higher, a "rally to highs then close lower" pattern is likely to form.
Intraday Short-term Resistance: Around 4195. If gold successfully breaks above this resistance level, it may face pressure in the 4210 - 4230 range.
Short-term Support Levels: Keep an eye on the 4150 - 4160 zone. A breakdown below this level could trigger a further decline to the key support at 4140.
Sell 4185 - 4190
SL 4195
TP 4160 - 4150 - 4140
Buy 4160 - 4165
SL 4155
TP 4180 - 4185 - 4190

XAUUSD Outlook🟦 Market Structure (H4 & D1)
Price continues to respect the ascending structure after a clean CHoCH → BoS → Breakout Retest on H4, indicating that bullish momentum remains intact.
On D1, the market appears to be completing an ABC corrective formation, with wave (3) established and wave (5) potentially extending towards 4,320 – 4,380.
🟦 Liquidity & Key Zones
H4 is approaching a liquidity pocket at 4,155–4,165, which is likely to trigger a short-term pullback before any continuation higher.
On D1, price is moving into a mild imbalance / residual supply region, yet there is no firm rejection so far – suggesting that the broader bullish trend remains favoured.
🟦 Expected Scenario
The higher-probability scenario: a brief retracement into the liquidity zone, followed by absorption and the formation of a higher low → continuation towards 4,245, and potentially 4,380 as wave (5) develops.
Only a decisive break beneath 4,110 would weaken the current bullish structure and invalidate this outlook.

“BOS Confirmed — Demand Retest for Next Bullish Leg🟡 GOLD (XAU/USD) – Bullish Continuation Setup from High Probability Demand Zone 🆙
🔍 Chart Breakdown & Key Insights
Price created a Break of Structure (BOS) to the upside → confirming bullish momentum ✔️
Retested the Demand Line + Support Zone → buyers defending strongly 💪
High Probability POI (previous accumulation zone) remains valid with liquidity swept below → smart money accumulation evidence 💰
Current pullback = healthy retracement into demand before potential continuation
🎯 Targets (With stickers)
🎯 Target Zone Price Region Sticker
TP1 → Retest recent high 4,165 – 4,175 🎯
TP2 → Liquidity above highs / extended target 4,180 – 4,195 🚀💸
TP1 hit possibility is HIGH due to bullish structure 📈
TP2 depends on strength of breakout ⬆️
📌 Trade Idea (High Probability Setup)
🟩 Buy Entry Zone:
➤ 4,120 – 4,130 (pullback entry at support)
🟢 Take-Profit:
➤ TP1: 4,170 – TP2: 4,190
📊 Risk-Reward Ratio: 1:2.5 – 1:3+ ✔️
🧭 Market Structure Sentiment
Factor Outlook
Trend Bullish 📈
Liquidity Upside still available 💧
Smart Money behavior Accumulation & continuation expected 💼
⚠️ Just watch if price breaks below the demand line → would weaken this bullish plan.

XAU/USD Price Outlook – Trade Setup📊 Technical Structure
OANDA:XAUUSD Gold (XAU/USD) remains supported after rebounding from the 4,154–4,160 support zone, keeping the short-term bullish structure intact. Price has broken above the 4,170–4,175 barrier and is now consolidating just below the 4,190–4,196 resistance zone, with buyers looking to extend gains as long as support holds.
The chart shows a bullish continuation pattern:
Support zone: 4,154 – 4,160
Resistance zone / target area: 4,190 – 4,196
As long as gold stays above 4,154, dips into support are likely to attract buyers, with upside potential toward 4,190–4,196. A decisive 4H close below 4,154 would invalidate the bullish setup and expose the 4,130 region.
🎯 Trade Setup
Idea: Buy dips into support, targeting a move toward the 4,190–4,196 resistance zone.
Entry: 4,160 – 4,154
Stop Loss: 4,149
Take Profit 1: 4,190
Take Profit 2: 4,196
Risk–Reward Ratio: ≈ 1 : 2.76
Bias remains constructively bullish while price holds above 4,154–4,160 on a closing basis.
A break below 4,154 would signal weakening momentum.
🌐 Macro Background
According to FXStreet, gold holds firm near a two-week high as rising expectations for a December Fed rate cut continue to support bullish sentiment. Comments from multiple Fed officials confirmed that further easing is a “live option,” helping gold absorb both a modest USD rebound and the broader risk-on tone.
Key drivers:
Fed rate cut expectations reinforced by dovish remarks from Williams, Waller, and Miran.
Kevin Hassett emerging as the frontrunner for Fed Chair, expected to support aggressive rate cuts.
Mixed US data failed to alter the easing outlook, keeping USD capped.
Russia–Ukraine developments keep geopolitical uncertainty in play, maintaining gold’s safe-haven appeal.
Despite improved risk appetite, gold’s bullish bias remains intact due to persistent USD softness and expectations of lower US rates. The fundamental backdrop continues to favor upside moves.
🔑 Key Technical Levels
Resistance zone: 4,190 – 4,196
Support zone: 4,154 – 4,160
📌 Trade Summary
Gold remains in a bullish continuation structure above the 4,154–4,160 support band. As long as this zone holds, the setup favours buying dips and targeting 4,190–4,196 where previous supply pressure may reappear. Fed rate cut expectations and geopolitical tensions underpin the bullish narrative, while risk sentiment limits immediate downside.
⚠️ Disclaimer
This analysis is for reference only and does not constitute trading advice. Trading involves significant risk, and proper risk management is essential.

XAUUSD Roadmap: Multi-Scenario Outlook Into Early DecemberThe chart shows Gold (XAUUSD) on the 4H timeframe approaching a major confluence area:
Price is pressing against a descending trendline resistance (red diagonal).
It is hovering around 4,187–4,190, a short-term supply zone.
Multiple support levels sit below:
4,143–4,131 = important demand / retest zone
4,043 = deeper demand
4,008 = major structural support
You also have an ascending channel, so price is being squeezed between rising support and trendline resistance.
This structure makes a breakout or rejection highly likely in the coming sessions.
🟩 PLAN A – Bullish Breakout & Continuation (Green Path)
Conditions:
Price breaks and closes above the descending trendline.
Bullish candles show momentum continuation.
Expected Movement:
Break above ~4,190–4,200
Retest of the broken trendline
Rally toward the next resistances:
4,209
4,231
4,268 (major target)
Why this plan makes sense:
Structure shows rising lows → bullish pressure increasing.
Breakout above compression often leads to strong follow-through.
Momentum already looks positive given the strong recent push.
Bullish invalidation:
If price falls back below 4,143, Plan A weakens considerably.
🟥 PLAN B – Short-Term Pullback, Then Uptrend Resumes (Pink Path)
Conditions:
Price initially rejects the descending trendline.
Pulls back into the nearby demand zone.
Expected Movement:
Reject around 4,187–4,200
Retrace into 4,143–4,130 demand
Buyers step in
Uptrend resumes, heading again for 4,200 and possibly the 4,231 area
Why this plan makes sense:
Markets often retest key levels before breaking out.
The 4,143–4,130 zone is strong structure + previous liquidity.
When Plan B fails:
A break below 4,130 leads into Plan C.
🟨 PLAN C – Bearish Breakdown Toward Major Support (Orange Path)
Conditions:
Price fails to hold the 4,143–4,130 demand zone.
Bearish momentum increases.
Expected Movement:
Breakdown under 4,130
Acceleration toward deeper liquidity pockets:
4,043
4,008 (major structural support)
Possible bullish reaction at or below these zones
Why this plan makes sense:
Breaking a key demand zone usually triggers a liquidity sweep.
Large downside wicks previously exist near 4,008, showing interest there.
Bearish invalidation:
A reclaim of 4,143 shifts back to neutral/bullish structure.

Gold price analysis November 27XAUUSD – Sellers appear but the uptrend is still intact
Gold is under profit-taking pressure around the 4172 area, causing the increase to temporarily slow down. However, the bullish structure has not been broken yet as the support Trendline below is still respected by the market. In the context of today being Thanksgiving Day in the US, liquidity may decrease and strong fluctuations are unlikely to appear.
The strategy still prioritizes BUY following the main trend, but needs to be patient and wait for the right safe entry point.
📌 Reference trading plan
BUY around: 4153
BUY when there is a price rejection signal at the support zone 4112 – 4090
BUY DCA when there is a clear break of the resistance 4172
🎯 Target: 4250
⚠️ Risk note: The uptrend will be invalidated if the price closes below the Trendline 4090 – then the strategy needs to be reviewed.

GOLD broke out of the H4 trendline — real breakout or trap? Hello Traders! 👋
Gold has broken out of the H4 descending trendline, boosted by geopolitical tension and a weaker USD.
But the real question is: Is this a true breakout or just FOMO before a drop?
Here are the key zones I’ll be watching today:
BUY Zones (SL 10 – TP 10)
• 4165 – 4155
• 4170 – 4175
• 4140 – 4145
• 411x
• 4099
SELL Reaction Zones (SL 10 – TP 10)
• 4200 – 4203
• 4212 – 4215
• 4230
• 4245 – 4247
👉 If price breaks below 4133, the trendline fails → potential sell-continuation setup.
📌 Bias: BUY is the main play — SELL only for short reaction scalps.
💬 What do YOU think — real breakout or classic bull trap? Drop your thoughts below!
❤️ Let’s discuss & grow together!

XAUUSD: 4150 is key; buy if it pulls back but doesn't break thisShifts in Global Geopolitical Dynamics:
The global landscape is undergoing noticeable changes, with recent developments showing a clear de-escalation in the Russia–Ukraine situation. This easing of geopolitical tension has placed upward pressure on gold under some constraint, meaning bullish sentiment should not be taken for granted. Entering long positions on pullbacks to support levels would be a more prudent approach.
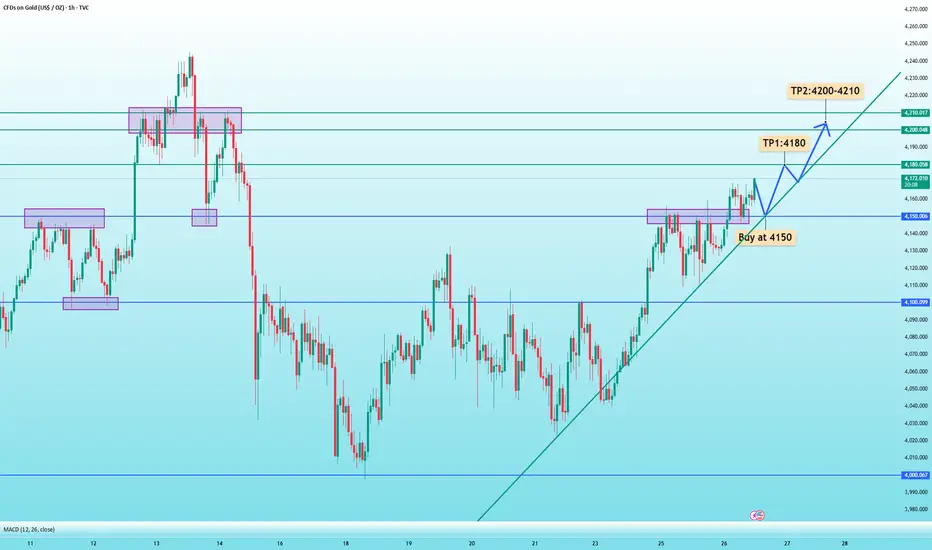
Today, gold successfully held above $4,150, turning this former resistance into new support. As such, the $4,150 level becomes the key trading pivot for the day.
From the 1-hour chart, as long as prices hold above $4,150, there remains potential for gold to retest $4,180, and possibly challenge the previous highs around $4,200–$4,210.
Trading Strategy:
Buy at $4,150
Target 1: $4,180
Target 2: $4,200–$4,210
Stop-loss: Around $10, adjusted based on individual risk tolerance
Key Data to Watch:
U.S. Initial Jobless Claims (weekly)
U.S. Durable Goods Orders (September, MoM)
11.27 Asian early-sessiong plan for goldI. Best Execution Outcome of Yesterday’s Strategy
Combined with yesterday’s European/North American session strategy and the current chart:
Long Strategy: If you entered a long position in the 4154-4158 zone during yesterday’s European session, the price peaked at 4168.78 (near the first target of 4170), locking in ~10-14 pips of profit. Holding into the North American session would still reach the first target of 4168, but volatility narrowed due to the Thanksgiving holiday, so 4172 was not breached.
Short Strategy: Yesterday’s North American session did touch the 4170-4172 short entry zone, but no clear reversal signals (e.g., bearish engulfing/shooting star) emerged — so the short setup was not triggered (this counts as a prudent wait for valid confirmation).
II. Trading Strategy for Today (Thanksgiving Holiday)
Key Pre-Reminder: Given the U.S. Thanksgiving holiday (low liquidity, early market close, and muted volatility), avoiding trading entirely is the most risk-averse and suitable choice for today.
If you still choose to participate (for small-scale practice), use an extremely conservative range-trading plan:
1. Core Approach
Stick to micro-range scalping only (no trend trades — low liquidity drastically raises false breakout risks).
2. Minimal-Risk Trading Plan
Range Boundaries: 4158 (support) → 4168 (resistance)
Long Setup: Enter only if price hits 4158 with a clear hammer candlestick; position size: ≤3% of total capital; Stop-loss: 4155; Take-profit: 4165.
Short Setup: Enter only if price hits 4168 with a clear shooting star; position size: ≤3% of total capital; Stop-loss: 4171; Take-profit: 4162.
3. Non-Negotiable Holiday Rules
No overnight positions: Close all trades before 19:00 UTC (well ahead of the early North American close at 22:00 UTC).
Strict position limits: Do not allocate more than 5% of total capital to trades today.
Prioritize inactivity: If no clean signals appear within 1 hour, step away — sitting out is the best choice for holiday markets.
GOOD LUCK!
LESS IS MORE!

XAUUSDAfter hitting take profit from last long trade we saw aggressive pullback which give us chance for the second long trade from fair value gap and golden ratio of fibonacci. Let us see how it will play. Cheers!

XAUUSD ANALYSISAfter SMASHING TP from previous long trade, market had consolidation which was part of creating short structure from touch supply zone for several times as pullback, it also started to have multiple rejection on 1 hour timeframe which show buyers exhaustion and when market resume it may give us Gold Dollar (XAUUSD) short opportunity.

Gold at a Crossroads( OANDA:XAUUSD XAUUSD) trading inside a descending channel, respecting both the upper and lower trendlines. Price is currently reacting from the upper boundary of the channel, suggesting potential short-term bearish pressure.
1. Price Structure
The market is forming lower highs inside a well-defined downward sloping channel, indicating a controlled corrective structure.
Price recently tested the upper trendline and rejected it, showing sellers defending this zone.
🟡 2. Key Resistance Area (Cluster Zone: 4210–4240)
At the top, there is a strong Fibonacci extension cluster:
1.414 (4212)
1.618 (4240)
This creates a heavy resistance zone, highlighted on your chart as a "Cluster".
If price ever breaks above the descending channel, this area becomes the major upside target, and also a strong potential reversal zone.
🟠 3. Support Zone (4120–4135)
The highlighted rectangle around 4120–4135 represents:
Prior demand zone
Confluence with internal Fibonacci levels
The midpoint area of the channel
This zone is critical.
A break below could open the way toward 4088 / 4068 (your blue levels).
🔵 4. Fibonacci Confluences
Multiple Fibonacci levels align with the current structure:
1.13 (4174) and 1.272 (4193) → Mid-range resistances inside the channel
0.786 (4128) → Matches the support box
0.618 (4105) and 0.5 (4086) → Targets if the market continues downward
These Fibonacci overlaps confirm the importance of the 4120–4135 zone as a turning point.
📉 5. Expected Scenarios
Bearish Scenario (More Likely Short-Term)
Because price rejected the channel top:
Expected drop toward 4128 → 4120 support zone
If broken, continuation toward 4088 → 4068
This matches your hand-drawn orange projection
Bullish Scenario
For bulls to take control:
Price must break the descending channel
Sustain above 4174 → 4193
Target the 4210–4240 cluster
This would be the beginning of a larger bullish structure.
🎯 6. Summary
Gold is currently bearish within a downward channel.
4120–4135 is the key support to watch; its reaction determines the next move.
If it holds → price may bounce inside the channel.
If it breaks → downside continuation toward 4088 → 4068.
If price breaks upward → 4200+ becomes the target zone.

Gold - This bullrun is now over!🚨Gold ( TVC:GOLD ) won't create new highs:
🔎Analysis summary:
All the way back in 2019, Gold confirmed its rounding bottom formation. This breakout was then followed by a major rally of about +200% over the past couple of years. But at this moment, Gold is retesting a major resistance trendline and will therefore end its bullrun.
📝Levels to watch:
$4,200
SwingTraderPhil
SwingTrading.Simplified. | Investing.Simplified. | #LONGTERMVISION

Gold: Narrow Volatility on ThanksgivingGold is showing a narrow-range oscillatory downward trend today. Influenced by the early close of the market for the U.S. Thanksgiving holiday, trading activity has turned sluggish. With no major news catalysts to drive momentum, it’s difficult to break out of the oscillatory range in the short term. However, the medium-to-long-term uptrend remains supported by multiple core factors.
During the early Asian session, gold briefly touched a high of 4168 before pulling back, and has been fluctuating within the 4140 - 4170 range overall—consistent with market expectations of thin trading and narrowed volatility during holidays.
Initial support lies around 4140, where buying interest has gradually emerged to form effective short-term support.
Key support focuses on the 4120 - 4130 zone, which is expected to effectively slow down further downward movement.
Immediate resistance is near 4170. From today’s price action, the market has pulled back after rallying to this range.
If broken, we will monitor yesterday’s resistance level at 4180.
Trading Strategy:
Buy 4140 - 4145
SL 4135
TP 4160 - 4165 - 4170
Sell 4165 - 4170
SL 4175
TP 4150 - 4145 - 4140

Gold Trade Set Up Nov 27 2025Overall i believe price action is still bullish but internally in the 15m we are making LL/LH and we got a lot of SSL plus daily FVG below that i believe will be targeted before continuing its bullish trend so i will be looking for internal 5m BSL to be swept followed by a bearish engulfing candle to target SSL

XAUUSD - Liquidity Storytelling Through Structure.🔶 Welcome to Liquidity Atlas — The Footprint Journal of XAUUSD
Gold continues to operate inside a liquidity-defined environment with a very clear distribution of resting pools and inefficiencies.
After the BOS, price expanded into a new range and began building repeated swing highs — each one reinforcing sell-side liquidity engineering and creating a clean cluster of liquidity labeled as SSS on the chart.
Below, one major point stands out:
a deep discount liquidity pool sitting around the blue zone, an area where price previously delivered impulsively and left inefficiencies unbalanced.
Markets rarely ignore untouched inefficiency for long — imbalance is the algorithm’s unfinished business.
Above price, we also hold a SIBI zone coupled with a previous swing high point.
The LH marks an area of premium where earlier rejection occurred, but inefficiency remains open — meaning there is unfilled narrative above, even while discount liquidity sits untouched beneath.
This creates a two-sided story, where liquidity exists both above and below, and the next sweep reveals intention.
This is not about predicting direction — it’s about understanding flow:
• BOS established a directional shift.
• SSS zones reflect engineered liquidity.
• The lower blue region remains a draw if displaced.
• SIBI overhead remains unmitigated inefficiency.
Whichever side gets liquidated first may reveal the algorithmic path — whether rebalancing inefficiency below or tapping into unmitigated premium inefficiency above.
The narrative is already in the structure. Price is simply writing the next chapter.
— Liquidity Atlas | Reading Imbalance, Not Guessing.

market on sideways#XAUUSD price is sideways, firstly from 4152 on M15 closure will drop the price till 4144 but we await for M30 to below 4141 which holds strong bearish.
Failure for close will become rejection zone which will correct back bullish.
Above 4167 - 4170 holds bullish breakout, price will range before the buy will continue but buy will be on valid breakout above 4167.

XAUUSD – 4H Outlook | Key Levels, Plans & Intraday BiasRecent candles indicate bull exhaustion at the descending trendline, with wicks rejecting higher prices. Momentum is slowing, and the chart suggests a potential short-term pullback into the support box before choosing direction.
Price is reacting to a cluster of key levels between:
4143–4130 zone (orange +blue support block)
4170 trend line resistance
4209 / 4231 resistance zone (upper yellow levels)
4268 major resistance (top of channel)
Bearish factors
Repeated rejection at descending red trendline.
Breakdown from minor rising sub-structure.
Price struggling to maintain above 4170–4180.
Bullish factors
Larger trend still inside a long-term ascending channel.
Strong support at 4130–4143 (multiple bounces).
High-timeframe buyers likely active below 4120.
✅ [ b]Plan A — Bearish Retracement to Buy Lower (Preferred Based on Current Price Action)
Idea: Price breaks below 4143–4130 to sweep liquidity, taps lower channel support, then reverses back upward.
Triggers:
Break below 4130 (blue zone)
Wick rejection or bullish reversal pattern at 4100–4080
Touch of channel support (green path in chart)
Targets:
TP1: 4130–4143 retest
TP2: 4170–4180
TP3: 4209 / 4231 (major mid-range resistance)
Invalidation:
A 4H close below 4080 signals deeper downside toward 4043.
✅ Plan B — Support Hold and Breakout Continuation (Bullish Scenario)
Idea: The purple support zone holds cleanly, price forms higher lows, breaks above the descending trendline, and resumes the uptrend.
Triggers:
Strong bounce from 4143–4130
Break and 4H close above 4175–4180
Clear breakout above the red downward trendline (purple projected path)
Targets:
TP1: 4209
TP2: 4231
TP3: 4268 (channel top / major resistance)
Invalidation:
A clean 4H close below 4130 shifts bias back to Plan A.

USD Stunned: Buy Gold at the Adjustment Bottom!1. Fundamentals Quick Take
US Data: Positive (Jobless Claims 216K, lowest in 7 months, Durable Goods +0.5%).
Fed Policy: Extremely Dovish. Fed officials hint at a 25bps rate cut as early as December.
Impact: Low interest rate expectations push DXY down: Strong support for Gold.
2. Technical Outlook - H1
Trend: Strong Uptrend.
Position: Price is below Resistance/Supply (CP Zone - around 4,175 - 4,195). High likelihood of short-term adjustment.
Strategy: Focus on BUY (Long) at strong Demand/Support zones, do not Short based on short-term reactions.
Ideal Long Zone: Around 4,129 or 4,096.
Conclusion: Wait for price to adjust to the Demand zone to enter Long orders following the main trend, based on the USD's decline momentum from Fed signals.
#XAUUSD #Gold #Fed #DXY #TradingView

Gold & Silver- Very strong finish of the year? (charts say so)It has been an exceptional year for gold bulls. With more than 60% growth year-to-date, the metal has delivered one of its strongest yearly performances in the past two decades.
Even though I’m primarily a short-term trader — rarely holding positions for more than one or two days — it’s impossible to ignore the bigger picture.
The macro-structure is sending a very clear message.
So let’s skip the fluff and dive straight into the charts.
1. XAUUSD: A Violent Range that Formed Something Very Clean
After printing a new all-time high just below 4400, gold collapsed nearly 5,000 pips, only to recover 3,500 pips in a similarly aggressive fashion.
Despite the day-to-day volatility — with 1,000-pip daily swings becoming normal — the structure has settled into a remarkably clean pattern:
A symmetrical triangle.
This pattern is typically a trend continuation structure, and given that the dominant trend is unquestionably bullish, the implication is obvious.
Recent bullish evidence:
- Price broke decisively above 4100
- Short-term structure flipped bullish
- The market is now consolidating tightly just under the descending trendline of the triangle
The most probable scenario?
👉 An upside breakout.
A confirmed break above this compression would target:
- 4250 – the next major resistance
- 4500 – psychological level
- 4700 – the full measured move of the triangle (approx. 5000 pips)
Of course, all eyes remain on the ATH zone, but structurally, the path of least resistance is still up.
2. XAUEUR: Same Pattern, Same Message
XAUEUR is forming an almost identical symmetrical triangle, with a measured target of roughly 4,000 pips if the breakout is confirmed.
When multiple major gold crosses deliver the same structure, it usually means one thing:
➡️ The underlying metal, not the currency pair, is driving the move. (and, as I said at least 5 times by now, STOP LOOKING AT DXY!!!!)
3. XAUGBP: Slightly Behind, but Still Bullish
XAUGBP also reflects the same pattern, though price is currently sitting ~200 pips below the descending resistance line.
Still, the structure remains bullish as long as the market holds its higher-low sequence.
4. XAUJPY: Even More Bullish
Unlike the symmetrical structures above, XAUJPY has formed an ascending triangle since its ATH.
Ascending triangles carry an even stronger bullish bias, showing that demand absorbs every pullback with increasing strength.
This chart is arguably the most aggressively bullish of the group.
5. Gold Futures: Breakout Already in Motion
Gold futures show the same broader pattern — but with one notable difference:
The trendline is already broken.
This makes futures the “leading chart,” often hinting at what spot XAUUSD may do next.
Outlook: When All Stars Align
When XAUUSD, XAUEUR, XAUGBP, XAUJPY, and Gold Futures all point in the same direction, the message is difficult to argue with.
Unless gold breaks back below 4050, the bias into year-end remains decisively:
⭐ Bullish.
⭐ Momentum-driven.
⭐ Trend-confirming.
Gold bull trend intact.
6. Silver: Quietly the Stronger Metal
Silver has actually been outperforming gold this year, with price nearly doubling. It is now sitting just under its most recent ATH.
After reclaiming the 50.50 level and establishing it as solid support, the structure is extremely bullish.
A clean break above the ATH would activate a measured move target near 65.
Silver continues to behave like the higher-beta version of gold — and right now, that beta is paying.
BY THE WAY, THIS IS MY PREVIOUS ANALYSIS COVERING GOLD CROSSES FROM 3 MONTHS AGO:
