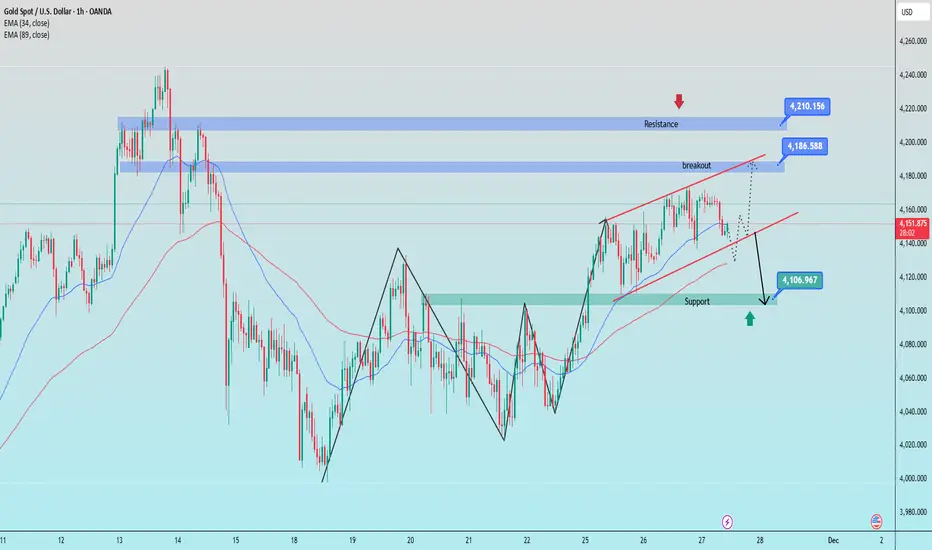
Gold is still moving sideways and waiting for a breakout1. Trendline Structure
Ascending Channel (red)
Upper trendline: price has been repeatedly rejected at the upper boundary → strong dynamic resistance.
Lower trendline: recently pierced slightly → indicates weakening buying pressure and increased correction risk.
2. Key Resistance
4,186 – 4,210: Strong supply zone + confluence with the upper trendline.
This is a zone that price will struggle to break without strong volume.
→ If price breaks above and successfully retests → the next target is the 4,210 area.
3. Key Support
4,105 – 4,110: Major support zone, confluence with EMA & the 0.5 Fibonacci level.
→ High probability that buyers will step in around this area.
4. Overview
Major Resistance: 4,186 – 4,210
Major Support: 4,105 – 4,110
Short-term Trend: weakening, leaning toward a corrective move.
Key Signal: a break below 4,140 → confirms a drop toward the support zone.
Bullish Scenario: only activated if the price reclaims 4,186.
BUY GOLD : 4107 - 4109
Stoploss : 4097
Take Profit : 100-300-500pips
SELL GOLD : 4209 - 4211
Stoploss : 4221
Take Profit : 100-300-500pips
Xauusdupdates
XAU/USD Price Outlook – Trade Setup📊 Technical Structure
OANDA:XAUUSD Gold (XAU/USD) eases lower after failing to break above the 4,168–4,175 resistance zone, with sellers defending this area and keeping price capped. The market structure has shifted into a short-term bearish setup, with waning bullish momentum and repeated rejection at resistance.
The chart presents a bearish continuation pattern:
Resistance zone: 4,168 – 4,175
Support zone / target area: 4,104 – 4,110
As long as price remains below 4,168, rallies toward the resistance zone are likely to attract sellers, with downside potential toward the 4,110–4,104 support band. A decisive 4H close above 4,175 would invalidate the bearish structure and open the way toward 4,183.
🎯 Trade Setup
Idea: Sell into resistance, targeting a move toward the 4,110 support zone.
Entry: 4,168 – 4,175
Stop Loss: 4,183
Take Profit 1: 4,110
Take Profit 2: 4,104
Risk–Reward Ratio: ≈ 1 : 4.49
Bias stays bearish while price holds below 4,168–4,175 on a closing basis.
A 4H close above 4,175 would signal buyers regaining control.
🌐 Macro Background
According to FXStreet, gold eased from a two-week high as improved global risk appetite and hopes for a Russia–Ukraine peace framework prompted some profit-taking in safe-haven assets. Thin Thanksgiving liquidity also encouraged short-term selling flows.
Despite this pullback, dovish Fed expectations continue to weigh on the USD:
-Durable Goods Orders rose only 0.5%, slowing from the prior month.
-Initial jobless claims fell to 216K, a seven-month low.
-Chicago PMI dropped sharply to 36.3, showing deeper contraction.
Fed officials reinforced expectations of a December rate cut:
-John Williams said rates could fall without hurting inflation goals.
-Christopher Waller noted the labour market is weak enough to justify easing.
-Stephen Miran stated that the economy requires large rate cuts to reach neutral policy.
This dragged the USD Index to a one-week low, providing underlying support to gold.
However, rising optimism regarding Russia–Ukraine negotiations boosted risk sentiment and limited safe-haven demand, aligning with the bearish technical rejection at resistance.
🔑 Key Technical Levels
Resistance zone: 4,168 – 4,175
Support zone: 4,104 – 4,110
📌 Trade Summary
Gold turned lower after repeated rejection at the 4,168–4,175 resistance zone, signalling a short-term bearish continuation pattern. As long as this zone caps the upside, the setup favours selling rallies into resistance with downside targets at 4,110–4,104.
Dovish Fed expectations keep gold supported on deeper dips, but improved risk sentiment and peace-talk optimism align with short-term selling pressure.
⚠️ Disclaimer
This analysis is for reference only and does not constitute trading advice. Trading involves significant risk, and proper risk management is essential.

Today: Can we break above 4200 again?Gold’s bullish trend has reignited amid rising Fed rate cut expectations. A minor pullback may unfold during today’s US session, followed by a rebound—with moderate resistance expected around 4200
Buy 4130 - 4140
TP 4160 - 4170 - 4180
Accurate signals updated daily. They serve as a reliable guide for trading issues – feel free to refer to them. Hope they help!

Gold Trade Secured 150 PipsPrice swept SSL but was still bullish overall so i waited for a CISD and 15m engulfing bullish candle to target BSL

Market outlook and investment strategy: I am bullish.#XAUUSD TVC:GOLD OANDA:XAUUSD
Judging from the structural trend and the performance of gold in different timeframes, gold has formed a short-term double bottom structure based on the trend line, and the prototype of the W pattern is gradually emerging.
Although the price retreated slightly after touching the channel resistance level around 4160 in the evening, it did not break the current upward structure, and the market is still dominated by bulls. Meanwhile, influenced by multiple positive factors such as geopolitical uncertainties and rising market speculation about a December rate cut, gold still has the potential for further gains.
Therefore, based on the current trend structure and fundamental logic, in the future trading process, we can first pay attention to the short-term resistance of 4170-4180, which is a key resistance under the triangle consolidation pattern. When it first touches this level, we can try to short gold with a small position and set the stop loss above 4185 to prevent the risk of a strong bullish breakout.
Meanwhile, if this strategy is effective, we need to pay attention to the subsequent rebound after the gold price falls back and stabilizes, which will help confirm the completion of the W pattern. At that time, we will focus on the breakout of the neckline at 4200-4205. If it can stabilize above this level, the upside potential will be further opened up, and it may extend to 4240-4245, or even higher!
In summary, our trading strategy must closely follow the confirmation signals of the trend structure. Therefore, it is essential to strictly control position size and stop-loss. We will continue to monitor market dynamics and optimize our trading strategy accordingly.

Gold Trade Set Up Nov 26 2025Price pushed higher in Asia but engulfed to the downside in London so now i will be waiting for either a 15m engulfing/CISD to the upside to target BSL or a push lower to lower SSL

Gold Price Poised for Breakout as Bullish Channel StrengthensHi!
Market Structure Overview
Price is moving within a clearly defined ascending channel, forming higher highs and higher lows. The recent pullback corrected only about 35% of the previous bullish leg, indicating that buyers are still in control and momentum remains positive.
Key Support Zone (Green Area 4,150–4,175)
This zone represents a former supply that has now flipped into a potential demand area. Price is currently pushing into it from below, and the reaction here will determine the next major move. A clean break and hold above this zone would signal strength and open the path toward higher targets.
Breakout Scenario
If price breaks above the green resistance block, the chart suggests a bullish continuation toward the major supply zone highlighted in red (4,220). The drawn arrow implies that momentum could accelerate once the breakout confirms, aligning with the channel’s upper boundary.
Upside Target (Red Zone 4,220)
This red area represents a strong supply where sellers previously stepped in aggressively. Should price reach this level again, some form of reaction or correction is likely.
Downside Risk
If the breakout fails and price rejects the green zone, a retracement back toward the mid-channel dashed line or even the lower channel boundary would be the next logical move.
Disclaimer: As part of ThinkMarkets’ Influencer Program, I am sponsored to share and publish their charts in my analysis.

XAUUSD - buy gold...XAUUSD was recently in a short term downtrend for a few weeks but has now shown some clear bullish movements ahead. XAUUSD (Gold) has broken out of a downward trend channel that was acting as strong resistance, The price is very likely to head to the next strong resistance level which is marked as the take profit zone (green line). Time to buy GOLD!

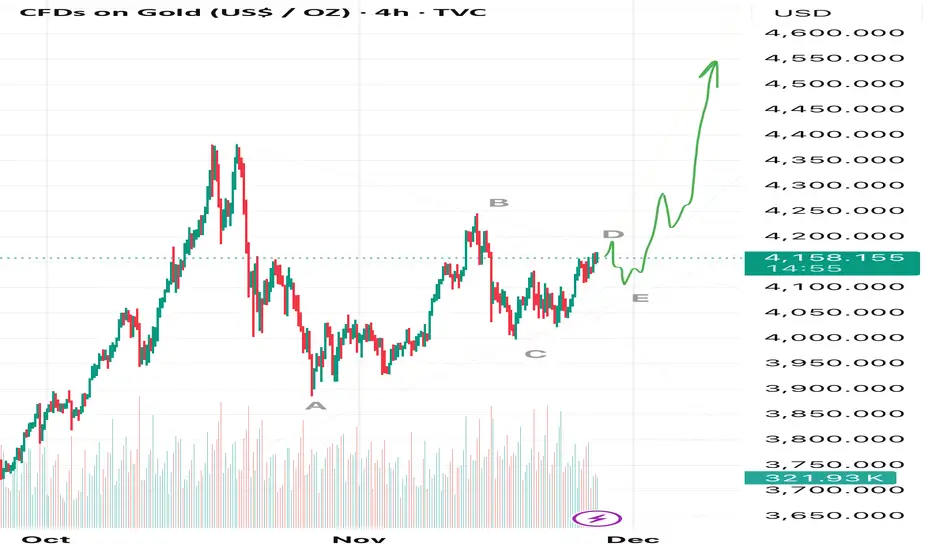
GOLD Triangle Almost Over — Green Arrow to $8000+ Begins After WHere’s the fresh update on Gold that many of you have been waiting for.
In my previous idea I said we had two active scenarios:
🟠 Either we were still building wave C (orange arrow → deeper correction),
🟣Or wave C was already complete and the chart was finishing wave D inside a huge triangle (purple arrow), after which the final green arrow up would start.
My current view:
Wave D (purple arrow) is almost complete!
This means we are literally one step away from a new all-time high. Wave E of this giant triangle is going to form right now — and once it’s finished, Gold will explode upward with the powerful green arrow.
Reminder: my global target remains above $8000+ in the coming years 📈
That’s why we need to watch the completion of wave E very closely — this will be the last major buying zone before the real moonshot!
Stay tuned, I’ll post the exact entry zone as soon as wave E shows its final structure. Don’t miss it — follow and turn on notifications! 🔔
Who’s ready for new ATHs very soon? Let me know in the comments! 👇
XAUUSD set to go another 500 pips?XAUUSD had bullish breakout early this asian session fueling by AUD breakout and DXY bearish move has boosted GOLD to remain bullish after Monday's strong breakout of weekly resistance level.
Market is maintaining series of higher low on 1h timeframe a pressure on current daily high at 4169.00
Breaking above 4169.00 and candle close in 4h or 1h can triiger buy trade targeting to 4210.00
Follow for more updates and analysis !

XAUUSD LONG TERM NEXT MOVE POSSIBLE ✅ Technical Analysis Breakdown (XAUUSD – 1H Chart)
gold chart shows a rising wedge / ascending channel, and price is currently reacting at the mid-range support.
You’ve drawn two potential outcomes – continuation upward or bearish breakdown. Let’s analyze both with precision.
📌 1. Current Market Structure
Price is inside a large upward channel.
It recently rejected from the upper trendline, pulling back toward the mid-channel support.
Price is now sitting near the horizontal support zone ~ 4045–4034.
This is a reaction zone where the next direction should become clear.
📈 2. Bullish Scenario (Bounce & Rally Toward 4250+)
Conditions for upside:
Price must break and hold above 4055 (you marked this level).
Bullish structure resumes with higher lows.
Target moves:
1st target: 4160
2nd target: 4250
3rd target: Retest of the channel top near 4300–4330
Your blue arrow upward matches this exact pathway.
Why this can happen:
Price still respecting the ascending channel.
Mid-channel support is holding.
Buyers may step in near support.
📉 3. Bearish Scenario (Breakdown to 3920–3890 Zone)
This becomes active only if price breaks below the rising trendline around 4020–4010.
Bearish targets:
1st target: 3980
2nd target: 3920–3890 (your green demand zone)
This is a strong liquidity pool where buyers previously entered.
Your downward arrow correctly points toward this demand zone.
Why this can happen:
Rising wedge patterns often break down.
Momentum is currently weakening.
Massive liquidity below 4000.
🎯 4. What Is Most Likely Right Now?
Based on the chart:
✔ Price is testing support.
✔ Still inside the bullish channel.
✔ No confirmed breakdown yet.
➡ Bias: Short-term bullish unless 4020 breaks.
Once 4020 breaks cleanly → bearish continuation becomes very likely.
🧭 5. Simple Trading Plan (Based on Your Zones)
Bullish Setup
Buy above: 4055
SL: 4020
TP: 4160 → 4250 → 4320
Bearish Setup
Sell after breakdown below: 4020
SL: 4050
TP: 3980 → 3920 → 3890
For More Updates Stay Tuned

XAU/USD: Decision at $4,190! Interest rate cuts boost Gold?I. 📰 FUNDAMENTAL ANALYSIS (FA)
Focus: The Dovish stance of the Fed is weakening the USD, supporting Gold.
Fed Signal: Fed officials are ready to cut interest rates soon due to economic data (Retail Sales, Consumer Confidence) indicating a slowdown.
Expectation: The market is highly pricing in the possibility of a 25bps rate cut by the Fed in December.
Conclusion: Gold (XAU) has a strong Bullish foundation from macro factors.
II. 📈 TECHNICAL ANALYSIS (TA)
Position: Gold is touching the DISCOUNT ZONE, a critical technical barrier that needs to be broken.
SELL Scenario (Short-term): Wait for rejection signals at the resistance zone to target a correction towards lower support levels.
BUY Scenario (Long-term): If the FA force is strong enough, a BREAK AND CLOSE above the resistance zone is needed to confirm continued upward momentum.
💡 STRATEGY
Monitor price action at Resistance: Trade based on Confirmation of reversal signals in this area, or wait for a Breakout.
#XAUUSD #Gold #Fed #DXY #TechnicalAnalysis #FundamentalAnalysis #TradingStrategy

XAU/USD – Gold Maintains Uptrend, Monitor Reaction at FvG⏰ Timeframe: 30m
📅 Update: 25/11/2025
🔍 Market Context
After breaking the downtrend structure and creating consecutive bullish CHoCH, gold is maintaining above the Break–FvG zone at 4,107 USD, indicating that buying pressure is still controlling the recovery phase.
The price is in a reaccumulation phase after the break, and it is likely to need a short pullback to "gain momentum" towards the extended resistance zone above.
📊 Technical Structure
FvG Zone (4,107 USD): newly formed balance zone – acts as the main BUY Zone, where price reactions can be observed for quick scalping opportunities.
Break Structure: confirms active buying flow after a series of CHoCH, shifting short-term bias to bullish.
Target Expansion: the 4,188 → 4,228 USD range is an extended resistance band, coinciding with Fibonacci 1.272–1.618.
💎 Key Levels
🟢 Main Support (Support Zones):
• 4,067 USD – technical balance bottom, the last defense zone.
• 4,084 USD – secondary support, confluence with Fibo 0.382.
• 4,107 USD – main FvG zone, monitor reaction for buy scalp.
• 4,131 USD – dynamic support in the recovery cycle.
🔴 Resistance (Resistance Zones):
• 4,155 – 4,165 USD → intermediate resistance zone, potential short-term profit-taking when price reacts.
• 4,188 USD → confluence with Fibo 1.272 – short-term SELL Zone.
• 4,203 – 4,211 USD → extended supply zone, monitor reaction before the US session.
• 4,228 USD → extended resistance, the final target of the current uptrend.
🎯 Market Outlook
1️⃣ Priority Scenario:
– Price may retest the FvG zone – 4,107 USD, then bounce to test resistances 4,155 → 4,188 → 4,228.
– Prioritize monitoring reactions – quick scalping at resistance zones, avoid holding long positions as price approaches 4,211–4,228.
2️⃣ Alternative Scenario:
– If price closes below 4,107 USD, it may reopen the lower balance zone around 4,067 USD.
🧠 Analyst’s View
The market structure leans towards bullish continuation, but the upper zone is approaching a dense resistance cluster – suitable for reactive trading strategies:
→ Observe reactions at each zone to "scalp with the flow," rather than trying to hold the trend.
As long as price maintains above 4,107 USD, the priority remains buy-the-dip – take-profit-on-resistance.
🛡️ Risk Note
Short-term volatility is expanding – clear candle reaction confirmation is needed before taking action.
Analysis is for technical and educational purposes, not investment advice.

4100 Zone Protected: Eyes Now on the Symmetrical Trendline📌 Yesterday’s Outlook – What Happened
In my yesterday's analysis, I highlighted that Gold turned bullish the moment price broke above resistance, shifting the entire short-term structure in favor of the buyers. I also mentioned that 4100–4110 is the key zone where bulls should stay active.
During yesterday’s session, the market validated this view:
🔹 Price dipped into 4100–4110 three separate times,
🔹 Each dip was defended aggressively,
🔹 And eventually Gold pushed into a new intraday high.
This shows clear buyer interest and confirms that the zone is currently acting as strong demand.
❓ Key Question Today
Has Gold built enough momentum to break the falling trendline of the symmetrical triangle that started from the all-time high?
This trendline is the major short-term decision area. What happens here will set the tone for the next leg.
📉 Why the Trendline Matters & What Comes Next
Gold is now pressing directly into the falling trendline of the larger symmetrical triangle structure.
This zone is crucial because:
1. It’s the first major dynamic resistance since ATH.
2. A break above it would CLEARLY shift the medium-term bias back in favor of the bulls.
3. Momentum is building — dips are being bought with consistency.
4. Buyers have defended yesterday’s lows multiple times.
If the trendline breaks cleanly, the door opens toward the 4250 zone.
That’s the next logical magnet for price.
📈 Trading Plan – Still a “Buy-the-Dip” Market
As long as yesterday’s lows remain intact, the structure stays bullish.
🟢 Smart play: Buy dips into intraday support levels
🔒 Invalidation: A break below yesterday's low
🎯 Upside focus: Trendline break → 4250
Until the market shows a reason to flip, momentum is in favor of the bulls.
🚀 Let’s see if Gold has the strength to break that trendline today.

Gold: Bullish OscillationGold traded volatilely with a bullish bias today. Fueled by Fed rate cut expectations and geopolitical risks, its price fluctuated in a high range, held back by key resistance levels, with bulls and bears temporarily balanced.
On the Resistance side, the 4170 is strongly resistant. The 4170 level, a recent high from the prior session, remains unbroken despite repeated attacks. Its breakthrough will determine short - term upward room; breaking it will make 4180-4200 the next core resistance.
On the Support side, the first support is 4120 - 4130, a former key consolidation platform and the level where prices stabilized after today’s pullback. The second support is 4110, near the 5 - day and 10 - day moving average support on the daily chart. Holding it will sustain the short - term strength.
Short - term outlook: No heavy volume drop or breakdown signals. It will likely stay volatile and strong. A breakout above 4170 may drive it to the 4200 round number. Pressure around 4180 could trigger a pullback or even a return to a downtrend.
Buy 4120 - 4130
SL 4105
TP 4160 - 4170 - 4180
Sell 4165 - 4175
SL 4180
TP 4130 - 4120 - 4110

XAU/USD Price Outlook – Trade Setup📊 Technical Structure
OANDA:XAUUSD Gold (XAU/USD) is holding firm near recent highs after repeatedly defending the 4,127–4,134 support zone, keeping the broader bullish structure intact. Price remains above short-term trend support, and momentum readings show buyers maintaining control.
The chart presents a clean bullish continuation setup:
Support zone: 4,127 – 4,134
Resistance zone / target area: 4,167 – 4,174
As long as price holds above 4,125, dips into support are likely to attract renewed buying, with upside potential back toward the 4,170+ resistance band. A decisive break and close below 4,125 would invalidate the bullish scenario and expose the 4,110 – 4,095 area.
🎯 Trade Setup
Idea: Buy dips into support, targeting a move back into the 4,170 resistance zone.
Entry: 4,127 – 4,134
Stop Loss: 4,125
Take Profit 1: 4,167
Take Profit 2: 4,175
Risk–Reward Ratio: ≈ 1 : 3.66
Bias stays constructively bullish while price holds above 4,127–4,134 on a closing basis.
A clean break below 4,125 would warn that the bullish structure is weakening.
🌐 Macro Background
According to FXStreet, gold regained positive momentum as traders increased bets on a December Fed rate cut following cooling US PPI data. Several Fed officials — including John Williams, Christopher Waller, and Stephen Miran — expressed support for further easing, which pushed the USD to a one-week low, benefiting the non-yielding metal.
US Data:
PPI eased further, supporting the disinflation trend.
Retail Sales slowed to 0.2%, below expectations.
Consumer Confidence fell to a seven-month low.
Federal Reserve:
Markets now price in an 85% probability of a December rate cut.
Lower US yields and a softer USD continue to support gold.
Geopolitical factors:
Hopes for a Russia–Ukraine peace framework improved risk sentiment, limiting safe-haven inflows but not enough to shift gold’s underlying bullish bias.
Overall, weaker USD conditions, dovish Fed expectations, and cooling inflation favour buying gold on dips, though improving global sentiment may limit the speed of upside moves near resistance.
🔑 Key Technical Levels
Resistance zone: 4,167 – 4,175
Support zone: 4,127 – 4,134
Invalidation level (bulls): 4,125 (close below)
📌 Trade Summary
Gold remains in a constructively bullish structure, with buyers defending the 4,127–4,134 support band. As long as this zone holds, the setup favours buying dips toward support and targeting the 4,167–4,175 resistance zone where prior supply may re-emerge. Traders should stay alert to upcoming US data releases and comments from key Fed officials, as these events may influence USD direction and short-term gold volatility.
⚠️ Disclaimer
This analysis is for reference only and does not constitute trading advice. Trading involves significant risk, and proper risk management is essential.

Gold Holds Near 2-Week Highs as USD Softens Ahead of Fed CutsGold continues to trade firmly near recent highs as the USD weakens amid growing expectations of a Fed rate cut in December.
The earlier pullback was mostly driven by stronger risk appetite in equities, not by gold weakness itself — meaning the macro bullish backdrop remains intact.
With markets now pricing:
76% chance of a December rate cut,
and almost 90 bps of cuts by end-2026,
the broader environment continues to favour upside on dips.
📊 Technical Outlook – MMF Style (H1/H2)
Price has respected the ascending trendline drawn from the early-week swing low and is now pushing above the 0.618–0.786 retracement zone.
Key Levels
BUY Zone 1: 4,132 – 4,149 (Fibo 0.382–0.618 + demand)
BUY Zone 2: Trendline retest area
Target Zone: 4,188 – 4,195 (1.272–1.618 Fibo extension)
Structure is currently bullish, with clear higher highs and higher lows.
A retracement into 4,14x before continuation higher is the most probable scenario.
🎯 MMF Trading Plan (Intraday)
Primary Setup – BUY Dip Continuation
BUY: 4,132 – 4,149
SL: 4,121
TP:
→ 4,168
→ 4,185
→ 4,192 – major extension target
Alternative Scenario – Break & Hold Above 4,170
If price consolidates above 4,170, expect a direct push toward 4,19x without a deep pullback.
Bearish Scenario (Low probability for now)
Only valid if price breaks below trendline + closes under 4,128.
Target would be a deeper correction toward 4,10x — but this is not the base case.
🧠 MMF View
Gold’s structure + macro narrative → bullish trend intact.
The market is clearly positioning ahead of possible December policy easing — dips into 4,13x–4,14x remain attractive opportunities.
“In a rate-cut environment, gold tends to trend — the only task is to buy from strength, not chase.”

XAU/USD: Gold Bullish, Watch for Pullback to 4,150-4,130⏰ Timeframe: 30m
📅 Update: 26/11/2025
🔍 Market Context
After a strong upward trend and breaking the resistance zone of 4,096 USD, gold enters a technical correction phase to reaccumulate liquidity.
The price is currently fluctuating around the 4,150 USD area, serving as a crucial pivot to confirm whether the bullish structure will continue or require a deeper retracement.
📊 Technical Structure
4,150 USD (Mid Support): quick reaction zone, potential for short-term buy orders (scalp).
OB (4,130 USD): priority BUY Zone, confluence with 0.5 Fibo – main rebalancing area.
Support Base (4,096 USD): Break–Resistance zone, maintaining the medium-term bullish trend structure.
Target Expansion: 4,181 → 4,202 → 4,211 → 4,235 – 4,242 USD.
💎 Key Levels
🟢 Support Zones:
• 4,096 USD – main structural base.
• 4,130 USD – main OB (priority BUY).
• 4,150 USD – intraday pivot, quick reaction for scalping.
🔴 Resistance Zones:
• 4,181 USD – short-term resistance.
• 4,202 USD – intermediate balancing zone.
• 4,211 USD – expansion zone (1.272 Fibo).
• 4,235 – 4,242 USD – extended supply zone (1.618), prone to profit-taking reactions.
🎯 Market Outlook
1️⃣ Priority Scenario:
– Price lightly pulls back to the 4,150 USD area, potential for quick reaction.
– If it breaks through 4,150, the 4,130 USD (OB) zone will be the balancing point for a stronger recovery.
– Expansion targets: 4,181 → 4,211 → 4,242 USD.
2️⃣ Secondary Scenario:
– If the price breaks below 4,096 USD, the short-term bullish structure becomes invalid, shifting to a neutral state.
🧠 Analyst’s View
4,150 USD is the "stepping stone" between the OB zone and short-term resistance – where the market decides to continue or accumulate deeper.
A reasonable strategy is to monitor quick reactions at 4,150 (scalp) and prioritize clear buy opportunities at 4,130 (OB) if the price retraces deeply.
🛡️ Risk Note
The market is rebalancing within an uptrend – avoid hasty actions without clear candle or cash flow confirmation.
Analysis is technical & educational, not investment advice.

Gold price analysis November 26📌 XAUUSD – Bullish Momentum Still Dominant
In the last two sessions, gold has maintained a fairly coherent bullish wave structure. After breaking the 4100 threshold, the market has returned to test the newly formed support zone at 4111 and responded positively. This shows that the buyers are still in control of the trend and expectations for an extension of the bullish momentum are still intact.
The price is currently approaching the important milestones above, with the psychological zone of 4200 as the short-term target. If the buying pressure continues to maintain well, the market could head straight to 4250 in the next uptrend.
🎯 Recommended trading plan
BUY priority according to the main trend
BUY around 415x
BUY DCA when the price breaks and holds above 4203
Target to take profit: 4250
⚠️ Risk management
If the price closes below 4111, the bullish structure is broken →
👉 Switch priority to short-term SELL according to the correction.

XAU/USD: Gold Bullish, Waiting for Perfect Buy Pullback📊 Market Structure
Gold is maintaining a strong bullish structure after a series of BoS from the bottom region. The most recent rally broke the 4,130 mark and continues to hold above the small OB area, indicating that the BUY side is still in control.
Currently, the price is slightly retracing to retest the structure — the target is to test the area:
• OB 4,130 – 4,126 USD
• Or deeper to FVG 4,104 – 4,089 USD
In both cases, these are discount areas to continue BUYING according to the main trend.
The larger trend still targets the upper liquidity levels including:
• 4,151
• 4,181
• 4,207
• 4,243
💎 Key Technical Zones
• OB Retest Zone: 4,130 – 4,126 (quick bounce area)
• FVG Zone: 4,104 – 4,089 (best discount area to BUY)
• Large Bearish OB: 4,045 – 4,060 (final area if price adjusts deeply)
• Target Zones: 4,151 – 4,181 – 4,207 – 4,243
🎯 Trading Plan – BUY (priority)
1️⃣ BUY 1 – Retest OB 4,130
• Entry: 4,126 – 4,131
• SL: below 4,115
• TP1: 4,151
• TP2: 4,181
• TP3: 4,207
• TP4: 4,243
→ This is a quick setup – for a short retracement before continuing.
2️⃣ BUY 2 – FVG 4,104 – 4,089 (best)
• Entry: 4,089 – 4,104
• SL: 4,070
• TP1: 4,151
• TP2: 4,181
• TP3: 4,207
• TP4: 4,243
→ This FVG area is a strong confluence: fibo, small demand, and trendline.
3️⃣ BUY 3 – OB Bearish shift (deep entry)
• Entry: 4,045 – 4,060
• SL: 4,020
• TP1: 4,104
• TP2: 4,151
• TP3: 4,207
→ Only activate when the market shakes strongly, but RR is extremely good.
🎯 SELL Scalp (secondary – only short trades)
Only SELL when the price reaches strong resistance areas and rejection signals appear:
• 4,151
• 4,181
• 4,207
• 4,243
Entry SELL: only enter when there is H1 rejection
SL: 10–15 USD
TP: back to 4,151 → 4,130
→ This is counter-trend, not a priority setup.
🧠 Vincent’s View
The overall trend is still bullish. The current retracements are just a “breathing phase” – the market is accumulating energy to continue pushing up to higher liquidity areas.
As long as the price stays above 4,089 – the bullish trend is not threatened.
“Smart Money buys the dip — Retail buys the breakout.” ⚜️
⏰ Timeframe: 1H
✍️ Analysis by: Captain Vincent

11.26Asian early-session short-selling plan for goldI. Current Market Status (Key Data from the Chart)
Current price: 4,151.35
Key levels (from chart):
Immediate resistance: 4,154.439 (0.886 retracement)
Nearby support: 4,142.719 (0.5 retracement), 4,139.169 (0.382 retracement)
RSI: 65.6 (entering overbought territory)
II. Updated Short-Selling Plan
1. Entry Zones (Aligned with Current Price Action)
Primary Entry Zone: 4,154–4,157Target the 0.886 retracement level (4,154.439) as immediate resistance.
Enter a short position if the price rallies to 4,154–4,157 and shows hourly bearish reversal signals (e.g., a rejection candlestick, shrinking volume).
Alternative Entry Zone: 4,158–4,160If bulls push above 4,157, wait for a test of 4,158–4,160 (near the 1.0 extension level of 4,157.892).
Enter a supplementary short position only if momentum weakens (no follow-through buying).
2. Profit Targets (Tied to Chart Support Levels)
For the entry zone of 4,154–4,157:The primary profit target is 4,142–4,143 (aligned with the 0.5 retracement level), and the secondary target is 4,139–4,140 (the 0.382 retracement level). When the price hits the primary target, reduce 50% of your position; then move the stop-loss of the remaining shares to your entry price to lock in a break-even level.
For the entry zone of 4,158–4,160:The primary profit target is 4,145–4,146, and the secondary target is 4,142–4,143. If the price drops quickly to the primary target, hold a portion of your position to aim for the secondary target; if the price stalls at support levels, exit the position entirely.
3. Stop-Loss Rules (Risk Control)
For entries at 4,154–4,157: Set stop-loss at 4,162 (above the 1.0 extension level, avoiding false breakout sweeps).
For entries at 4,158–4,160: Set stop-loss at 4,165 (to limit losses if bullish momentum accelerates).
4. Exit Rules
If price breaks below 4,139 (0.382 retracement) and closes hourly below it: Extend target to 4,130–4,132 (near EMA support).
If price hits the stop-loss level: Close the position immediately (signals stronger-than-expected bullish momentum).
GOOD LUCK!
LESS IS MORE!

Gold Attempts to Hold Above $4,000 per OunceOver the past five trading sessions, XAU/USD has maintained a gain of more than 1.4%, as the precious metal has temporarily regained confidence following a more moderate tone from the Federal Reserve regarding interest rates. The U.S. bond market has not seen significant increases in yields in recent sessions, which has allowed gold—often viewed as a natural substitute for bonds—to recover some short-term demand. If the price manages to hold above the $4,000 zone, buying pressure could once again become dominant in the coming sessions.
Uptrend Remains Intact
Since late August, gold has maintained a solid upward trendline, and despite recent pullbacks, the bullish bias continues to prevail in the short term. There is still no meaningful selling pressure capable of breaking this trendline, making it the key technical structure to monitor in the coming sessions, especially if the price stays above the 50-period moving average.
RSI
The RSI line continues to oscillate around the 50 level, indicating the emergence of a neutral bias and reflecting balanced momentum across the last 14 sessions. As long as this pattern continues, indecision is likely to remain present in gold’s short-term price behavior.
MACD
The MACD histogram is also oscillating around the neutral zero line, reinforcing a scenario of technical neutrality in the short-term moving averages. If this continues, a short-term consolidation range could begin to take shape.
Key Levels to Watch
$4,300 – Major Resistance: This level corresponds to the chart’s highs. A move back toward this zone could reactivate a strong bullish bias and reinforce the current upward trend, allowing buying pressure to regain dominance.
$4,140 – Immediate Barrier: This level aligns with recent retracements and the 23.6% Fibonacci level. If the price continues oscillating around this zone, a short-term range may form due to the recent lack of directional strength.
$3,920 – Key Support: The most relevant short-term support, located just below the 50-period moving average and the 38.2% Fibonacci level. A breakdown below this zone could endanger the current uptrend and give way to a more dominant bearish bias.
Written by Julian Pineda, CFA, CMT – Market Analyst

Bulls remain clearly bullish on gold.#XAUUSD OANDA:XAUUSD TVC:GOLD
Good morning. Gold prices surged yesterday due to external stimuli, and this trend continued today, reaching a high of around 4155. From a daily chart perspective, gold prices remain above the 5-day and 10-day moving averages. Considering the unstable geopolitical situation and the increased probability of an interest rate cut in December, as long as prices do not fall below 4100, the bullish trend will continue. Consider going long on gold if it pulls back to 4125-4115.
