XAUUSD - buy gold now...XAUUSD was recently in a short term downtrend for a few weeks but has now shown some clear bullish movements ahead. XAUUSD (Gold) has broken out of a downward trend channel that was acting as strong resistance, The price is very likely to head to the next strong resistance level which is marked as the take profit zone (green line). Time to buy GOLD now!
Xauusdupdates

XAU/USD – Recovery structure testing 4,239 – 4,2611. Market Context
On the M30 timeframe, the previous downtrend has started to weaken. The price has formed a series of Equal Lows patterns, indicating that the short-term bottom is protected, followed by a Change of Character (ChoCH) and a slight Break of Structure (BOS). This reflects that the selling pressure has decreased in intensity and the market is transitioning into an accumulation phase, preparing for a recovery.
The downtrend line is still valid, but the price is approaching the breakout area. Closing candles above this line will confirm a phase transition.
2. Key Price Areas
Upper Supply Zone
4,239 – 4,240: the nearest strong reaction area, acting as the main resistance.
4,261: coincides with the 1.272 Fibonacci of the correction wave, a notable liquidity area.
4,282 – 4,283: expansion target, corresponding to Fibonacci 1.618.
These areas will be points where the market may show counter-reactions during the uptrend.
Lower Demand Zone
4,168 – 4,154: the Demand Zone formed from the previous strong reversal. This is the area where the market effectively absorbed selling pressure and may continue to act as support during corrections.
3. Fibo and Price Action
The current uptrend is following a standard pullback structure: from the 4,168 bottom, the price recovers to Fibonacci levels like 0.236 – 0.382, then forms a small correction before approaching the downtrend line again.
If the price surpasses the trendline, the next targets will be:
4,213 (Fibo 0.618),
then the main supply zone 4,239 – 4,240.
Closing candles above this area will pave the way for the next targets at 4,261 and 4,282.
4. Trading Plan
Buy Scenario – prioritize during correction
Early buy position: 4,188 – 4,195
(retest small structure and trendline)
Optimal buy zone: 4,168 – 4,154
(Demand Zone + deep Fibo correction)
Stop loss: below 4,150
Targets:
4,213
4,239 – 4,240
4,261
expanding to 4,282
Short-term Sell Scalp Scenario
Reaction zone: 4,227 – 4,230
(near resistance + 0.786 Fibo)
Stop loss: 4,236
Target: 4,205 – 4,195
Note: This is only a short-term strategy, not the main trend.
5. Summary
• The market structure is transitioning from a downtrend to an accumulation – recovery phase.
• If the price surpasses and holds above the trendline, the nearest target will be 4,239 – 4,240.
• The supply zones 4,239 – 4,261 – 4,282 will play a decisive role in the next uptrend.
• The most effective trading strategy remains to wait for a buy during corrections to the strong support zone 4,168 – 4,154.

[WEEKLY] ANFIBO | Gold XAUUSD - Purple or Gray? [11.24 - 11.28]Hi guys, Anfibo’s here!
XAUUSD Weekly Trading Plan
Overall Picture:
OANDA:XAUUSD is entering a critical phase as price continues to consolidate within a tightening structure, signaling that a major directional move is likely to occur next week. After a period of strong volatility, the market is now compressing energy between the upper and lower boundaries of the current range. This setup is textbook for a break–retest–continuation model, and that’s exactly why my strategy for the upcoming week revolves around two clear scenarios: the “purple arrow” plan and the “grey arrow” plan.
The market will reveal its next major direction once either the upper boundary is broken or the lower boundary gives way. Until that happens, there is no reason to pre-commit to a biased direction — we trade what price confirms, not what we predict.
Trading Plan for Next Week:
We will react based on breakout confirmation:
>>> Scenario #1: Break ABOVE the range – Follow the “Purple Arrow” plan (BUY)
If gold pushes through the upper boundary with strength and confirms a retest, we will switch to a bullish continuation plan.
Key Resistance Levels to Watch: 4147, 4243, 4340, 4356, 4377.
A clean break above structure opens the path back into macro bullish territory, where gold may attempt to revisit or even surpass recent highs.
>>> Scenario 2: Break BELOW the range – Follow the “Grey Arrow” plan (SELL)
Once price breaks and retests the lower boundary, we will look for sell setups targeting the ladder of support levels outlined below.
Key Support Levels to Watch: 4000, 3917, 3890, 3862, 3820, 3793, 3760
A bearish breakout from the range could trigger a multi-wave continuation pattern, giving us multiple opportunities to scale in according to structure.
Risk Management:
Trade only after confirmed breakouts — avoid guessing tops and bottoms.
Keep tight SLs on retests to avoid liquidity hunts common during range boundaries.
Maintain Risk:Reward ≥ 1:2 across all setups.
Prioritize clean structure; avoid trading inside the choppy middle zone of the range.
Reassess bias immediately if the breakout fails or re-enters the range.
Conclusion:
Next week’s market will be all about patience and reaction, not prediction. With gold coiling tightly, a breakout is imminent, and both the “purple arrow” (bullish) and “grey arrow” (bearish) plans give us a clear and disciplined roadmap. Whether price breaks upward or downward, we already know exactly where our key levels are and how we will execute. Stick to structure, wait for confirmation, and let the market choose the direction for us.
HAVE A POWERFUL NEW WEEK, GUYS!

GOLD Buying Trade idea From the Support LevelHello Traders
In This Chart GOLD HOURLY Forex Forecast By FOREX PLANET
today Gold analysis 👆
🟢This Chart includes_ (GOLD market update)
🟢What is The Next Opportunity on GOLD Market
🟢how to Enter to the Valid Entry With Assurance Profit
This CHART is For Trader's that Want to Improve Their Technical Analysis Skills and Their Trading By Understanding How To Analyze The Market Using Multiple Timeframes and Understanding The Bigger Picture on the Charts
XAUUSD Retesting Trendline Support AreaGold is currently retesting a rising trendline near a key horizontal zone. The market has reacted to this level multiple times in the past, making it an important area to watch.
If price fails to maintain support above this structure, a deeper pullback toward the lower range could develop. On the other hand, a clear rejection and hold above the trendline may keep price within the current bullish framework.

XAUUSD: Buy low and sell high within the 4230-4160 rangeToday is Wednesday, and whether gold can extend its upward move will depend on a key speech as well as the upcoming ADP employment report. With the absence of the NFP release this month, the ADP report has gained additional importance and is expected to exert a stronger-than-usual market impact.
Yesterday, gold broke below the $4,200 level twice but ultimately closed back above it. During the Asian session today, prices attempted another rally, but encountered resistance near $4,230, suggesting technical pressure at that level. Bullish momentum is weakening, and previously elevated sentiment has become more cautious.
Gold’s current two-way volatility is mainly driven by two factors:
The expected Fed rate cut:
Markets believe the upcoming rate cut may be a hawkish cut, which would offer limited support for gold.
The nomination of the next Federal Reserve Chair:
Trump hinted that Kevin Hassett may be the nominee. Given Hassett’s dovish stance and support for rate cuts, his appointment would be positive for gold and U.S. equities.
However, based on today’s market reaction so far, investors appear unconvinced.
If Trump explicitly confirms Hassett as the nominee, gold could receive stronger upside support.
In my view, before the ADP release and any formal confirmation of the next Fed Chair, gold is likely to remain range-bound between $4,230 and $4,160.
Short positions can be considered near the $4,230 resistance zone
Long positions can be considered near the $4,160 support zone
Once gold breaks out of this range, we will formulate a new trading plan accordingly.

The expectation of interest rate cuts remains the core support.#XAUUSD TVC:GOLD OANDA:XAUUSD
✅ From the daily chart, gold prices are still above the MA5 and MA10. A prudent approach is to wait for a pullback to buy, or continue to use a buy-low-sell-high strategy until key resistance is broken. With the moving averages rising, the first support level to watch today is 4205-4195. If the price finds support and stabilizes in this area and strengthens again, the first resistance level to watch is the 4260-4270 area. This level represents both the previous high and a key level determining whether gold can hold above the 4300 mark.
✅ It is worth noting that if the price breaks below the support range of 4205-4195, it may retest the 4160-4140 area. It is particularly important to note that repeated testing of the same support level often signals weakness, and a cautious approach is necessary.

Elise | XAUUSD 2H — Liquidity Sweep + Retest SetupOANDA:XAUUSD
After sweeping liquidity at every breakout stage, XAUUSD formed clear consolidation boxes acting as accumulation zones. Each breakout has been followed by a retest, confirming continuation. The current move has broken above liquidity pivot zone highs, and price is now expected to retest the level at 4165–4175 before continuation toward major liquidity above.
Key Scenarios
🚀 Bullish Case (Primary Bias)
If price retests and holds 4165–4175 zone:
🎯 Target 1: 4235–4250
🎯 Target 2 (Final): 4310–4350 liquidity zone
Expect sweep of equal highs followed by continuation.
📉 Bearish Case (Invalidation)
Break and close below 4110–4125 zone would weaken bullish structure and potentially send price back toward the lower range zone.
Current Levels to Watch
Retest Buy Zone: 4165–4175
Support Range: 4110–4125
Liquidity Targets: 4235 → 4310+
⚠️ Disclaimer: This analysis is for educational purposes only. Not financial advice.

XAU/USD – Waiting for 4,203 Retest Before the Next Bullish Leg(MMF Intraday Plan – Dec 03)
Gold continues to recover after last week’s deep drop, but the current bullish momentum is still weak and needs a liquidity sweep + clean pullback before pushing higher.
On the M30–H1 structure, price is still moving below the descending trendline, suggesting that Gold may need a deeper retest into the 4,203 demand zone—the key area where:
✔️ Fibo 0.618 of the latest impulse
✔️ Previous demand that created strong bullish displacement
✔️ Liquidity resting below the recent short-term lows
✔️ The higher-low (HL) structure of the bullish wave
Once this zone holds, Gold is positioned for the next expansion upward.
🧭 Primary Scenario – MMF BUY Setup
BUY Zone: 4,203 – 4,205
Stop-Loss: below 4,197
TP1: 4,230
TP2: 4,242 (major target – supply zone + Fibo 1.272)
If price breaks above 4,242 with momentum → next bullish extension targets 4,249–4,252.
⚠️ Secondary Scenario (Scalp SELL only)
Short-term scalp, not part of the main trend plan:
SELL Reaction Zone: 4,230 – 4,232
Stop-Loss: 4,236
TP: 4,215
Use this only as a quick reaction trade while the trend waits for confirmation.
📌 Daily Bias Summary
Intraday bias remains BULLISH while price holds above 4,197.
Best setup today: wait for a clean pullback into 4,203 for the main BUY.
Expect volatility during NY session due to upcoming data → manage positions carefully.

XAU/USD – Top Sweep Completed, Price Now Distributing Inside the📊 Market Structure
• After a strong bullish leg, Gold formed a clear Liquidity Sweep at the highs around 4,261 USD (Fibo Sell) , taking out all liquidity above that zone.
• From that high, price gradually weakened and printed a bearish ChoCH (loss of buying pressure; short-term structure no longer clean).
• Price is currently trading inside the premium zone between 4,190 – 4,241:
– 4,241 = Fibo Sell / liquidity extreme .
– 4,225 – 4,216 = lower premium zone , likely to react before retesting the highs.
– 4,190 = Liquidity Sweep + short-term support : only if price breaks below and retests from underneath will this zone flip into resistance for SELL continuation.
⇒ Current picture: short-term bearish bias , but sells should come from the premium zones (4,216–4,241) or only after a confirmed break of 4,190 — avoid chasing mid-range.
💎 Key Technical Zones
• Fibo Sell Zone: around 4,241.451 → optimal extreme for hunting SELL setups.
• Reaction Levels:
– 4,225.474
– 4,216.171
• Liquidity Sweep Support: 4,190.485 → main short-term support.
• Support / TP Zones:
– 4,163.586
– 4,155.294 (old OB)
– 4,142.755
– 4,116.058 (deeper low – extended target)
🎯 Trading Plan – SELL Priority From Premium
1️⃣ Primary SELL – Fibo Sell 4,241 & Premium 4,225–4,232
Ideal scenario: price retraces into the upper premium zone and prints a clear rejection signal (pin bar / engulfing / rejection volume).
• Entry 1: 4,225 – 4,232 (first scale-in)
• Entry 2: 4,235 – 4,241 (add if price sweeps higher)
• Stop Loss: above 4,250
• TP1: 4,190
• TP2: 4,163
• TP3: 4,155
• TP4: 4,142
• TP5: 4,116
→ Classic “sell the premium” setup: wait for price to return to the swept highs — avoid FOMO in the middle.
2️⃣ SELL Continuation – After Breaking 4,190
Only valid if we get a clear H1 close below 4,190 , confirming the Liquidity Sweep zone has been violated and flipped into resistance.
• Condition: H1 close below 4,190 → wait for a retest of 4,190–4,195 from underneath
• Entry: 4,190 – 4,195
• SL: above 4,205
• TP1: 4,163
• TP2: 4,155
• TP3: 4,142
• TP4: 4,116
→ This setup is only for traders who prefer clean continuation after a confirmed break of support.
3️⃣ Countertrend BUY – Only From Deep Zones
• Aggressive: watch for reactions at 4,163 – 4,155 . If strong rejection appears, consider a technical BUY retracement toward 4,190 – 4,216 (scalp).
• Conservative: wait for a deep test of 4,116 (stronger demand zone) before searching for BUY setups.
→ This is strictly countertrend; only take it if strong confirmation appears. Otherwise, skip and focus on SELL opportunities in premium zones.
🧠 Vincent’s View
Gold is currently “hanging” within premium after a very clean top sweep.
The safest strategy is to let price return to 4,225–4,241 before selling, or wait for a confirmed break of 4,190 to play continuation. Avoid selling directly at 4,190 while it still acts as support.
“Sell the premium, respect the levels – liquidity never lies.” ⚜️
⏰ Timeframe: 1H
📅 Updated: 02/12/2025
✍️ Analysis by: Captain Vincent

Key-Resistance Liquidity Grab → FVG ShortIdea:
Price has reached a key resistance zone — a common place where smart money or institutions may hunt liquidity (stop-losses above resistance before reversing).
There is an unfilled Fair Value Gap (FVG) / imbalance zone drawn below (green “POI / FVG” zone). In price-action trading, these FVGs often act like magnets: after a rapid move, price tends to retrace and “fill” the gap.
The plan: wait for a rejection at resistance (signaling liquidity grab is done), then short — target the FVG/POI zone where the market may come back to fill imbalance.
🎯 Trade Plan (Entry / Exit / Risk-Reward)
Parameter Plan
Entry After a bearish rejection (e.g. long upper-wick candle) near the resistance zone.
Stop-Loss Slightly above the resistance / recent swing high (to avoid being stopped by a false breakout).
Take-Profit (TP) Around / within the FVG / POI zone (green zone on chart) — where imbalance may be filled.
Risk–Reward Aim for at least 1 : 2 — ideally more, depending on how far the FVG is below resistance.
⚠️ What Makes This Setup Valid (and What to Watch)
FVGs mark market inefficiencies / liquidity gaps created by rapid moves, which often get revisited.
A reversal or rejection at a well-defined resistance zone gives signal that the liquidity hunt may be done and a move downward may begin.
But — if price breaks cleanly and strongly above the resistance (with momentum), the short trade becomes invalid.
Also, FVGs don’t always get filled. Entry should ideally wait for a clear rejection or confirmation, not just assume a fill.

Gold Aiming for 4300? Watch U.S. PMI and ADP DataYesterday, gold once again showed a roller-coaster pattern—high-level consolidation, a pullback downward, yet still maintaining strong resilience near the highs. During the U.S. session, it fell to around 4163, but the late session recovered the losses strongly. If gold continues to hold this kind of structure, we may see the daily chart gradually shift into a rising consolidation, bringing the market back to a bull-dominant phase.
Although gold faces short-term profit-taking pressure, multiple factors—including Fed rate-cut expectations, strong central-bank buying, falling U.S. yields, a weaker dollar, and ongoing geopolitical uncertainty—continue to support the upside breakout. Looking ahead, the 5000 target may not be unrealistic. Keep a close eye on the Federal Reserve and upcoming key economic data.
Today, on rebounds, continue to watch the 4236–4245 and 4265 resistance zones; if price approaches but fails to break, consider light short positions. On pullbacks, first monitor 4211–4193, and if that breaks, watch the 4176–4163 support levels.
Price action remains highly repetitive at the moment. Short-term movement shows high-level choppy consolidation with repeated spikes and pullbacks. Maintain your rhythm—avoid chasing trades, and pay attention to disciplined execution.
Yesterday’s public plan was to buy near 4200, short around 4230, then buy again below 4178 and close at 4187, waiting for another dip to re-enter. However, the market turned strong, so we chased lightly in the 4187–4180 area and are still holding. If resistance near 4245 fails to break, the long positions will be closed, and we will shift to short trades.
Therefore, today’s trading plan is:
Sell above 4240
Buy below 4200
XAUUSD(GOLD) HIGH PROBABILITY LONG SETUP SOON!!!🚨 XAUUSD HIGH PROBABILITY BUY SETUP 🚨
* Here We Can See Clearly The Next Potential Moves For GOLD Coming Hours/Days.
* Keep Your Eyes Close On Your Trading Positions.
* Happy PIP Hunting Traders.
FXKILLA.

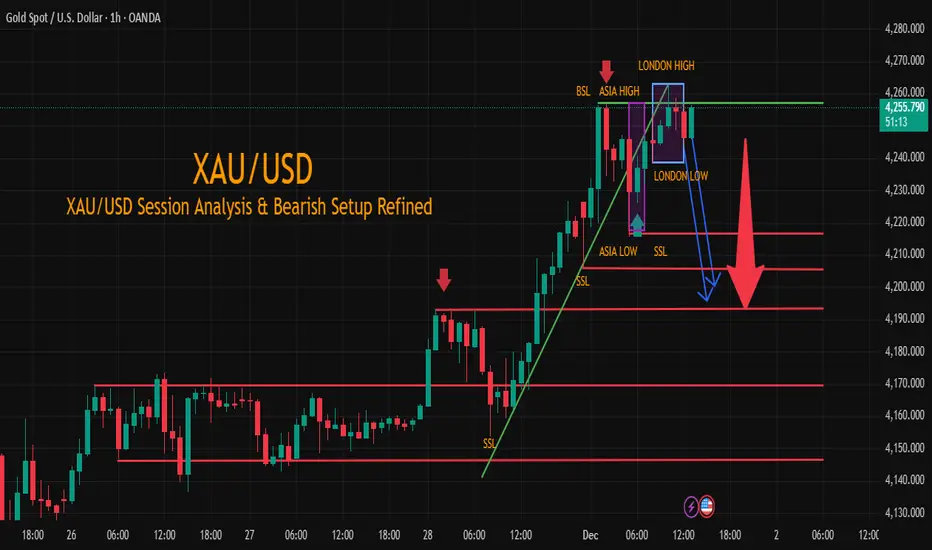
XAU/USD BSL Swept Liquidity Grab Confirms and wait for SSL.The bullish momentum in Gold (XAU/USD) has hit a major wall! On the 1-hour chart, we witnessed a classic Buy Side Liquidity (BSL) sweep as the price briefly moved above the Asia High and tagged $4,260, forming the definitive London High. This liquidity grab confirms the initiation of a high-probability reversal setup.
XAU/USD – Buy Setup from Liquidity Sweep & Fibo 0.618📌 Structure Overview
• After a short-term bearish leg, price formed a sequence of ChoCH → BoS → ChoCH, signalling that selling pressure is losing momentum.
• The liquidity sweep at the 4,183 – 4,185 lows has reactivated buying interest.
• From this newly formed low, price retraced into the bearish OB above and is now correcting based on Fibonacci levels.
Overall structure leans toward accumulation – building a base before a potential recovery move.
🔍 Technical Analysis (SMC + Fibonacci)
• Key OB Zone:
The bearish OB at 4,228 – 4,241 remains a strong supply area — where price reacted on first touch.
• Fibonacci Retracement:
After the impulsive move 4,184 → 4,228, price is correcting toward standard retracement levels:
0.382
0.5
0.618
Notably: 0.618 overlaps with demand + liquidity zone → high reaction probability.
• Current Price Action:
Price is pulling back gently into the BUY zone, without forming new lower lows — confirming that selling pressure is fading.
🎯 Trade Plan – BUY Following Smart Money Flow
🟢 Primary BUY Zone: 4,184 – 4,186
✔ Confluence with Fibo 0.618
✔ Same area as liquidity sweep low
✔ Aligns with the recovery-trend demand zone
Stop Loss: Below 4,170 (clears all remaining liquidity underneath)
Short-Term Targets:
• TP1: 4,228 – first reaction zone
• TP2: 4,241 – bearish OB
• TP3 (extended): 4,256 – 4,258
Alternative Scenario:
If price breaks 4,241 convincingly and closes above it on M30 → bullish continuation is confirmed → extended targets at 4,270 – 4,280.
📌 Important Notes
• Avoid FOMO buying in the middle of the range; wait for demand + Fibo reaction.
• When price reaches 4,228 – 4,241, consider partial profits to protect gains.
• Structure becomes invalid only if price breaks below 4,170.
💬 Conclusion
Short-term bias favours a bullish pullback, with an optimal BUY setup around 4,184 – 4,186. If this zone holds, gold has room to extend its recovery towards 4,241 → 4,256+.

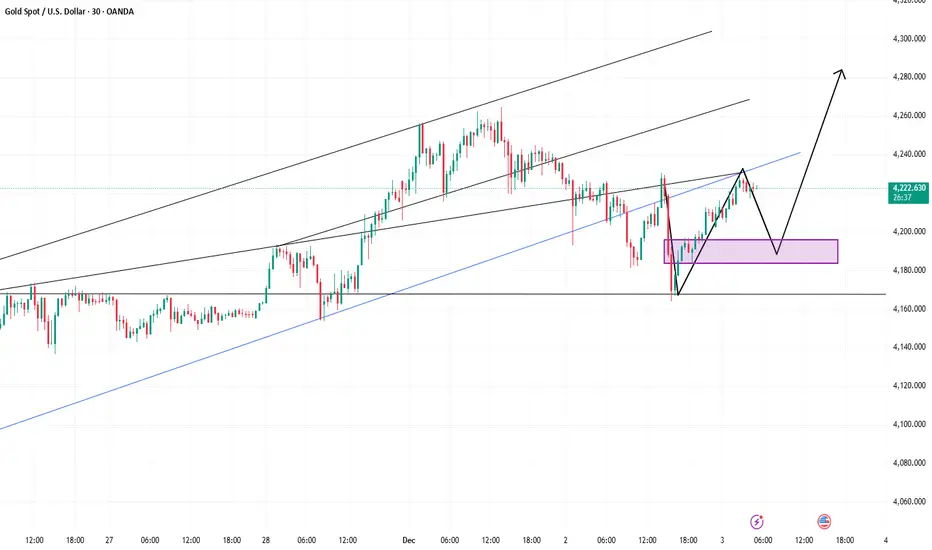
XAU/USD Chart Analysis (30M) I 12/03📊 XAU/USD Chart Analysis (30M)
I. Market Context
Trend/Price Action: The 30-minute chart shows that the price is in a short-term uptrend (indicated by the dashed trendline) after testing the Demand Zone. However, this recent upward move is following a period of consolidation/sideways trading within a broader range.
Current Price Position: The price is hovering around $4,222.90 (based on the latest data on the chart).
Key Volume Profile Levels:
POC (Point of Control): $4,237.547 — The price level with the highest accumulated trading volume, representing the market's "Fair Price."
VAH (Value Area High): $4,252.758 — The upper boundary of the Value Area.
VAL (Value Area Low): $4,212.802 — The lower boundary of the Value Area.
The current price is located above the VAL, suggesting an attempt to break out from the lower portion of the accumulated trading range.
II. Liquidity Zones and Key Levels
The following are the critical price levels and their roles in the current market structure:
Value Area High (VAH) at $4,252.758: This serves as a significant resistance level and a crucial benchmark for confirming a strong continuation of the upward momentum.
Point of Control (POC) at $4,237.547: This level, representing the highest volume traded, acts as the primary psychological/technical resistance and is the most probable target for the current bullish push.
Value Area Low (VAL) at $4,212.802: This is the main support level right now. As long as the price stays above the VAL, the buyers are considered to be in control.
Demand Zone at $4,169.399: This is a strong major support area where significant buying pressure previously emerged and pushed the price higher.
In summary, the VAL ($4,212.802) is the most important short-term dividing line for market control.
III. Trading Scenarios and Plan
Given the context of price recovering from the Demand Zone and holding above the VAL, the primary scenarios are:
🟢 Plan 1: Bullish Continuation Scenario (Long/Buy) - Preferred
Trigger: Price continues to advance from the current position or pulls back slightly and holds firmly above the VAL ($4,212.802).
Entry:
Aggressive: Buy at the current price area (around $4,222) with a tight Stop Loss (SL).
Conservative: Wait for a pullback to the $4,212 - $4,218 area (near the VAL) and look for rejection signals (Pin bar, Engulfing, etc.).
Targets (Take Profit - TP):
TP1: POC ($4,237.547)
TP2: VAH ($4,252.758)
TP3: The higher resistance area of $4,260 - $4,270.
Stop Loss (SL): Place it below the VAL ($4,212.802), perhaps below $4,208, to protect the position if the price re-enters the Value Area.
🔴 Plan 2: Bearish Reversal Scenario (Short/Sell)
Trigger: The price breaks and closes a 30M/1H candle below the VAL ($4,212.802), indicating that sellers have regained control and the price is heading towards the bottom of the Trading Range.
Entry: Sell after the breakout of the VAL and a failed retest from below.
Targets (TP):
TP1: $4,190.00 area
TP2: Towards the Demand Zone ($4,169.399).
Stop Loss (SL): Place it above the VAL, possibly above $4,218.
IV. Summary
The market is currently showing positive recovery signs after finding support at the Demand Zone ($4,169). The most critical price level to watch is the VAL ($4,212.802).
Above $4,212.802 (VAL): Bullish Expectation (Long Bias) with targets toward the POC and VAH.
Below $4,212.802 (VAL): Bearish Expectation (Short Bias) with targets toward the bottom of the trading range.

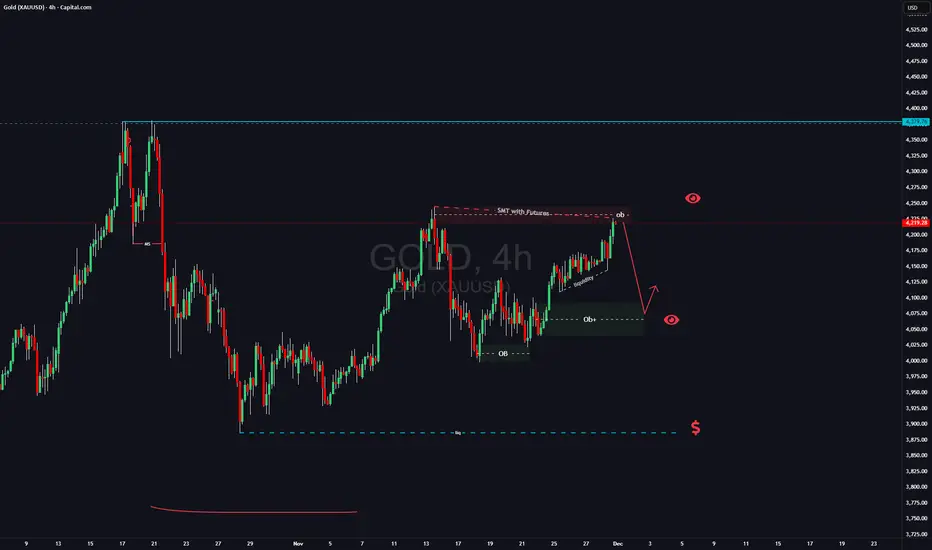
GOLD SETUP: The Liquidity Grab That Could Change Your Month!There is intresting situation on Gold right now:
1) There is SMT with futures(on futures price went higher than previous high from November 13th
2) Have a lot of liqudiity down below which usually means that this liqudiity will be taken
3) strong uptrend on LTF
taking in consideration these factors and that it will be beginign of the month on Monday i will be looking for manipulation at market opening. If i see trend shift on LTF i will be looking for short position till 4110 area (4h OB) , if this wont happen i simply gonna skiip trading GOLD this week.
When price action is not clean and when its hard to see clear picture better to avoid such trade and just watch.
Like and follow if you like my analysis
ElDoradoFx – GOLD ANALYSIS (02/12/2025, ASIA SESSION)1️⃣ Market Overview
Gold begins the Asia session trading around $4,205–$4,207, following a controlled pullback from the $4,264.58 1H swing high. Yesterday’s decline created a clean corrective structure, now sitting below the 1H Fibonacci Golden Zone.
The market currently shows:
• Bearish corrective momentum
• Lower-timeframe exhaustion
• Untested liquidity below at 4190 → 4181
Asia session is positioned to determine whether price forms a continuation leg down toward deeper liquidity, or if a reclaim of the Golden Zone signals a bullish reaccumulation phase.
⸻
2️⃣ Technical Breakdown
🔹 Daily (D1)
• Macro bullish trend intact above 4,150.
• Price rejected the 4,262 zone with a long upper wick — a textbook sign of exhaustion.
• RSI ~53 and flattening → market still balanced but favors retracement toward 4,150 if structure weakens.
• A daily close back above 4,230 would shift momentum toward another retest of 4,264 → 4,315.
⸻
🔹 1H Chart
• Corrective bearish structure from 4264.58 is clean and orderly.
• Price sits below the 50EMA, 100EMA, and under bearish CHoCH.
• Fresh supply formed at 4213 → 4223, aligning exactly with the 1H fib 50–61.8% zone.
• Demand zones: 4200 → 4190 → 4181.23.
• Reclaiming 4226 would be the first sign of bullish recovery.
⸻
🔹 15M–5M
• Micro-trend bearish with lower highs under 4213–4216.
• MACD still negative, no sign of bullish momentum shift yet.
• Liquidity layers below: 4195, 4188, 4181 remain untouched → magnets for Asia.
• Reversal requires BOS + strong rejection wick + MACD flip.
⸻
3️⃣ Fibonacci Analysis (1H Swing: 4181.23 → 4264.58)
• 38.2% = 4232.63
• 50.0% = 4222.90
• 61.8% = 4213.17
🎯 Golden Zone = 4232.63 – 4213.17
(Currently below → bearish pressure confirmed)
This fib selection is ideal for sessions where momentum is corrective but the larger trend is bullish — allowing for both continuation sells AND potential reaccumulation signals.
⸻
4️⃣ High-Probability Trade Scenarios
📉 SELL Scenario (Primary Bias)
Best option as long as price stays under the Golden Zone.
Sell Zone:
• 4213 – 4223 (61.8–50% fib retest)
• Secondary: 4230–4233 (38.2 fib + structure flip)
🎯 Targets:
4200 → 4190 → 4181 → 4170
🛑 Stop Loss: Above 4238
⚡ Confirmation:
Bearish rejection wicks + BOS on 5M.
⸻
📉 SELL Breakout Setup
Trigger: Break & close below 4200
Retest: 4203–4205 failing
🎯 Targets:
4190 → 4181 → 4170
🛑 SL: Above 4213
⸻
📈 BUY Scenario (Countertrend)
Valid only at liquidity sweep zones.
Buy Zone:
• 4188 – 4181 (major 1H liquidity + previous structure low)
🎯 Targets:
4200 → 4213 → 4223
🛑 SL: Below 4174
⚡ Must see:
Strong BOS + volume shift + RSI divergence.
⸻
📈 BUY Breakout Setup
Aggressive Trigger:
4226 (clears 5M swing high)
Safer Trigger:
4233 (reclaim of fib 38.2% + structure)
Retest: 4220–4223
🎯 Targets:
4245 → 4260 → 4264.58
🛑 SL: Below 4213
⸻
5️⃣ Fundamental Watch
• Asia low liquidity but strong positioning ahead of London.
• No major news early, US events later may dictate trend continuation.
• DXY stable; gold reacting primarily to technical structure.
• Key watch today: 4200 support and 4226 resistance.
⸻
6️⃣ Key Technical Levels
Resistance: 4213 / 4223 / 4233 / 4260
Support: 4200 / 4190 / 4181 / 4170
Golden Zone: 4232.63 – 4213.17
Break Buy Trigger: > 4226 (aggressive) or > 4233 (safe)
Break Sell Trigger: < 4200
⸻
7️⃣ Analyst Summary
Gold remains in a controlled correction under the 1H Fib Golden Zone.
As long as price stays below 4213–4223, bearish continuation into 4200 → 4181 is the highest-probability scenario.
Only after reclaiming 4226–4233 does bullish momentum return meaningfully.
A sweep of 4181 could form the base for the next macro leg up.
⸻
8️⃣ Final Bias Summary
📉 Primary Bias: Bearish → toward 4200 → 4181
📈 Alternative Bullish Bias: Only above 4226–4233
🎯 Key Decision Levels: 4200 & 4226
⸻
🥇 ElDoradoFx PREMIUM 3.0 – PERFORMANCE 02/12/2025 🥇
📌 DAILY RESULTS
✅ BUY +40 PIPS
✅ SELL +40 PIPS
✅ BUY +20 PIPS
✅ BUY +20 PIPS
✅ BUY +470 PIPS
✅ BUY +110 PIPS
✅ BUY +100 PIPS
❌ BUY -60 PIPS (SL)
✅ BUY +70 PIPS
🎯 LIVE SESSION ▶️
✅ SELL +120 PIPS
✅ SELL +40 PIPS
✅ BUY +120 PIPS
━━━━━━━━━━━━━━━
📊 SWING TRADES – STILL RUNNING
🔵 BUY → +3,005 PIPS
🟣 BUY → +2,260 PIPS
🟢 BUY → +1,390 PIPS
━━━━━━━━━━━━━━━
💰 TOTAL PIPS GAIN: +1,090 PIPS
📊 12 Signals → 11 Wins | 1 SL
🎯 Accuracy: ~92%
Great start to December continues – structured entries, strong swings and solid intraday gains.
Congratulations if you profited ✅✅✅🚀🚀🚀

XAUUSD | Price Sees Bounce to ReboundGold (XAU/USD) rebounded well overnight from the $4,155-$4,150 support level. This upward movement benefits gold bulls.
However, traders are advised to exercise caution and wait for confirmation of a breakout of key levels.
✅ Bullish Scenario
- Key Hurdles: It is recommended to wait for price acceptance above the strong $4,245-$4,250 barrier before taking further bullish positions.
✅ Upside Target: Once $4,250 is broken, gold could:
- Surpass the weekly high around $4,264-$4,265.
- Break through the $4,277-$4,278 resistance.
- Aim to reclaim the $4,300 round number.
✅ Bearish Scenario
- Initial Support (Buying Opportunity): Weakness below the $4,200 round figure may continue to attract buyers and is expected to find decent support ahead of the $4,150 level.
- Critical Point (Pivot): The $4,150 level should act as a key pivotal point.
- Strong Selling Trigger: A break below $4,150 could drag Gold prices towards the $4,100 round figure.
- Key Confluence Support: Continued selling will test the confluence support at $4,075 – $4,073.
Note: $4,075 – $4,073 consists of the 200-period EMA on the 4-hour chart and a long-term uptrend line.

XAUUSD: The upward trend remains intact; wait for entryGold remains in an overall uptrend, but bullish momentum is clearly weakening, making today a crucial session.
Whether prices can continue moving higher will largely depend on whether gold can hold the current pullback. If support holds, the next leg up is likely to be even stronger. If not, the market will likely slip into a choppy, range-bound pattern.
Over the past two weeks, markets have been heavily pricing in a Fed rate-cut narrative, and much of that expectation is now largely priced in.
At the same time, the nomination of a new Federal Reserve Chair has returned to the center of market attention. Regardless of who is selected, the candidate is widely expected to be dovish, or they would not have been nominated in the first place.
A dovish chair would inherently support rate cuts—a bullish factor for gold.
Therefore, even if gold experiences short-term pullbacks or weakening momentum, the broader bullish trend remains unchanged.
For today, the key price levels to watch are $4,180 and $4,200.
If price reaches these zones, they may offer actionable trading opportunities.

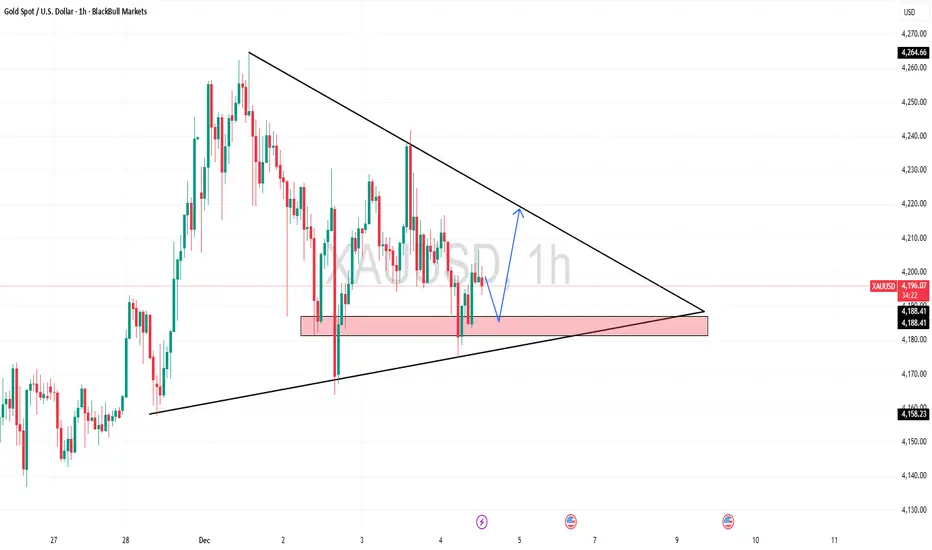
“Gold Market Structure Update: BOS, CHoCH & Key Levels to Watch”Gold (XAUUSD) is showing a clear market structure transition after forming a strong Double Top followed by a Descending Triangle pattern. Price broke down from the Double Top neckline and later broke out bullish from the Descending Triangle, confirming a shift in trend.
Double Top formation signaling early bearish pressure
Descending Triangle Breakout initiating bullish momentum
Multiple BOS (Break of Structure) and CHoCH confirming trend reversal
Price moved into a clear uptrend, respecting bullish structure
Current rejection area suggests a possible short-term pullback toward the 4160–4120 support range
Watching for reaction at key levels to determine continuation or deeper correction
This setup provides a clean roadmap for both trend-followers and pullback traders.
Not financial advice – for educational purposes only.

XAUUSD(GOLD): View Remain The Same Major Swing Sell! Gold dropped to $4030 today, filling up the liquidity gap. However, it reversed nicely. Looking at smaller time frames, we notice heavy selling pressure, which is likely to push the price down towards our target one or two, if fundamentals support the view. Furthermore, we believe the price still has a high chance of going around our top entry around $4380. That area remains a key level if the trend is bearish in the longer term. We advise you to wait for further correction before making any decisions.
Good luck and trade safely!
Team Setupsfx_🏆❤️

XAUUSD 30M — Retest Setup Toward Premium ZoneFOREXCOM:XAUUSD
Price is currently trading below trendline resistance after rejecting earlier highs. A potential pullback toward the 4,140–4,150 retest zone may offer a liquidity-based entry before continuation higher. As long as price holds above the invalidation zone, bullish structure remains valid.
Key Conditions
🔹 Bullish Scenario (Primary Bias)
Entry confirmation from: 4,140–4,150 zone
🎯 Target: 4,245–4,260
🛑 Invalidation/Stop: Below 4,120
A strong candle close above the trendline would further strengthen continuation.
Key Levels
Zone Type Level
Entry Zone 📍 4,140–4,150
Invalidation ❌ Below 4,120
Target 🎯 4,245–4,260
Trendline Break Confirmation Above 4,175
⚠️ Disclaimer: This analysis is for educational purposes only and not financial advice.
