Gold Price Outlook – Trade Setup (XAU/USD)📊 Technical Structure
OANDA:XAUUSD Gold (XAU/USD) rebounded from the Support Zone ($3,929–$3,938), aligning with the ascending trendline drawn from late October lows. The price is attempting to recover toward the Resistance Zone ($3,985–$3,994) but remains within a broader corrective structure.
The bullish momentum looks corrective rather than impulsive, suggesting that unless gold breaks above $3,995 convincingly, sellers may re-emerge near resistance. The rising trendline remains a short-term guide; holding above $3,940 keeps the rebound bias valid.
🎯 Trade Setup
Entry: $3,929 – $3,938
Stop Loss: $3,925
Take Profit 1: $3,985
Take Profit 2: $3,994
Risk-Reward Ratio: ≈ 1 : 4.95
🌐 Macro Background
Gold is stabilizing near $3,950 after a sharp 1.8% sell-off on Tuesday, following renewed USD strength. As FXStreet’s Dhwani Mehta notes, “Gold is licking its wounds near $3,950... but downside risks remain intact ahead of U.S. data.” 【FXStreet】
USD Dynamics: The Dollar entered a bullish consolidation phase after the risk-off rally, with traders reducing bets on further Fed cuts this year. The CME FedWatch Tool shows less than a 70% chance of a December rate reduction.
Market Sentiment: The global tech-led equity sell-off drove risk aversion, causing investors to cover equity losses by selling gold positions.
Upcoming Data: Traders now focus on U.S. ADP employment and ISM Services PMI, both of which could reshape expectations for Fed policy. Strong readings could strengthen the USD and weigh on gold; weak figures might lift gold on renewed rate-cut bets.
Overall, gold’s short-term recovery remains fragile. A rebound toward $3,985–$3,995 could face resistance unless U.S. data disappoints.
🔑 Key Technical Levels
Resistance: $3,985 – $3,994
Support: $3,929 – $3,938
Trendline Support: $3,940
Psychological Level: $3,950
📌 Trade Summary
Gold (XAU/USD) is showing a corrective bounce after finding support near $3,930. While the setup allows for a short-term long trade toward $3,985–$3,994, traders should remain cautious as the broader sentiment stays bearish. A break below $3,925 would invalidate the rebound and reopen the path toward $3,900.
⚠️ Disclaimer
This analysis is for reference only and does not constitute trading advice. Trading involves significant risk, and proper risk management is essential.
Xauusdupdates

Gold: Focus on Selling, Watch Resistance at 3960–3975Gold bounced after pulling back to the 3948–3921 support zone yesterday, but was capped by the 4H MA5 and fell back toward support again. On the 30-minute chart, the price action currently shows signs of a potential rebound, with the MA60 serving as the key upside resistance in today's session.
As mentioned during yesterday’s live updates, if the 3948–3921 support area breaks, the next major level to watch will be the 3800 psychological mark along with support from the daily MA60. At that stage, trading strategies should be adjusted based on real-time market behavior and sentiment.
Overall, the short-term bias remains bearish, favoring trend-following sell setups. For medium- to longer-term traders, gradual long positioning can be considered. However, volatility remains elevated in this phase, so risk control is essential—manage position size carefully and avoid emotional trading.

ElDoradoFx – GOLD SESSIONS ANALYSIS (05/11/2025, ASIA SESSION)Gold closed the US session bearish at 3,932, extending its downside move under the descending trendline and rejecting from the key supply area at 3,953–3,960. The structure, momentum, and RSI alignment all confirm a continuation bias to the downside — the market remains in a controlled sell-off phase unless bulls reclaim 3,954 with volume.
⸻
📊 Technical Outlook
🔹 D1: Gold is in the second leg of a corrective pullback after peaking at 4,046. The RSI at 46 and fading MACD histogram show room for continuation toward the 100EMA near 3,870.
🔹 H1: Price has consistently printed lower highs and lower lows. All EMAs (20 < 50 < 200) slope downward. The most recent break below 3,940 confirms renewed seller strength.
🔹 15M–5M: Consolidation inside a tight bearish channel, forming minor liquidity traps above 3,940–3,946 before further declines. Momentum is stable to the downside, with no bullish divergence detected.
⸻
✨ Fibonacci Golden Zone (Swing 3,953 → 3,932)
• 38.2% = 3,940
• 50.0% = 3,943
• 61.8% = 3,946
🎯 Golden Zone: 3,940 – 3,946 (Rejection zone for re-entry shorts)
⸻
🎯 High Probability Trade Setup (Chosen Bias: SELL)
📉 SELL SCENARIO (High Probability)
✅ Sell Entry Zone: 3,940 – 3,946 (Golden Zone retest)
🎯 Targets:
1️⃣ 3,925
2️⃣ 3,915
3️⃣ 3,900
4️⃣ Extended target 3,880 (swing projection)
🛑 Stop Loss: Above 3,954
⚡ Confirmation:
– Price rejection at 3,946 or bearish engulfing candle
– RSI stays below 45
– MACD momentum bars remain red
💡 Rationale:
Structure, EMAs, and momentum fully aligned to downside; the 3,940–3,946 area is a low-risk, high-probability retest before the next leg down.
⸻
📈 BUY SCENARIO (Low Probability)
⚠️ Buy Zone: 3,910 – 3,900 (strong low zone / liquidity pool)
🎯 Targets: 3,932 → 3,940
🛑 Stop Loss: Below 3,890
⚡ Only if: Strong bullish divergence forms with RSI <30 and MACD crossover.
⸻
📰 Fundamental Watch
• Asia: Low volatility expected early session; traders waiting for European cash flow.
• DXY: Holding above 106 supports bearish gold momentum.
• No major news, but volatility could spike from dollar liquidity flows ahead of midweek positioning.
⸻
📌 Key Levels
Type Levels Notes
Resistance 3,940 / 3,946 / 3,954 Golden Zone / Rejection Area
Support 3,928 / 3,915 / 3,900 Short-term targets
Break Sell Trigger < 3,928 Confirms continuation
Break Buy Trigger > 3,954 Invalidates bearish setup
⸻
✅ Expert Summary (Final Bias)
Gold remains in bearish continuation mode, with clean confluence between structure, EMAs, and momentum.
🎯 Expect short opportunities from 3,940–3,946 aiming toward 3,915–3,900.
📉 Bias: Bearish continuation until proven otherwise.
⸻
🥇 ElDoradoFx PREMIUM 3.0 – PERFORMANCE 04/11/2025 🥇
📊 Live precision | Consistent gains.
━━━━━━━━━━━━━━━
💎 GOLD RESULTS
🔻 SELL +20 PIPS
🟢 BUY LIMIT +70 PIPS
🔻 SELL +30 PIPS
🟢 BUY +20 PIPS
🟢 BUY +20 PIPS
🔻 SELL +240 PIPS
---
▶ LIVE TRADING SESSION
🔻 SELL +20 PIPS
🔻 SELL +20 PIPS
🔻 SELL +170 PIPS
━━━━━━━━━━━━━━━
💰 TOTAL PIPS GAIN: +610 PIPS
📊 9 Trades → 9 Wins | 0 SL | 0 BE
🎯 Accuracy: 100% ✅
━━━━━━━━━━━━━━━
🔥 Clean, disciplined setups both pre-market and live. Another powerful session for our traders!
👏 Congratulations if you profited! ✅✅✅🚀🚀🚀

GOLD Potential Short!
HI,Traders !
#GOLD keeps growing
And we are bullish biased
Mid-term but the price will
Soon hit a horizontal resistance
Of 4027.04 from where a local
Bearish pullback is to
Be expected !
Comment and subscribe to help us grow !

Support and trend line coincide, pullback to buy.#XAUUSD OANDA:XAUUSD TVC:GOLD
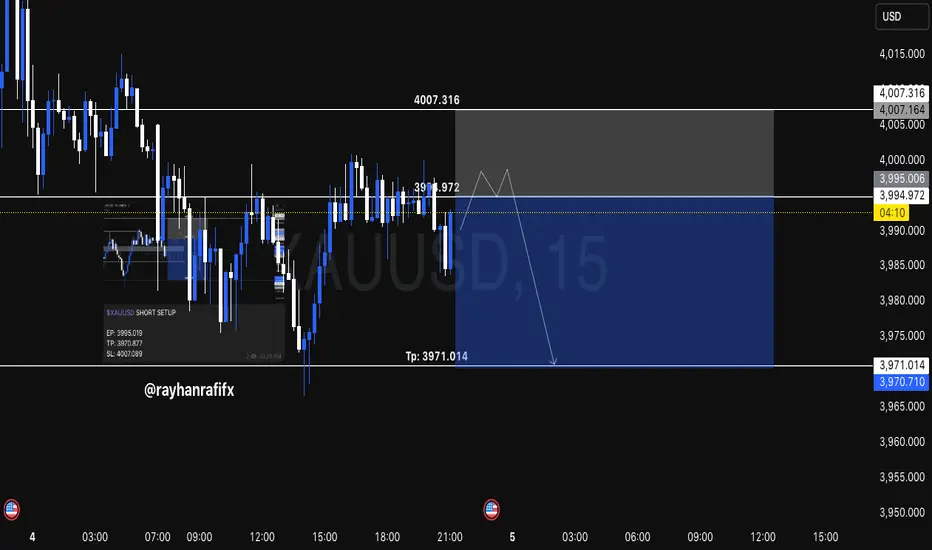
So far, gold has failed to break out of the converging triangle boundary to choose a clear trading direction, but as time goes on, the price is gradually approaching the end of the triangle, and the battle between bulls and bears may come to a critical decision during the NY session. Looking at the hourly chart, multiple attempts to break through the 4000 resistance level have failed, confirming the pressure above, and gold prices may see further pullback in the short term. The support zone below coincides with the upward trend line, which may be the key area for gold to test during a pullback. Therefore, continue to pay attention to the support level of 3970-3960. If the price retraces to the support level during the NY session and does not break down, you can try to go long on gold with a small position.

XAU/USD Technical Analysis – Bearish Rejection at ResistanceXAU/USD) is currently trading around the $4,009 level after rebounding from a recent intraday low. The price action shows a clear rising channel structure, with the upper boundary acting as a significant resistance zone near $4,040 – $4,050.
The chart highlights a resistance level where price has repeatedly failed to sustain upward momentum, indicating a potential double-top or distribution pattern forming in this area.
If price fails to break and hold above the $4,020 – $4,040 resistance zone, bearish momentum may resume, potentially pushing gold toward the $3,950 area initially, followed by a deeper correction to the target level near $3,913.
Conversely, a decisive breakout and close above $4,050 could invalidate the bearish outlook, opening the way for further bullish continuation.
Key Levels:
Resistance Zone: $4,020 – $4,050
Immediate Support: $3,990
Target Level: $3,913
Trend Bias: Short-term bearish under resistance
Conclusion:
Gold is approaching a critical resistance area, and a rejection could confirm a short-term bearish reversal pattern. Traders should watch for confirmation near $4,020–$4,040 for potential short entries targeting $3,913. CME_MINI:NQ1! CME_MINI:MNQ1! CME_MINI:ES1! CME_MINI:MES1! COMEX_MINI:MGC1! CBOT_MINI:YM1! NYMEX:CL1! CME:BTC1! COMEX:SI1! NSEIX:NIFTY1! CME_MINI:RTY1!

Gold breaking through this signal could see it reach the $4,000 Gold experienced a sharp drop in the short term, retreating to the support area of 3928 and reversing. The current upward pressure is in the 3977-3989 USD area, which is the key area for short-term gains. If this area is broken, it will once again stand above the 4000 USD mark.

SELL XAUUSD (GOLD) - Great trade opportunityGOLD (XAUUSD) has been in a downtrend lately and has been showing many signs of more bearish movements ahead. Gold is currently in a clear downtrend channel shown on the chart, it has also broken a powerful support level and recently broken the yellow trendline which acted as the last support level near the current price. Gold is likely to hit the next support zone which is shown as the take profit level on the chart. Time to sell!

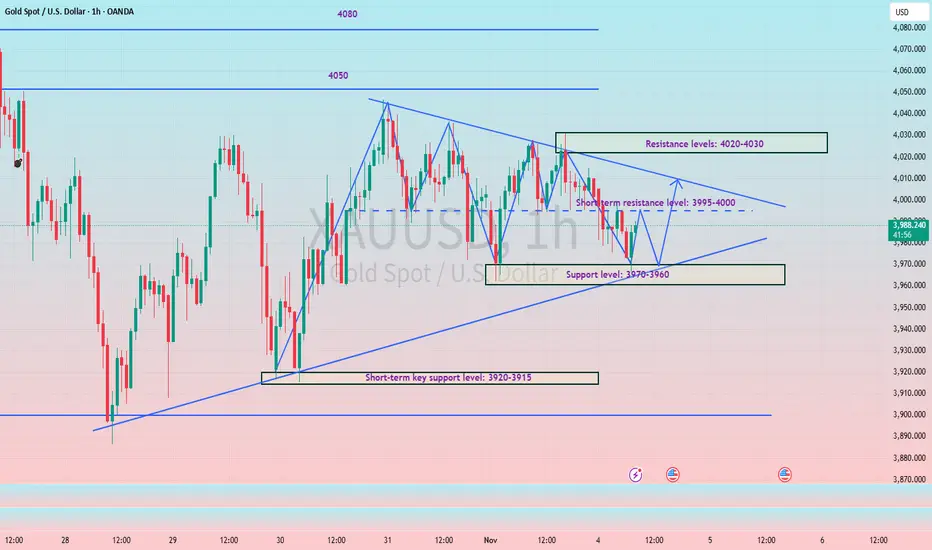
Gold Approaches 3960 Support After Failing at 4030Yesterday, I highlighted that Gold appeared slightly bullish, forming an ascending triangle with resistance around the 4030 zone. Early in the day, Gold did indeed rise and tested this resistance again. However, after the futures market opened, momentum started to fade, and the price began fluctuating around the 4000 level.
As we entered the Asian session, the bears took control, and Gold is now testing the 3970 level, approaching the key 3960 support, which aligns with yesterday's low.
If we see a break below this support, the next key levels to watch are 3915, a zone where Gold experienced significant reactions last week, and even 3890.
On the flip side, any stabilization above the 4000 level could shift the bias back to bullish.
Key Points:
- Downside: Break below 3960 opens 3915 and potentially 3890.
- Upside: Only stabilization above 4000 would suggest a bullish shift.
🚀 Let's see if Gold can make a move today, but remember, volatility remains extremely high and 3-400 pips means nothing for Gold nowadays

Gold Trade Secured 250 Pips!Our sell set up played our perfectly, broke structure on the 15m, swept 5m BSL, took sells to SSL. What a clean set up

XAUUSD SHORT SETUP INTRADAY ( NOV 04, 2025 )If you have doubt on our trades you can test in demo.
OANDA:XAUUSD SHORT SETUP
EP: 3995.019
TP: 3970.877
SL: 4007.089
Trade Ideas:
Idea is clearly shown on chart + we have some secret psychologies and tools behind this.
Trade Signal:
I provide trade signals here so follow my account and you can check my previous analysis. So don't miss trade opportunity so follow must.
Gold Trade Set Up Nov 4 2025Price is making LL/LH on the 1h and 15m so i am still bearish but first i want to see a sweep of internal BSL followed by 5m bearish candle close to target SSL/PDL

XAUUSD LONG SETUP INTRADAY ( NOV 04, 2025 )If you have doubt on our trades you can test in demo.
Details:
Entry: 3981.277
Target Price: 4005.181
Stop loss: 3969.178
Trade Ideas:
Idea is clearly shown on chart + we have some secret psychologies and tools behind this.
Trade Signal:
I provide trade signals here so follow my account and you can check my previous analysis. So don't miss trade opportunity so follow must.

How to keep up with the rhythm of triangle pattern consolidation#XAUUSD OANDA:XAUUSD TVC:GOLD
Gold prices stalled at higher levels yesterday, mainly due to Federal Reserve officials' cautious stance on a December rate cut, which boosted the dollar and dampened enthusiasm for gold's rise. Judging from the current trend, the market is in a converging triangle pattern. The daily MA5 is around 3987, and the MA10 is around 4021. It can be seen that the range between these two points is very small, indicating that the market is also preparing to break out and choose a major direction. Once the gold price breaks out of the triangle pattern and chooses a direction, the daily chart's trendline will widen. Therefore, the key resistance level to watch is 4020-4030, while the key support level is 3970-3960. The European session is expected to trade within a range in the short term. Before a successful breakout, pay attention to the resistance level of the middle band on the hourly and 4-hour charts at 3995-4000. If the price touches the resistance level on the first attempt and fails to break through, a small short position can be considered.
Gold Remains Range-Bound — Focus on Selling ReboundsAs time passes, the 4-hour moving average resistance continues to shift lower, with the key resistance area now around 4004/4030. From the current candlestick structure, bearish momentum still dominates. On the daily chart, the MA30 serves as the crucial pivot level, while MA20 can be used to gauge broader trend direction. In other words, only a firm hold above the MA30 would give bulls a chance to compete, and a full trend reversal would require a confirmed breakout above the MA20.
Key short-term support remains at 3948-3921, followed by the previous low near 3885. If these levels fail to hold, attention should shift to the 3800 psychological level and support from the daily MA60.
On the news front, geopolitical tensions continue to escalate, which has provided some safe-haven demand for gold. However, given the strong rally over the past two months, gold’s traditional safe-haven appeal has weakened, and volatility has increased, giving it characteristics closer to a risk asset at times. Therefore, geopolitical factors should be referenced cautiously, with primary focus remaining on core price structure and trading logic.
Meanwhile, uncertainty around whether there will be a rate cut in December also contributes to the current consolidation. Until there is clear direction, trading should remain cautious—focus on opportunities you clearly understand and avoid greed. When the market structure becomes unclear, stay patient and reduce unnecessary trades to manage risk.

Gold looking for another mega bullish This XAU/USD (Gold vs USD) 2-hour chart shows a consolidation phase between the support zone around 3,922 – 3,886 and the resistance level near 4,039 – 4,153. The price is currently trading near 3,994, indicating indecision before a potential breakout.
If gold holds above the support area, the chart suggests a possible bullish breakout above resistance, leading to a continuation toward the long-term target at 4,376. The upward arrows outline a projected move with minor pullbacks, showing step-by-step momentum building toward the target.
In summary, as long as price remains above support, the bias stays bullish, with confirmation coming from a clear breakout above the 4,040–4,150 resistance zone.

XAU/USD: Powell vs. The Discount ZoneHey traders! Gold (XAU/USD) is caught in a fierce battle: a hawkish Fed is boosting the USD, while the risk of a US government shutdown offers support to Gold.
📰 Key Fundamental Drivers:
The Fed & Powell: Interest rates are likely to remain high (Hawkish stance), pushing the USD stronger and applying DOWNWARD pressure on Gold.
US Government Shutdown: The economic risk could limit the USD's rally, providing support for Gold (the safe-haven asset).
📉 Technical Analysis:
Price is currently moving within a Rising Wedge (a bearish reversal pattern) and heading towards a critical Strategic Support Zone (Discount Zone).
🔥 Strategic Support Zone (The Discount Zone): $3,941 - $3,953. This is an attractive price area to look for a Buy (Long) opportunity with a good risk/reward ratio.
Major Resistance Zone: $4,004 - $4,025.
🎯 Two-Sided Strategy:
1. The Bullish Scenario:
Action: Wait to BUY (LONG) when the price hits $3,941 - $3,953 and shows a strong reversal signal.
Target: $4,004 - $4,025.
2. The Bearish Scenario:
Action: SELL (SHORT) if price is strongly rejected at $4,004 - $4,025 OR if price breaks decisively below $3,941.
Target: Below $3,900.
🚨 Warning: Keep a close watch on comments from FOMC members this week to properly position your risk.
#xauusd #forex #powell #fomc #technicalanalysis #gold #usd #discountzone #tradingview

XAU/USD 04 November 2025 Intraday AnalysisH4 Analysis:
-> Swing: Bullish.
-> Internal: Bullish.
Analysis and bias remains the same as analysis dated 20 October 2025.
Price has printed as per previous intraday expectation by printing a bearish CHoCH which indicates, but not confirms, bullish pullback phase initiation.
Price is currently trading within an established internal range, however, I will continue to monitor price with regards to depth of pullback.
Intraday expectation:
Price to continue bearish, react at either discount of 50% internal EQ, or H4 supply zone before targeting weak internal high priced at 4,380. 990.
Note:
The Federal Reserve’s sustained dovish stance, coupled with ongoing geopolitical uncertainties, is likely to prolong heightened volatility in the gold market. Given this elevated risk environment, traders should exercise caution and recalibrate risk management strategies to navigate potential price fluctuations effectively.
Additionally, gold pricing remains sensitive to broader macroeconomic developments, including policy decisions under President Trump. Shifts in geopolitical strategy and economic directives could further amplify uncertainty, contributing to market repricing dynamics.
H4 Chart:
M15 Analysis:
-> Swing: Bullish.
-> Internal: Bearish.
Analysis and bias to remain the same as yesterday's bias date 29 October 2025.
As expected, price has printed a bullish CHoCH to indicate bullish pullback phase initiation.
Price is now trading within an established internal range.
Intraday expectation:
Price to continue bullish, react at either premium of internal 50% EQ or M15 demand zone before targeting weak internal low, priced at 3,886.465.
Note:
Gold remains highly volatile amid the Federal Reserve's continued dovish stance, persistent and escalating geopolitical uncertainties. Traders should implement robust risk management strategies and remain vigilant, as price swings may become more pronounced in this elevated volatility environment.
Additionally, President Trump’s tariff announcements, particularly against China, are expected to further amplify market turbulence, potentially triggering sharp price fluctuations and whipsaws.
M15 Chart:

ElDoradoFx – GOLD (XAUUSD) ANALYSIS (04/11/2025, LONDON SESSION)1. Market Overview
Gold enters the London session trading just below the $4,000 handle, recovering after an early Asian dip to $3,970. The market remains in a range-to-accumulation phase, consolidating beneath descending structure resistance ($4,008–$4,016) and above key support ($3,985–$3,970). Momentum indicators suggest early bullish restoration, but price action remains capped under the 200EMA, awaiting a confirmed breakout to define London’s direction.
⸻
2. Technical Breakdown
🔹 Daily (D1)
Gold holds above the 100EMA, keeping the medium-term structure bullish. RSI at ~50.5 indicates neutrality after a corrective pullback from $4,046. As long as price stays above $3,985, the bullish structure remains intact.
🔹 H1
The pair trades within a descending channel, testing dynamic resistance at $4,004–$4,008. The 50EMA is flattening near the 200EMA, hinting at a potential cross for trend continuation. MACD is stabilizing with higher histogram lows, a bullish sign of momentum recovery.
🔹 15M–5M
Short-term structure shows a series of higher lows (3,970 → 3,982 → 3,993) but faces a clear supply ceiling at 4,004–4,010. RSI around 55–60; MACD positive, suggesting accumulation pressure and reduced selling volume.
⸻
3. Fibonacci Analysis (Swing 3,970 → 4,008)
• 38.2% = 3,993
• 50.0% = 3,989
• 61.8% = 3,985
🎯 Golden Zone: 3,993 – 3,985 → Active demand area for potential long entries.
⸻
4. High-Probability Trade Scenarios
📈 BUY SCENARIO (Primary Bias)
• Buy Zone: 3,993 – 3,985 (Golden Zone)
• Confirmation: Bullish CHoCH or engulfing candle in zone with RSI > 50
• Targets: 4,004 → 4,016 → 4,028 → 4,046
• Stop Loss: Below 3,970
📊 Justification: The Golden Zone aligns with previous liquidity sweep and ascending channel support — strong probability for continuation if defended during London volatility.
💥 Breakout BUY Setup
• Trigger: Break & close above 4,008
• Retest Entry: 4,004–4,006
• Targets: 4,016 → 4,028 → 4,046 → 4,060
• Stop Loss: Below 3,995
📉 SELL SCENARIO (Countertrend)
• Sell Zone: 4,004 – 4,016 (EMA confluence & descending structure)
• Confirmation: Bearish rejection or RSI divergence > 65
• Targets: 3,989 → 3,970 → 3,945
• Stop Loss: Above 4,020
📊 Justification: A rejection from this area would indicate failed breakout momentum, creating a high R:R short toward range support.
⚠️ Break & Retest SELL Setup
• Trigger: Break below 3,970
• Retest Entry: 3,978–3,974
• Targets: 3,965 → 3,945 → 3,920
• Stop Loss: Above 3,985
⸻
5. Fundamental Watch
• UK/EU Data: Light calendar — focus remains on USD strength and DXY (106.10).
• US Factors: Factory Orders and Fed speakers later today; could affect volatility mid-London to NY overlap.
• Sentiment: Gold remains technically bullish but constrained by short-term dollar resilience and yield stabilization.
⸻
6. Key Technical Levels
Type Levels Notes
Resistance 4,004 / 4,016 / 4,028 / 4,046 Supply + 200EMA zone
Support 3,993 / 3,985 / 3,970 / 3,965 Fibo + structural base
Golden Zone 3,993 – 3,985 Main liquidity pivot
Break Buy Trigger Above 4,008 Confirmed bullish continuation
Break Sell Trigger Below 3,970 Bearish momentum confirmation
⸻
7. Analyst Summary
Gold is building pressure within a compressed wedge, where the Golden Zone (3,993–3,985) represents the pivot of the day.
Momentum indicators lean bullish, but the 200EMA and trendline resistance near 4,004–4,008 remain the key barriers.
A clean breakout above 4,008 opens the path to 4,028–4,046, while failure to hold above 3,985 may trigger a retracement to 3,965–3,945.
⸻
8. Final Bias Summary
✅ Primary Bias: Bullish above 3,985
⚠️ Neutral Zone: 3,985–4,004 (wait for breakout confirmation)
❌ Bearish Only Below: 3,970
🎯 Expert Outlook: Focus on buying dips near the Golden Zone with confirmation; avoid premature entries before breakout validation.
⸻
🥇 ElDoradoFx PREMIUM 3.0 – PERFORMANCE 03/11/2025 💸
📊 Smart Entries | Clean Profits | No Drawdown
━━━━━━━━━━━━━━━
🪙 GOLD RESULTS
🟢 BUY +120 PIPS
🟢 BUY +30 PIPS
🔻 SELL +90 PIPS
🟢 BUY +40 PIPS
🟢 BUY LIMIT +200 PIPS
🔻 SELL +20 PIPS
🟢 BUY +40 PIPS
🟢 BUY +20 PIPS
🟢 BUY +40 PIPS
💰 GOLD TOTAL: +600 PIPS
━━━━━━━━━━━━━━━
📱 BTC/USD WEEKEND TRADES
🚀 BUY +900 PIPS
🚀 BUY +1,300 PIPS
📱 BTC TOTAL: +2,200 PIPS
━━━━━━━━━━━━━━━
📊 COMBINED GAIN: +2,800 PIPS
✅ 11 Trades → 11 Wins | 0 SL | 0 BE
🎯 Accuracy: 100%
━━━━━━━━━━━━━━━
🔥 Flawless start to November — precision entries, strong momentum, and clear profit execution across GOLD and BTC!
👏 Congratulations if you profited! ✅✅✅🚀🚀🚀

Gold Awaits Direction Near $4,000 as Fed Comments Limit Upside🔍 Market Context
Gold is trading slightly below the $4,000 mark in early Asian hours, pressured by the Fed’s hawkish tone despite weaker US manufacturing data.
Fed Chair Jerome Powell signaled that another rate cut this year is “not guaranteed”, tempering expectations for further easing.
Meanwhile, ISM Manufacturing PMI slipped to 48.7 in October, below forecast — showing a slowdown, yet not enough to shift the Fed’s cautious stance.
Markets currently price in a 70% chance of a 25 bps cut in December and a total 82 bps by end-2026, reflecting moderate easing expectations rather than a full pivot.
📊 Technical Outlook (H1–H4)
Gold is consolidating around the 3,984–3,985$ area, forming a reaction base above 3,963$ support.
The structure remains within a short-term ascending channel, with the next directional cue likely from the 4,024$ resistance zone.
Key Levels:
• Support 1: 3,963$ – 3,984$ (liquidity defense zone)
• Support 2: 3,923$ (bullish invalidation level)
• Resistance 1: 4,024$
• Resistance 2 / Target: 4,046$
A sustained break above 4,024$ could trigger momentum toward 4,046$, confirming trend continuation.
Conversely, losing 3,963$ would expose 3,923$ as the next liquidity pool before a potential rebound.
🎯 Trading Outlook
Bias remains neutral-to-bullish as long as 3,963$ holds.
If price reacts positively at this zone during the Asian session, short-term buyers may step in toward 4,024$–4,046$.
However, any fresh hawkish comments from Fed officials could cap gains and trigger profit-taking.
⚜️ MMFLOW Insight:
“Liquidity builds where patience fades — smart money waits for the crowd to act first.”

Gold Price Outlook – Trade Setup (XAU/USD)📊 Technical Structure
OANDA:XAUUSD Gold is struggling to stay above $3,980, with clear resistance forming at $3,997–$4,005, just below the psychological $4,000 barrier. The price structure indicates a bearish short-term bias: rallies toward resistance may attract sellers targeting the $3,964–$3,956 support zone.
A sustained break below $3,956 would likely extend the decline toward $3,945, while only a decisive close above $4,010 would invalidate the downside bias.
🎯 Trade Setup
Entry: $3,997 – $4,005 (resistance retest)
Stop Loss: $4,007
Take Profit: $3,964 / $3,956
Risk-Reward Ratio: ≈ 1 : 4.67
🌐 Macro Background
Gold prices remain under pressure near $4,000 after the Federal Reserve’s hawkish tone boosted the U.S. Dollar.
As FXStreet’s Lallalit Srijandorn wrote: “Gold trades in negative territory near $4,000 as traders dial back expectations for additional Fed rate cuts.” 【FXStreet】
Fed Stance: Chair Jerome Powell stated another rate cut this year is “not a foregone conclusion.” Markets now assign roughly 70% odds of a 25bps cut in December, down from over 90% a week ago.
Data Impact: The ISM Manufacturing PMI fell to 48.7 in October (vs. 49.5 expected), highlighting slowing U.S. manufacturing — a potential drag on the dollar if weakness deepens.
Upcoming Event: Traders are watching ADP employment data (Wednesday) for labor market clues; weaker results may offer short-term relief for gold.
However, with the Fed maintaining a restrictive stance and the USD regaining momentum, gold’s upside remains capped in the near term.
🔑 Key Technical Levels
Resistance: $3,997 – $4,005
Support: $3,964 – $3,956
Psychological Level: $4,000
📌 Trade Summary
Gold remains confined below $4,000 amid hawkish Fed rhetoric and mixed U.S. data.
Short-term strategy favours selling rallies near $4,000, targeting $3,956, with stops above $4,007.
Only a breakout above $4,010 would shift bias to neutral.
⚠️ Disclaimer
This analysis is for reference only and does not constitute trading advice. Trading involves significant risk, and proper risk management is essential.

ElDoradoFx – GOLD SESSIONS ANALYSIS (03/11/2025, PRE-ASIA SESSIGold ends the NY session stabilizing near 4,009, after multiple rejections from 4,025–4,030, confirming that sellers are still defending the upper liquidity zone. Meanwhile, buyers continue holding 4,004–3,995, maintaining a short-term ascending structure. This compression phase between resistance and support signals an imminent breakout setup — with Asia likely to decide direction for the next leg.
⸻
📊 Technical Outlook
🔹 D1: Gold remains bullish above the 100EMA, sustaining higher lows from 3,962 → 3,985 → 3,995. RSI ~52 — neutral but holding mid-range momentum. Daily breakout above 4,025 could reopen the path toward 4,060–4,082.
🔹 H1: Structure compressing between 4,025 resistance and 3,995 support. EMAs converging; MACD neutral with low volatility — ideal for a pre-breakout scenario.
🔹 15M–5M: Price forming equal highs at 4,011–4,012 and higher lows near 4,004. RSI 54–58, indicating gradual bullish accumulation before volatility expansion.
⸻
✨ Fibonacci Golden Zone (Last Swing 3,995 → 4,030)
38.2% = 4,016
50.0% = 4,012
61.8% = 4,008
🎯 Golden Zone: 4,016 – 4,008 (acting as key liquidity zone and short-term pivot).
⸻
🎯 High Probability Zones
📈 BUY SCENARIO (Primary Bias)
✅ Buy Zone: 4,016 – 4,008 (Golden Zone)
🎯 Targets: 4,025 → 4,036 → 4,046 → 4,060
🛑 Stop Loss: Below 3,995
⚡ Confirmation: Bullish engulfing or CHoCH above 4,012–4,016 with MACD crossover upward.
📊 Bias Rationale: The market continues to respect higher lows and absorb liquidity dips — indicating smart money accumulation around the Golden Zone.
💥 Breakout BUY Setup
Trigger: Break & close above 4,025
Retest: 4,022–4,024
🎯 Targets: 4,036 → 4,046 → 4,060 → 4,082
🛑 Stop Loss: Below 4,010
📉 SELL SCENARIO (Contingency Setup)
⚠️ Sell Zone: 4,025 – 4,036 (liquidity pocket + supply zone)
🎯 Targets: 4,012 → 4,004 → 3,985 → 3,965
🛑 Stop Loss: Above 4,046
⚡ Confirmation: Sharp rejection or RSI divergence >65 from 4,025–4,030 area.
📉 Break & Retest SELL Setup
Trigger: Break below 3,995
Retest: 4,000–3,997
🎯 Targets: 3,982 → 3,965 → 3,945
🛑 Stop Loss: Above 4,008
⸻
📰 Fundamental Watch
• Asia session: Low-impact day; volatility expected from liquidity sweeps.
• US Dollar Index (DXY) holding above 106 — mild pressure on gold short-term.
• Global markets: Traders positioning ahead of Fed and NFP later this week, keeping gold in range mode for now.
⸻
📌 Key Levels
Resistance: 4,025 / 4,036 / 4,046 / 4,060
Support: 4,012 / 4,004 / 3,995 / 3,982
Golden Zone: 4,016 – 4,008
Break Buy Trigger: > 4,025
Break Sell Trigger: < 3,995
⸻
✅ Summary (Expert View)
Gold remains bullish-to-neutral, consolidating between 4,004–4,025.
The Fibonacci Golden Zone (4,016–4,008) continues to act as the core decision area — expect Asia to attempt a liquidity sweep before breakout.
⚡ Expert Bias: BUY setup favored above 4,008, targeting 4,036–4,046.
Bearish bias only if 3,995 breaks cleanly.

XAU/USD BULLISH CONTINUATION SETUPAnalysis:
On the XAU/USD (Gold vs USD) chart, price action shows a strong bullish structure forming after multiple Change of Character (CHoCH) and Break of Structure (BOS) confirmations. The market recently created an equal low (EQL) around the 3990–3995 zone, indicating potential liquidity build-up below.
Price has since rebounded from this demand area and is currently trading near the entry zone (around 4007–4008), suggesting a possible bullish continuation if structure holds.
Key observations:
Demand Zone: 3990–3995 region — a high-probability area where buyers previously stepped in.
Entry Level: Around 4007 — ideal for a long setup upon bullish confirmation.
Target Zone: 4060–4066 — aligning with the previous weekly high, acting as a strong liquidity target.
Stop Loss (Implied): Below 3988 zone, under equal lows for risk management.
Bias:
Bullish — as long as price holds above 3990 and maintains structure, the next push toward 4060–4066 remains likely.
