Gold Maintains Bullish Structure, Prepares for New Expansion Wav⏰ Timeframe: 30m
📅 Update: 11/13/2025
🔍 Market Context
After a short correction at the start of the week, gold has clearly formed a Break of Structure (BOS) on the 30-minute chart, indicating that bullish momentum has returned.
This morning's Asian session witnessed a strong recovery from the Support Zone, confirming that buying pressure remains dominant in the current structure.
The market is approaching the “expansion phase” – where prices typically expand to seek liquidity above.
📊 Technical Structure
Order Block 1 (4,208 USD): a short-term support area, likely to serve as a retest point after the expansion move.
Order Block 2 (4,184 USD): confluence of Fibonacci 0.5–0.618, a deep equilibrium zone within the bullish structure.
Support Zone: the main foundation of the medium-term uptrend, still being preserved.
Extension Levels:
• 4,249 USD → first expansion target.
• 4,267 USD → intermediate liquidity zone.
• 4,292 USD → maximum expansion target within the current cycle.
🎯 Market Outlook
Today's scenario leans towards a continuation bullish direction:
1️⃣ Price may technically correct to the OB 4,208 or 4,184 USD area.
2️⃣ Upon a bullish reaction, the market is likely to expand to 4,267 – 4,292 USD, where short-term selling liquidity is concentrated.
3️⃣ Losing the 4,184 USD level will temporarily shift the structure to rebalancing (sideways).
🧠 Analyst’s View
Gold is in the “expansion reaccumulation” phase, meaning after attracting liquidity below, prices begin to expand following the main trend.
Continuous BOS signals indicate that buyers are reasserting control.
As long as prices remain above the 4,184 USD area, the intraday bias remains predominantly bullish.
🛡️ Risk Note
The market is expanding rapidly, so pullback reactions to the OB area may be highly volatile.
Let your trade ideas run and let's observe together.
Xauusdupdates

ElDoradoFx – GOLD ANALYSIS (14/11/2025, ASIA SESSION)
1️⃣ Market Overview
Gold enters the Asia session trading around $4,171, following a strong bearish rejection from the $4,225–$4,245 supply region during the US session. The aggressive sell-off broke several intraday bullish structures and brought price back toward the mid-range of the weekly consolidation.
Buyers are attempting to stabilize price above the 4,160–4,165 intraday support cluster, but momentum remains weak as the descending trendline from $4,245 continues to cap upside attempts.
Gold is currently compressing between a falling intraday trendline and rising 200 EMA support, suggesting a tight coil before the Asia–London volatility window.
⸻
2️⃣ Technical Breakdown
🔹 Daily (D1)
• Gold printed a rejection wick below $4,181, but remains below the daily 10EMA.
• RSI sits at ~61, still bullish but cooling off from overbought levels.
• Daily support at $4,026–$3,920 remains intact.
• A daily close back above $4,200 would signal a bullish re-accumulation, while losing $4,155 risks a deeper pullback into $4,105–$4,098.
⸻
🔹 1H Chart
• Strong bearish momentum from the $4,245 high created a BOS to the downside; structure is now bearish-to-neutral.
• Price is currently stuck under the descending trendline while sitting just above the 200 EMA zone (4,165–4,170).
• RSI around 42, showing sellers still in control.
• MACD histogram is heavily red but flattening, indicating exhaustion from the initial drop.
• Intraday supply sits at 4,185–4,200, while support sits at 4,155–4,165.
⸻
🔹 15M–5M
• Short-term structure shows clear lower highs and repeated failures at 4,174–4,178.
• MACD momentum remains bearish, but weakening — suggesting a possible retest of structure before continuation.
• Asia liquidity is showing compression between rising micro-trendline and descending resistance, forming a symmetrical triangle.
• A breakout from this intraday wedge is likely the session’s decisive move.
⸻
3️⃣ Fibonacci Analysis
Last major swing: 4,098 → 4,245
• 38.2% = 4,189
• 50.0% = 4,171
• 61.8% = 4,153
🎯 Golden Zone: 4,171 – 4,153
Price is currently inside the Golden Zone — a sensitive area for either a bounce or deeper continuation.
⸻
4️⃣ High-Probability Trade Scenarios
📈 BUY SCENARIO (Countertrend Rebound From Golden Zone)
• Entry Zone: 4,171 – 4,153
• Targets:
→ 4,185
→ 4,198
→ 4,210
→ 4,225
• Stop Loss: Below 4,145
• Confirmation: Bullish engulfing or CHoCH on 5M/15M from inside the Fibonacci cluster.
⸻
📉 SELL SCENARIO (Main Bias Due to Rejection at 4,245)
• Entry Zone: 4,185 – 4,198 (intraday supply + descending trendline)
• Targets:
→ 4,171
→ 4,160
→ 4,145
→ 4,125
• Stop Loss: Above 4,205
• Confirmation: Rejection candle, RSI divergence, or repeated failure to break the descending structure.
⸻
💥 Breakout SELL Setup
• Trigger: Break & close below 4,155
• Retest Zone: 4,160–4,165
• Targets:
→ 4,145
→ 4,130
→ 4,105
• Stop Loss: Above 4,175
⸻
💥 Breakout BUY Setup (Alternative)
• Trigger: Break & close above 4,200
• Retest Zone: 4,192–4,198
• Targets:
→ 4,210
→ 4,225
→ 4,245
• Stop Loss: Below 4,185
⸻
5️⃣ Fundamental Watch
• Asia session typically quiet, but markets may position ahead of UoM consumer sentiment and Fed speakers.
• DXY remains soft after failing to hold 106.
• Bond yields are flattening — supportive for gold if sustained.
• No major high-impact news until US session, but pre-positioning may cause spikes.
⸻
6️⃣ Key Technical Levels
Resistance:
• 4,185
• 4,198
• 4,210
• 4,225
• 4,245 (major high)
Support:
• 4,171
• 4,160
• 4,153
• 4,145
• 4,125
Golden Zone:
4,171 – 4,153
Break Sell Trigger: < 4,155
Break Buy Trigger: > 4,200
⸻
7️⃣ Analyst Summary
Gold is currently trading inside a major Fibonacci Golden Zone after a strong rejection from the $4,245 high. While price is stabilizing above the 200 EMA, the structure remains bearish on intraday timeframes. Bears remain in control below 4,198, but bulls may reclaim momentum if they defend 4,153 and break above 4,200.
The market is compressing — expect a decisive breakout during Asia–London.
⸻
8️⃣ Final Bias Summary
📉 Primary Bias: Bearish below 4,198, targeting 4,160 → 4,145 → 4,125
📈 Alternative Bias: Bullish breakout above 4,200, targeting 4,225 → 4,245
⸻
🥇 ElDoradoFx PREMIUM 3.0 – PERFORMANCE 13/11/2025 🥇
📅 High-momentum day with strong continuation on buys + swing dominance.
━━━━━━━━━━━━━━━
🪙 XAU/USD (GOLD) Results
❌ BUY –40 PIPS (SL)
🟢 BUY +210 PIPS
🟢 BUY +110 PIPS
🟢 BUY +60 PIPS
🟢 BUY +210 PIPS
🟢 BUY +60 PIPS
❌ BUY –80 PIPS (SL)
🟢 SELL +210 PIPS
🟡 BUY – BE
🟢 BUY +240 PIPS
---
📈 SWING TRADE UPDATE (From 05/11)
🟩 Current Floating Profit: +2,850 PIPS
Trend still running massively in profit.
━━━━━━━━━━━━━━━
💰 TOTAL DAILY GAIN: +980 PIPS
📊 10 Trades → 7 Wins | 2 SL | 1 BE
🎯 Accuracy: 70%
━━━━━━━━━━━━━━━
🔥 Strong continuation, excellent volatility management, and another winning day for PREMIUM 3.0.
👏 Congratulations if you profited! ✅✅✅🚀🚀🚀
— ElDoradoFx PREMIUM 3.0 Team 💼📈

11/13 XAUUSD: How should you trade after the surge?Fundamental Analysis:
The U.S. government has officially ended its shutdown today. The passage of the funding bill will ensure continuous appropriations, providing operational funding for most federal agencies through January 30, 2026.
Following the announcement, White House Press Secretary Levitt stated that due to the earlier government shutdown, it is unlikely that the October Non-Farm Payrolls (NFP) and CPI data will be released as scheduled.
With the market eagerly awaiting data-driven guidance, this unexpected development has instead intensified risk aversion, triggering another sharp rally in gold prices.
Technical Analysis:
On the 4-hour chart, gold prices have reached the 0.618 Fibonacci extension level of the current uptrend, where they are now encountering resistance.
At this stage, chasing the rally carries a potential pullback risk. Therefore, any further bullish positioning should ideally be considered after a corrective retracement.
Support and Resistance:
Support: $2,180 — today’s intraday low and the 0.382 Fibonacci retracement level.
Resistance: $2,240–$2,250 — today’s intraday high and the 0.618 Fibonacci extension level.
Trading Strategy:
Primary bias: Buy on dips; short at highs as a secondary approach.
Entry (Long): Consider buying near $2,180, provided the level holds and is not breached.
Entry (Short): If gold rallies into the $2,240–$2,250 zone and fails to break above, consider short positions from that area.
ANFIBO | GOLD/XAUUSD - Keep BUYING bro [11.13.2025]I am ANFIBO!
GOLD Analysis – Daily Trading Plan
Overall Picture:
Once again, the market moved exactly as planned — our Buy entry at 4115 has delivered an impressive 1,300 pips in profit! This further reinforces the importance of trusting the strategy and following the trend. OANDA:XAUUSD continues to show strong bullish momentum, though it’s now entering a consolidation phase, with price likely to accumulate sideways between 4185 and 4220 on the H1 timeframe. As long as the price holds above 4170, the bullish channel structure remains intact. Today’s plan will be to buy near support within this consolidation range and ride the next upward impulse once momentum resumes.
Trading Plan for Today:
>>> BUY ZONE:
ENTRY: 4180 – 4195
SL: 4170
TP: 4240 – 4280 - ...
>>> SELL ZONE (Short-term scalp only):
ENTRY: 4235 – 4245
SL: 4250
TP: 4220
Risk Management:
- Continue to prioritize Buy positions in alignment with the dominant H1 uptrend.
- Avoid overleveraging near resistance, as volatility may spike during consolidation.
- Maintain Risk:Reward ≥ 1:2 on every setup.
- Only shift to a bearish bias if price breaks and closes below 4170 with strong momentum.
Conclusion:
Gold remains firmly bullish, and our previous buy setup has paid off handsomely. For today, the market is likely to move sideways between 4185 and 4220, forming a healthy accumulation zone before its next leg up. As long as 4170 holds, the trend is still our friend — we continue to buy the dips and aim for the 4240–4280 targets.
Stay disciplined, trust the plan, and let the market reward your patience.
WISH YOU THE BEST PROFIT!

Gold Trade Secured 400 PipsPerfect trade, with price sweeping BSL/London highs, respecting 4h FVG, BOS on the 15m to target SSL

XAUUSD (GOLD) is ready to sky rocket upwards!XAUUSD was in a short term downtrend for a few weeks but has now shown some clear bullish movements ahead. XAUUSD (Gold) has broken out of a downward trend channel that was acting as strong resistance, The price is very likely to head to the next resistance level which is marked as the take profit zone (green line). Time to buy!

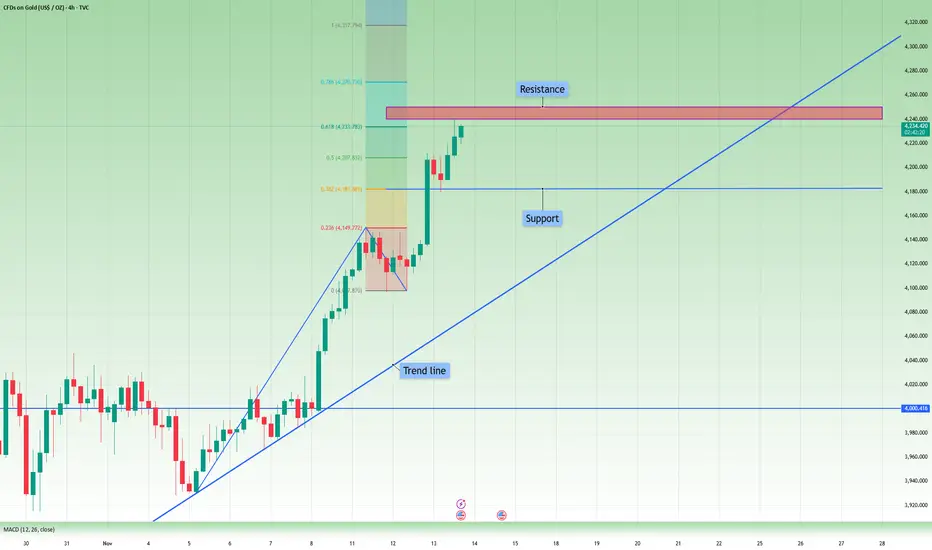
Gold Next zoneGold (XAU/USD) is trading near 4229, holding above support at 4211. A bullish move toward the 4300 target is expected if price breaks above resistance around 4238.

Gold Trade Set Up Nov 13 2025Gold is overbought and has taken out all BSL besides ATH so if price can stay closed below this bearish 4h FVG and engulf this 1h candle i will look for sells down to lower SSL levels but if it fails to close below and continues to make HH.HL on the 1h and 15 i will look for buys to continue higher

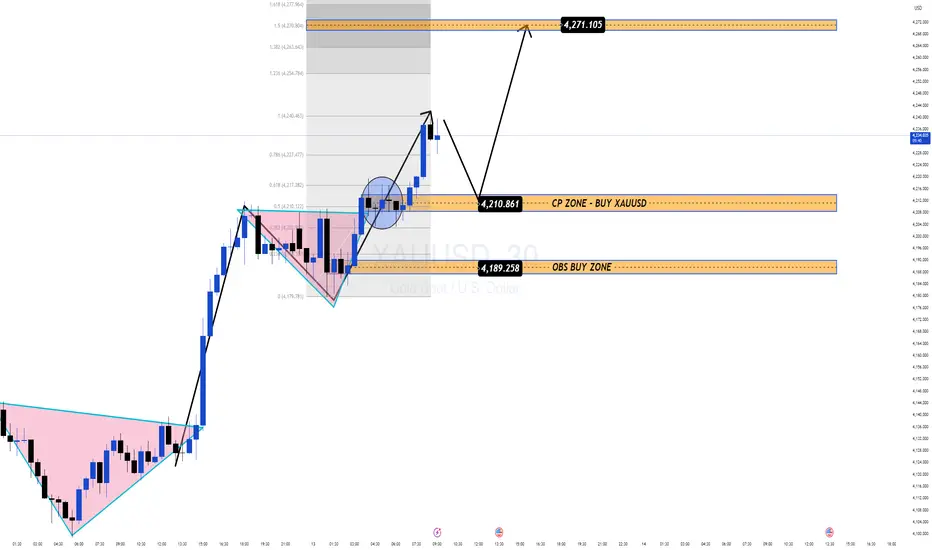
Gold Retesting CP Zone Before a Potential Rally Toward 4,270$Gold continues to respect its bullish structure after a clean breakout from the triangle accumulation pattern. The current pullback looks healthy and controlled, suggesting that price may simply be returning to key liquidity zones before launching the next impulse wave upward.
🔍 1. Market Structure – Clean Bullish Trend
Overall trend: Strong bullish on H1–H4.
Price broke out with momentum → beginning of a new impulse leg.
Recent correction tapped perfectly into the 0.382–0.50 Fibonacci area, confirming a typical bullish continuation pattern.
The key now is how price reacts around the CP Zone at 4,210 and the OBS Zone at 4,189.
📊 2. Key Technical Zones
🟩 CP BUY Zone: 4,210 – 4,211
• Fair retest zone
• Fibo confluence + prior breakout structure
→ High-probability reaction area.
🟧 OBS BUY Zone: 4,187 – 4,190
• 30m bullish Order Block
• Deep liquidity area where Smart Money often reloads
→ The “golden” buy zone if price sweeps deeper.
🎯 Primary Target
• 4,271$ (Fibo 1.618 extension + upper resistance)
→ Key expansion target for the ongoing bullish wave.
🔄 3. Trade Scenarios
Scenario 1 – CP Zone BUY (Priority)
If price retests 4,210 and shows bullish reaction → BUY continuation.
TP: 4,240 → 4,260 → 4,271
SL: Below 4,205
Scenario 2 – Deep Liquidity BUY (Alternate)
If price sweeps down into OBS 4,189–4,190, look for strong wick rejection → BUY.
TP: 4,220 → 4,240 → 4,271
SL: Below 4,180
🧠 MMFlow Insight
Trend remains undeniably bullish, no signs of reversal yet.
Pullbacks into CP/OBS are simply Smart Money accumulation phases.
As long as price holds above 4,189, the bullish bias remains dominant.
Expansion toward 4,27x is still the main roadmap.
👉 Avoid selling against the trend. Focus only on precision BUY setups at the right liquidity points.
Gold Maintains Uptrend, Watch for Pullback to Buy with Cash Flow🔍 Context & Market Structure
After a strong upward impulse from a low liquidity area, the price has broken the downtrend structure and formed a bullish BoS on H1.
Currently, gold is accumulating above the Support Zone at 4,183 USD after creating a new peak and leaving a FVG just below the current price .
Above is the Liquidity Zone $$$ around 4,232 USD – a concentration of sell-side stop losses and buy-side profit-taking orders, likely to create a “final push” that attracts liquidity.
=> Overall: the main trend remains bullish , prioritising waiting for a pullback to discount levels to buy with the trend rather than chasing orders at high levels.
💎 Key Technical Zones
Liquidity Zone $$$: around 4,232 USD – upper liquidity area, prone to profit-taking reactions.
Current FVG: price gap area just below the current price (around 4.20x) – expected to “fill the gap” before continuing.
Support Zone 1: 4,183 USD – nearest support, confluence with the area where the upward impulse began to slow.
Support Zone 2: 4,140 USD – stronger support, aligning with the old structure.
Liquidity Clear: 4,101 USD – lower liquidity area, if swept, it would be a very attractive discount for swing buyers.
📈 Proposed Trading Scenarios
1️⃣ Main Scenario – Buy with the trend at FVG / 4,183 USD
Priority to wait for the price to:
Either fill the FVG around 4.20x and show a rejection candle,
Or clearly retest Support 4,183 USD with a bullish reversal signal on M15–H1.
When a confirmation signal appears:
→ Consider buying (BUY) around 4.19x – 4.18x .
Stoploss: below 4,175 USD (below the nearest low and support).
TP reference:
TP1: 4,210 USD
TP2: 4,232 USD (Liquidity Zone $$$)
TP3: trailing if the price breaks through 4,232 and maintains the bullish structure.
2️⃣ Alternative Scenario – Deeper Pullback Before Continuing Upward
If the price clearly breaks 4,183 USD and closes an H1 candle below:
→ Avoid buying hastily, wait for the price to continue adjusting to Support 4,140 USD or even Liquidity Clear 4,101 USD .
At these zones, if there appears:
strong rejection candles,
or small reversal structures (bullish ChoCH on M15),
→ Then consider buying at a discount with better RR, targeting a return to 4,183 → 4,210 → 4,232 USD.
3️⃣ Short-term Sell Scenario (for experienced scalpers only)
If the price hits Liquidity Zone 4,232 USD but shows strong rejection (long wick, high sell volume):
→ Consider short-term sell scalp back to the 4.20x – 4,183 USD area.
This is a counter-trend trade, so:
keep the volume small,
short TP,
tight SL above the newly formed peak.
⚠️ Risk Management Notes
Do not FOMO buy when the price is testing near the 4.23x area – this is a prone-to-sell area.
Prioritise waiting for a pullback to FVG / Support for a better entry point and RR.
Always adjust volume according to actual SL, avoid over-leverage during strong market volatility.
“Buy the dip in liquidity zones, do not chase orders at the peak – that's how to go with the big money flow.”

Gold Holds 4200, Bulls Eye 4250Gold showed a fluctuating upward trend today, successfully standing firm above the critical 4200 level, with strong bullish momentum. Supported by multiple positive factors, there remains room for further upside, though potential volatility risks should be guarded against.
From the daily chart structure, Gold has steadily broken through the key integer level of 4200 and successfully stood above the 61.8% Fibonacci retracement level of the recent pullback range, presenting a favorable technical pattern. On the indicator front, both RSI and MACD remain in positive territory, indicating sufficient short-term upward momentum.
Key support levels below are concentrated around 4180 and 4100. If these critical levels can be held, the subsequent upward trend is expected to continue; a breakdown below them may trigger technical selling, dragging gold prices toward 4075 or even the psychological threshold of 4000.
If gold can continue to hold firmly above 4200, the next target range is expected to be 4250, with further potential to test 4300.
Trading Strategy:
Buy 4170 - 4180
SL 4160
TP 4210 - 4220 - 4230
Sell 4230 - 4240
SL 4250
TP 4210 - 4220 - 4190

ElDoradoFx – GOLD ANALYSIS (13/11/2025, LONDON SESSION)1. Market Overview
Gold enters the London session trading around $4,209–$4,211, maintaining strong bullish momentum following an impulsive rally from $4,180 demand. Price is currently compressing below the key liquidity region $4,219–$4,223, forming a bullish continuation structure. As long as $4,195–$4,188 holds, gold maintains a bullish bias with potential for a London breakout.
⸻
2. Technical Breakdown
🔹 Daily (D1)
• Price continues the recovery after the November pullback, trading strongly above the 20EMA & 50EMA.
• RSI ~64 shows strong bullish control.
• Next major daily resistance remains $4,260–$4,300.
• A daily close above $4,219 increases probability of continuation toward $4,260+.
🔹 H1
• Structural BOS at $4,205 → $4,219 confirms bullish continuation.
• Price consolidates inside a tight range under resistance $4,219–$4,223.
• Support zones: $4,204–$4,195 and $4,188.
• RSI above 50 → bullish structure stays intact.
🔹 15M–5M
• Higher lows forming at $4,198 / $4,202.
• Price coiling inside ascending structure → typical pre-breakout compression.
• If gold dips, buyers expected to defend $4,204–$4,195 (Golden Zone).
⸻
3. Fibonacci Analysis (Swing 4,180 → 4,219)
Level Price
38.2% 4,204
50.0% 4,199
61.8% 4,195
🎯 Golden Zone: 4,204 – 4,195
(The main rebuy zone if London retraces)
⸻
4. High-Probability Trade Scenarios
📈 BUY SCENARIO (Primary Bias)
Buy Zone: 4,204 – 4,195 (Golden Zone + HL structure)
🎯 Targets: 4,219 → 4,230 → 4,245
🛑 SL: Below 4,188
✔️ Confirmation: 5M–15M CHoCH or bullish engulfing from Golden Zone.
⸻
📉 SELL SCENARIO (Countertrend)
Sell Zone: 4,219 – 4,223 (weak high + liquidity sweep zone)
🎯 Targets: 4,210 → 4,202 → 4,195
🛑 SL: Above 4,230
✔️ Confirmation: Bearish rejection + RSI divergence.
⸻
💥 BUY BREAKOUT SETUP
Trigger: Break & H1 close above 4,223
Retest Zone: 4,219–4,220
🎯 Targets: 4,235 → 4,245 → 4,260
🛑 SL: Below 4,210
⸻
💥 SELL BREAKOUT SETUP
Trigger: Break & close below 4,188
Retest Zone: 4,188–4,194
🎯 Targets: 4,180 → 4,168 → 4,150
🛑 SL: Above 4,202
⸻
5. Fundamental Watch
• London quiet until US midday data.
• US PPI and job numbers may trigger volatility in the New York session.
• Dollar remains soft, supporting bullish continuation unless structure flips below 4,188.
⸻
6. Key Technical Levels
Resistance Levels
• 4,219
• 4,223
• 4,235
• 4,245
Support Levels
• 4,204
• 4,195
• 4,188
• 4,180
Golden Zone
➡️ 4,204 – 4,195
Breakout Triggers
• Bullish: > 4,223
• Bearish: < 4,188
⸻
7. Analyst Summary
Gold remains in a clear bullish structure, but price is currently hitting resistance at 4,219–4,223, where liquidity is stacked. A dip into the Golden Zone (4,204–4,195) is healthy before a continuation. If London holds above 4,195, breakout toward 4,245–4,260 is likely.
A full bearish shift only occurs with a break below 4,188.
⸻
8. Final Bias Summary
📊 Bias: Bullish above 4,195
🔻 Invalidation: Bearish shift below 4,188
🎯 Focus: Watch Golden Zone reaction or a breakout above 4,223
⸻
— ElDoradoFx PREMIUM 3.0 Team 🚀

The bullish trend remains unchanged; we remain bullish on gold.#XAUUSD OANDA:XAUUSD TVC:GOLD
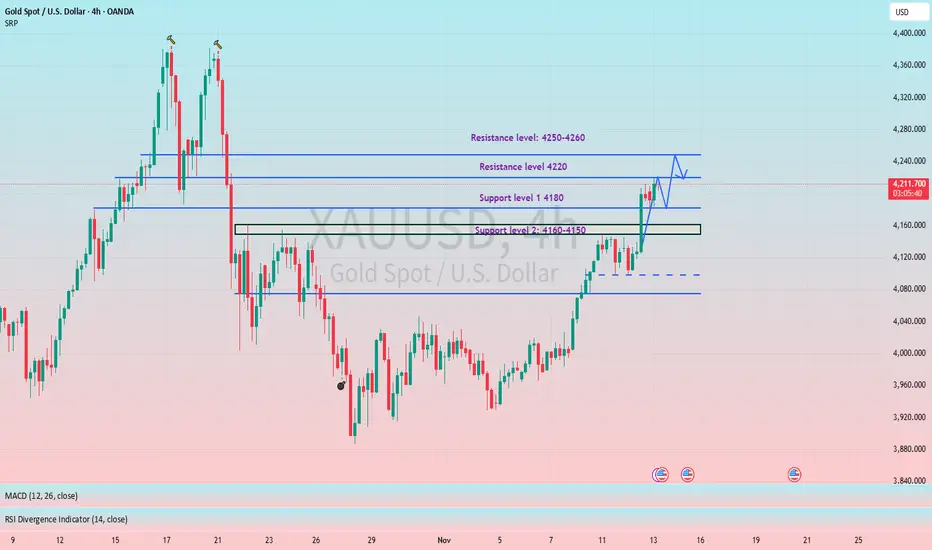
The daily chart is above the MA5 moving average, indicating that the bullish trend remains unchanged. However, we do not chase the price at high levels. Our core strategy is to wait for a pullback to support before going long. From the hourly chart, gold is fluctuating within the 4220-4180 range in the short term. If gold retraces to the short-term support of 4190-4180 during the European session, it is advisable to continue to go long on gold, with key support at 4160-4150. If the price rebounds to the previous high of 4250-4260, then yesterday's strategy remains valid.
Gold Hits 4150 Resistance: Healthy Correction or Reversal?1. What Happened in the Last 24 Hours
Gold delivered an impressive bullish surge of over 1000 pips, reaching the 4150 resistance zone — precisely the level mentioned in yesterday’s analysis. The move was nearly one-directional, with only a brief intraday retracement after crossing above 4100.
2. Market Context
Such a strong advance often leads to short-term exhaustion, and that’s exactly what we’re seeing now. After touching the 4150 resistance, the price has started to pull back, which appears to be a normal correction rather than a trend reversal.
3. Technical Outlook
The first key support for bulls lies near 4075, followed by the 4050 zone, which is now an important structural level. As long as these supports remain intact, the uptrend remains healthy and the probability of another bullish leg is high.
4. Trading Plan
I remain bullish on Gold and plan to buy dips toward 4075–4050 zones. A sustained hold above these levels could open the way for a retest of 4200 resistance in the next sessions.
If the price falls below 4050 with strong momentum, I’ll reassess the bias — but for now, the path of least resistance is still up.
5. Conclusion
Yesterday’s explosive rally confirmed the bullish structure, and today’s pullback looks like a healthy correction within an ongoing trend. As long as 4050–4075 holds, buying dips remains the smart play. 🚀

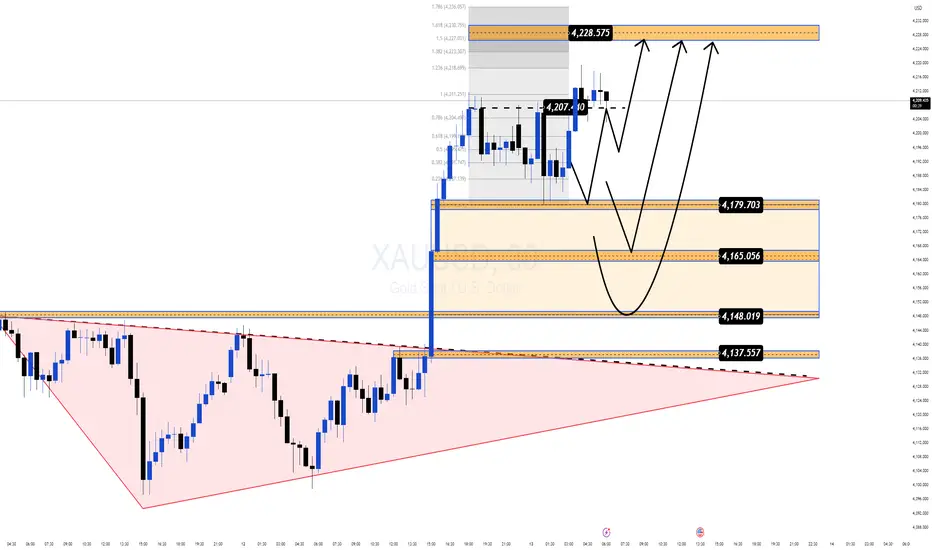
Gold Hits a 3 Week High but the Real Move Might Still Be LoadingGold just tapped $4,213 — the highest level in three weeks, powered by growing expectations of a dovish Fed and optimism around the potential reopening of the US government.
But the real story isn’t the headline spike — it’s the structure forming right beneath it.
📌 Why this zone matters right now
Price is pulling back into $4,179–$4,165, a clean Demand zone aligning with Fibo + breakout structure.
Buyers remain firmly in control despite a mild USD recovery.
The market swept liquidity around $4,207, hinting at accumulation before the next expansion.
The broader pattern resembles a falling-wedge breakout, often appearing before strong upside continuation phases.
🎯 Most Probable Scenario (Mind Insight)
Gold is in a “compression before expansion” phase.
Once this squeeze resolves, momentum is likely to continue in the direction that’s already dominant — and right now, that’s the bulls.
🔶 MMF BUY Zone
$4,179 → $4,165
Looking for a shallow pullback before the next leg.
🔼 Bullish Targets
• $4,207 (liquidity tap)
• $4,228 (Fibo 1.618)
• $4,236 (Fibo 1.786 — major reaction zone)
🧠 Key Takeaway
As long as Gold holds above $4,165, the bullish structure remains intact and the upside expansion toward the upper Fibo cluster stays in play.
Gold Momentum Extreme – Shorting Is High-Risk Despite Resistance1. What Happened Yesterday
Despite a weak start to the day that looked like the beginning of a deeper correction after Monday’s strong rally, Gold once again defended the 4100 interim support. Bulls quickly stepped in, and the market delivered yet another 1,000-pip bullish session — a pattern Gold has normalized these days.
2. Current Market Context
At the time of writing, price is hovering around the 4200 resistance zone, and the upside momentum remains extremely strong. Yes, after a 2,000-pip rise in just three days, a correction seems not only possible but probable.
However, we must also remember that last month Gold rallied 4,000 pips in a single week without any meaningful pullback — making short-term timing very tricky.
3. Technical Outlook
Key support levels to watch:
- 4150 – first intraday support
- 4100 – strong structural level
- 4050 – major swing support and line in the sand for bulls
Resistance levels:
- 4200 – current zone being tested
- 4280 – next clear target
- 4400 – all-time-high resistance
The structure remains bullish, but stretched.
4. Trading Plan
For swing traders, this is a difficult location to initiate new positions in either direction.
I personally prefer to buy only if Gold pulls back under 4100, where the risk-reward becomes more reasonable.
As for short trades, the combination of strong momentum and last month’s parabolic behavior makes them very high risk, even in strong resistance.
5. Conclusion
Gold remains in a powerful uptrend, and although a correction is likely, timing it is extremely challenging. Until we see a deeper pullback, I remain patient and only consider buys from lower support zones, preferably below 4100. 🚀

Gold Price Outlook – Trade Setup (XAU/USD)📊 Technical Structure
OANDA:XAUUSD Gold (XAU/USD) extended its bullish run, reaching a new three-week high around $4,213, before encountering selling pressure near the Resistance Zone ($4,210–$4,216). The metal is now consolidating, with intraday support forming near $4,183–$4,188, aligning with the previous breakout level.
The short-term structure suggests a potential corrective dip before another push higher, as long as support holds above $4,181. A retest of the $4,212–$4,216 zone remains the primary upside target, while failure to sustain above support could expose the $4,170 area.
🎯 Trade Setup
Idea: Buy on dip near support, targeting retest of recent highs.
Entry: $4,188 – $4,183
Stop Loss: $4,181
Take Profit 1: $4,211
Take Profit 2: $4,216
Risk–Reward Ratio: ≈ 1 : 4.23
A close below $4,180 would invalidate the bullish setup, suggesting deeper retracement toward $4,170–$4,165.
🌐 Macro Background
Gold remains well-supported amid dovish Fed expectations and lingering economic concerns, despite a stronger risk appetite following the U.S. government reopening.
FXStreet’s Haresh Menghani commented that “Gold hits a three-week top as dovish Fed bets offset U.S. government reopening optimism.” 【FXStreet】
Fed Policy Outlook: Markets are pricing in roughly a 60% chance of a 25-basis-point Fed rate cut in December, as weak job data and soft inflation expectations weigh on the U.S. Dollar.
Labor Market Signs: Revelio Labs reported 9,100 job losses in October, with government payrolls down by 22,200, while the Chicago Fed noted a slight uptick in unemployment — reinforcing the view that economic momentum is fading.
Government Reopening: The U.S. Senate’s approval of a funding bill ended the longest government shutdown in history, sparking risk-on sentiment in equities. While this reduces safe-haven demand, the weaker macro backdrop keeps gold resilient.
Fed Commentary: Atlanta Fed President Raphael Bostic acknowledged that the job market remains balanced but warned against easing too slowly, emphasizing limited inflation risk — a stance the market interprets as mildly dovish.
In short, while risk sentiment caps near-term upside, monetary easing bets and weak macro data continue to underpin gold’s medium-term strength.
🔑 Key Technical Levels
Resistance: $4,211 – $4,216
Support: $4,183 – $4,188
Psychological Level: $4,200
📌 Trade Summary
Gold remains bullish above $4,183, with the bias favouring a buy-on-dip approach. As long as support holds, the metal is likely to rebound toward $4,211–$4,216, following its breakout momentum from earlier this week. The underlying macro tone continues to favour buyers in the medium term.
⚠️ Disclaimer
This analysis is for reference only and does not constitute trading advice. Trading involves significant risk, and proper risk management is essential.

Gold: The broader bullish trend remains unchangedGold held the key 4100 level today, indicating that the current market sentiment still leans bullish. This aligns with my proposed strategy of buying on pullbacks. During the U.S. session today, gold's bullish momentum continued to break through, reaching a high around 4211.
For support below, we should focus on the 4145-4150 zone. I have consistently emphasized that the broader trend remains bullish, so it's advisable to avoid trading against the trend. Operationally, prioritize buying on pullbacks.

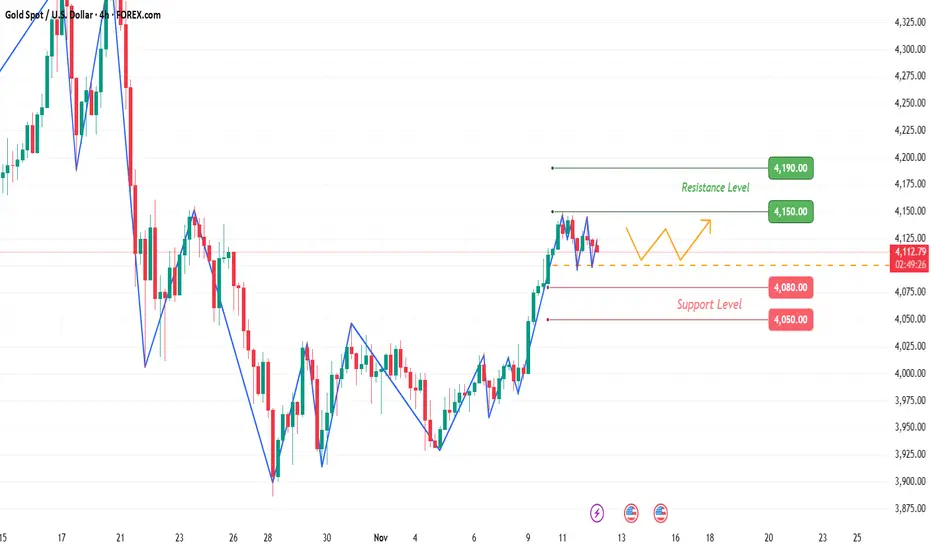
Gold: Intense long-short rivalry.There has been intense long-short rivalry in gold today, and in the short term, focus should be on the breakthrough of key levels and the effectiveness of support.
Continue to keep a close eye on the 4150-4160 resistance zone above. If it can be successfully broken through, there may be a new upward wave ahead, potentially even moving towards the 4190-4195 range.
For the downside, pay attention to the support around 4080. If the critical support level of 4080 USD is breached, it may trigger follow-up selling, further pushing gold prices down to around 4050.
Overall, in terms of operations, we should patiently wait for entries at key levels and avoid blindly following the trend.
Trading Strategy:
Buy 4090 - 4100
SL 4070
TP 4130 - 4140 - 4150
Sell 4160 - 4165
SL 4170
TP 4120 - 4110 - 4100
XAUUSD🟡 #Xauusdgold testing key resistance near 4190–4200 after a strong rally.
Breakout above = 🚀 targets 4240 / 4288 / 4369
Rejection = 🩸 short-term pullback likely.
Momentum strong; watch volume for confirmation.

Gold
After a strong bullish move, I was expecting a correction.
Now the price has entered the correction phase, and I’m waiting at the marked level on the chart to take a long position if a proper signal appears ✅

technical analysis for your chart on Gold (XAU/USDEUREX:FDAX1! EUREX:FDXS1! EUREX:FDXM1! ICEEUR:NCF1! ICEEUR:Z1! ICEEUR:RC1! EUREX:FGBX1! EUREX:FXXP1! ICEEUR:R1! ICEEUR:SOA1! Current Price: $4,002
Trend Structure: The pair is showing a potential reversal setup after a completed downward channel.
Recent Pattern: Price has broken slightly above the descending channel and is now retesting the breakout zone around the support level ($3,950–$3,980).
🔹 Key Technical Levels
Support Zone: $3,940 – $3,980
→ Strong accumulation area shown by multiple rejections and previous demand.
Immediate Resistance: $4,080 – $4,120
→ Minor resistance expected as the first hurdle after breakout.
Major Resistance (Target): $4,385
→ Marked as the final bullish target on the chart.
📈 Bullish Scenario
If price sustains above $4,000, we can expect:
A short-term retest of $4,080–$4,120.
Once momentum confirms above $4,120, bullish continuation toward $4,200 → $4,385 (main target).
✅ Buy Confirmation:
Break and close above $4,050 with volume.
Retest of $4,000 zone followed by bullish rejection candle.
🎯 Bullish Targets:
TP1: $4,080
TP2: $4,200
TP3: $4,385
📉 Bearish Scenario
If price rejects $4,000 and closes below the support zone ($3,950):
Downside may resume toward $3,880 – $3,820 range.
That would invalidate the bullish breakout and confirm channel continuation.
🚫 Sell Trigger:
3H close below $3,940.
🎯 Bearish Targets:
TP1: $3,880
TP2: $3,820
📊 Conclusion
Structure is shifting from bearish to bullish after a channel breakout.
The $3,950–$4,000 area is key — a stronghold for bulls.
Expect a bullish rally if support holds, targeting $4,385 in the medium term.

Gold (XAU/USD) Technical Analysis based on your 15-minute chart:Support Level: 4,100 – 4,106
Resistance Zone: 4,120 – 4,125
Target Point: 4,147
Trend Bias: Short-term corrective upward trend within a broader pullback phase.
📈 Scenario 1 – Bullish Setup
If price continues to hold above the support zone (4,100 – 4,106):
Expect a rebound toward 4,120 (minor resistance).
A breakout above 4,120 could trigger further buying toward the target point at 4,147.
This move aligns with the projected ascending channel shown on the chart.
Confirmation Trigger: Bullish breakout and sustained candle close above 4,120.
📉 Scenario 2 – Bearish Continuation
If g RUS:SI1! RUS:GD1! RUS:MX1! RUS:USDRUB.P RUS:RI1! RUS:IRUS.P RUS:SV1! RUS:CR1! RUS:CNYRUB.P RUS:HS1! old breaks below 4,100:
Selling pressure could resume, driving price down to 4,085 – 4,080.
A break below 4,080 would confirm deeper correction and invalidate the bullish setup.
⚖️ Summary
Bias Entry Zone Target Stop Loss
Bullish (Buy) 4,106 – 4,112 4,145 – 4,150 4,095
Bearish (Sell if break below) < 4,100 4,085 – 4,080 4,120
💬 Analyst Note
The market is showing short-term accumulation after a selloff. Watch for volatility around 4,110–4,120; momentum confirmation is key before taking a position. RUS:NG1! RUS:BR1!
