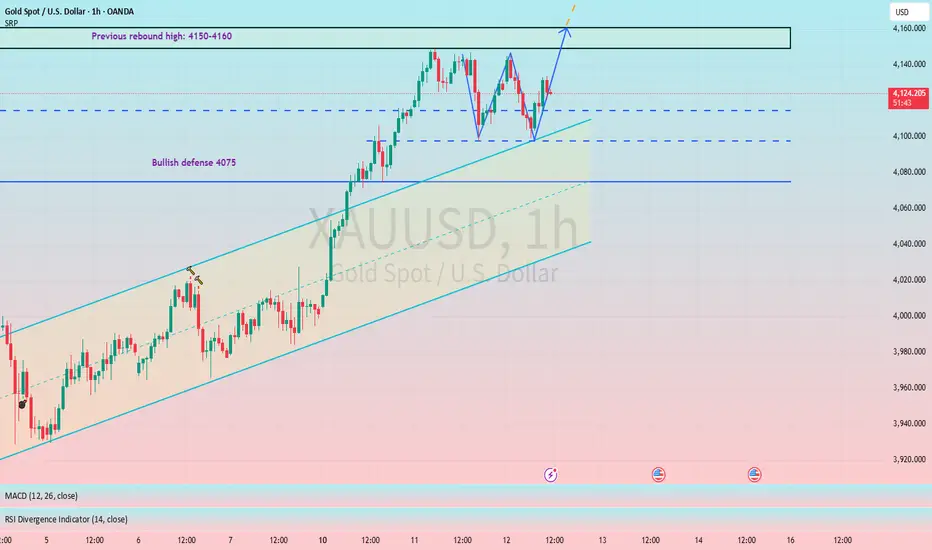
A W-shaped pattern is emerging, indicating a bullish outlook.#XAUUSD TVC:GOLD OANDA:XAUUSD
Gold prices trended downwards during the Asian session, leading many to believe the market has begun to reverse. However, I disagree. As I clearly stated yesterday, as long as the key support level of 4075 is not broken, we will maintain our bullish outlook, and we will continue to follow this strategy today.
From the hourly chart, gold prices are showing signs of forming a W pattern. If the neckline is broken, gold prices will continue to rise, testing the 4150-4160 range. A strong breakout could see prices reach 4180, or even 4200.
Xauusdupdates
Gold Trade Set Up Nov 12 2025Price is trading within a range between PDH and PDL and has swept both internal BSL and SSL so i will wait for more structure to be formed on the 5m looking for buys either from internal SSL or for price to push lower to PDL before looking for buys from that level. Theres also daily FVG under PDL which will act as strong support if it reaches there

Short-term gold trading plan: buy low and sell highAfter a surge on Monday, gold prices traded sideways at high levels yesterday and today. This sudden shift in momentum was primarily due to news that the US government might end its shutdown.
On the surface, an end to the shutdown implies a crisis easing, which is typically beneficial for the US dollar and detrimental to gold. Therefore, in the short term, gold's upward momentum will likely be suppressed, potentially leading to a correction.
From a technical perspective, gold prices are currently oscillating between 4100 and 4150. The price has tested the 4150 resistance level three times since yesterday and failed to break through, indicating that this has become a key resistance level. The 4100 level has also been tested twice, suggesting strong support. Therefore, short-term trading should focus on buying low and selling high within the 4100-4150 range.
If gold prices break out of this range, we will need to revise our trading plan.
Markets are volatile, and with frequent news events expected soon, it is crucial to set stop-loss and take-profit orders to avoid getting trapped in a losing position.

XAUUSD Trade Setup: Gold at Resistance, Here's my Trade PlanXAUUSD Gold has seen a strong rally recently, pushing into a key resistance zone 🧱. With capital currently rotating out of safe-haven assets like gold and flowing into the stock markets, we could see a potential pullback from this level. 📉
At the moment, I’m avoiding buying at a premium price. Instead, I’ll be watching for a retracement back into equilibrium — around the 50% level of the recent swing range ⚖️.
If price pulls back, then breaks market structure to the upside, that could confirm renewed bullish momentum, and I’ll be looking for a long entry setup from that point. 🚀
⚠️ This analysis is for educational purposes only and not financial advice.

"Trading is a lonely journey, but the most rewarding""Trading is a lonely journey."
I had heard that saying a long time ago, but only when I stepped onto this path did I truly understand what it meant. On the first day I placed a trade, I thought everything was simple , just a few clicks, a few flickering green and red numbers, and I could make money. But the deeper I went, the more I realized that behind the screen was a cold, silent world where I was the only one facing myself.
No one understands the feeling of watching your account evaporate in just a few seconds. Nor can anyone share the tiny joy of a winning trade, because most outsiders only see the results — not the sleepless nights, not the heartbeats racing with every moving candle. Gradually, I learned to stay quiet : no more bragging about profits, no more complaining about losses. Trading taught me that emotions are the cruelest enemy.
There are days I stare at the chart until my eyes ache, my head spinning from those merciless price waves. I ask myself, “Am I really going in the right direction? Is trading even meant for me?” But then, in silence, I open my laptop again - analyze, take notes, place orders, as if it’s a habit I can’t let go of. Every loss hurts, but it also makes me stronger . I’ve learned to accept being wrong, to be disciplined, and to live with loneliness.
Trading isn’t just a battle with the market, it’s a battle with your own ego . It’s lonely, yes, but not meaningless. In that silence, I can hear my own thoughts more clearly ,my limits, and my desire to rise beyond them. Maybe only those who have walked this path can truly understand: behind every click lies countless emotions, unseen scars that only traders carry.
Trading is a lonely journey — but it’s also one of the most valuable journeys of all.
Try harder my friend! ;)
ANFIBO_
ANFIBO | XAUUSD - Better Buy than Sell today [11.12.2025]Hello guys, Anfibo's here!
XAUUSD Analysis – Daily Trading Plan
Overall Picture:
OANDA:XAUUSD is currently trading within a sideways range between 4145 and 4100, showing signs of compression as the market awaits a potential breakout. After an extended bullish phase, price is now consolidating, creating equilibrium between buyers and sellers before the next directional move. The nearest key support zone lies between 4075 – 4095, followed by deeper demand areas around 4040 and 4006, which could serve as ideal buy setups if price retraces. Given the overall market structure and sustained bullish sentiment, I continue to favor Buy positions over Sell setups for today’s session.
Trading Plan for Today:
>>> BUY ZONE:
(1) ENTRY: 4075 – 4090
SL: 4070
TP: 4130 – 4150
(2) ENTRY: 4035 - 4045
SL: 4030
TP: 4090 – 4120 – 4150
(3) ENTRY: 4110 - 4115 (scalp/small vol)
SL: 4100
TP: 4140 - 4150
Risk Management:
- Prioritize Buy setups in line with the dominant trend; Sell only for short-term scalps.
- Keep stops tight, as a breakout can invalidate range setups quickly.
- Maintain a Risk:Reward ratio ≥ 1:2 on all trades.
- Avoid overtrading before the breakout confirmation.
Conclusion:
OANDA:XAUUSD is currently consolidating within a narrow sideways channel, but momentum continues to favor the bulls. As long as the price holds above 4075, the structure remains constructive, and the next bullish leg could form anytime upon breakout confirmation. My bias today stays bullish, focusing on buying dips near key supports and managing risk tightly until the market reveals its next move.
HAVE A WONDERFUL DAY, GUYS! ;)

XAU/USD – Price Accumulating in a Narrow Range, Ready to Expand⏰ Timeframe: 30m
📅 Update: 11/12/2025
🔍 Market Context
Gold maintains a neutral structure after forming a Change of Character (CHoCH) around the 4,144 USD area.
Yesterday's session witnessed a narrow fluctuation between the Demand Zone – Support Zone, indicating the market is absorbing liquidity before determining the next direction.
The medium-term upward momentum remains unbroken, but the price needs a clear balancing phase before continuation.
📊 Technical Structure
Demand Zone (4,144 USD): a short-term supply – demand area where the market previously reacted strongly, now becoming a potential testing zone.
Support Zone (4,099 USD): confluence structure – an area where buying flows may return when the price retests.
Order Block (4,081 USD): a deep defensive zone, corresponding to the main Discount area in the current cycle.
Equal Lows (EQL) & CHoCH: indicate a short-term transition between two sides, but the overall bias slightly leans towards an increase.
🎯 Market Outlook
High probability scenario for the day:
1️⃣ Price may fluctuate within the 4,099–4,144 USD balance zone to attract liquidity.
2️⃣ If a strong reaction occurs from the Support Zone or Order Block, gold may establish a new upward move towards 4,165–4,180 USD.
3️⃣ Conversely, if the price closes below 4,081 USD, the short-term structure will temporarily shift to neutral, prioritizing a re-accumulation phase.
🧠 Analyst’s View
Current price behavior reflects a “pause phase” in the larger upward structure.
When the market balances at lower levels, the key observation is not the bounce, but the reaction when liquidity is swept — where the true momentum of the trend is reignited.
As long as the price does not break the 4,081 USD mark, the medium-term upward trend remains intact.
🛡️ Risk Note
This is a technical analysis, not investment advice.
The market can change rapidly during US sessions – wait for clear confirmation from price action before participating.

XAU/USD 12 October 2025 Intraday AnalysisH4 Analysis:
-> Swing: Bullish.
-> Internal: Bullish.
Analysis and bias remains the same as analysis dated 20 October 2025.
Price has printed as per previous intraday expectation by printing a bearish CHoCH which indicates, but not confirms, bullish pullback phase initiation.
Price is currently trading within an established internal range, however, I will continue to monitor price with regards to depth of pullback.
Intraday expectation:
Price to continue bearish, react at either discount of 50% internal EQ, or H4 supply zone before targeting weak internal high priced at 4,380.990.
Note:
The Federal Reserve’s sustained dovish stance, coupled with ongoing geopolitical uncertainties, is likely to prolong heightened volatility in the gold market. Given this elevated risk environment, traders should exercise caution and recalibrate risk management strategies to navigate potential price fluctuations effectively.
Additionally, gold pricing remains sensitive to broader macroeconomic developments, including policy decisions under President Trump. Shifts in geopolitical strategy and economic directives could further amplify uncertainty, contributing to market repricing dynamics.
H4 Chart:
M15 Analysis:
-> Swing: Bullish.
-> Internal: Bearish.
You will note how price remains contained in consolidation between a supply and demand zone. The rest of my analysis and bias remains the same as bias date 29 October 2025.
As expected, price has printed a bullish CHoCH to indicate bullish pullback phase initiation.
Price is now trading within an established internal range.
Intraday expectation:
Price to continue bullish, react at either premium of internal 50% EQ or M15 demand zone before targeting weak internal low, priced at 3,886.465.
Note:
Gold remains highly volatile amid the Federal Reserve's continued dovish stance, persistent and escalating geopolitical uncertainties. Traders should implement robust risk management strategies and remain vigilant, as price swings may become more pronounced in this elevated volatility environment.
Additionally, President Trump’s tariff announcements, particularly against China, are expected to further amplify market turbulence, potentially triggering sharp price fluctuations and whipsaws.
M15 Chart:

Gold Correction Setup – Watch 4,060 Zone📊 Market Structure
After completing the structure break (ChoCH + BoS) at the 4,080 USD zone, gold has sustained a strong upward momentum and created Equal High 4,140 – 4,145 USD , corresponding with the short-term resistance Order Block .
Currently, the price is technically reacting in this area, indicating short-term profit-taking pressure from buyers after a prolonged rally.
The H1 structure remains bullish as the main support zones have not been broken.
A potential scenario is that the price will adjust to FVG zones or support to absorb liquidity before bouncing towards the Liquidity Zone 4,197 USD — the upper liquidity peak.
💎 Key Technical Zones
• OB & Resistance: 4,127 – 4,140 USD
• Support Zone: 4,104 – 4,107 USD
• FVG Zone #1: 4,060 – 4,067 USD
• FVG Zone #2: 4,031 – 4,037 USD
• Liquidity Target: 4,197 USD
🎯 Trading Plan
1️⃣ SELL Setup – Pullback Scalping
If the price reacts sharply downward at the OB zone 4,127 – 4,140 USD:
• Entry: 4,132 – 4,137
• SL: 4,150
• TP1: 4,104
• TP2: 4,067
→ Short-term trade, leveraging the pullback to the support zone to prepare for the next BUY setup.
2️⃣ BUY Setup – Continuation
When the price completes its adjustment to the FVG or Support Zone and a bullish signal appears (rejection / engulfing):
• Entry: 4,067 or 4,037
• SL: 4,020
• TP1: 4,140
• TP2: 4,197
• TP3: 4,210
→ Main setup in the current trend. Prioritize buying at the discount zone after sufficient liquidity is absorbed at the lower zone.
🧠 Vincent’s View
The H1 structure remains buyer-favored. Current adjustments are technical, not reversals.
The FVG zone around 4,060 USD is a key point to observe price behavior — if a clear reaction occurs, this could be the starting point for the next upward wave to 4,197 USD .
“Liquidity fuels the next move — let the market breathe before the impulse.” ⚜️
⏰ Timeframe: 1H
📅 Updated: 11/12/2025
✍️ Analysis by: Captain Vincent

XAUUSD H1 – Liquidity Sweep & Smart Reentry ZoneAfter a strong impulsive rally, gold reached the premium zone (1.5–1.618 extension) and created a set of Equal Highs (BSL) — a clear liquidity pool above 4148.
I’m anticipating a short-term retracement before continuation, as smart money often rebalances after grabbing liquidity.
🔹 Technical Breakdown (SMC Flow)
Sell Zone (Supply / OB): 4224 – 4228 (SL 4235)
→ Price reached the extreme of a premium H1 OB, aligning with FIB 1.5–1.618.
→ This area remains a valid sell-to-buy reaction zone if M15 shows a CHoCH.
Buy Zone (Demand / OB): 4086 – 4082 (SL 4070)
→ Confluence with 0.5–0.618 retracement and previous structure base.
→ Expecting sell-side liquidity sweep into this zone before a bullish continuation.
Target Zone: 4158 – 4160
→ The next Buy-Side Liquidity (BSL) resting above Equal Highs.
→ Ideal take-profit area for intraday longs from discount levels.
📈 My View
The bias remains bullish on H1, as long as 4070 holds.
I’ll patiently wait for a liquidity sweep into BUY zone followed by a clear M15 CHoCH confirmation — that’s where I’ll look for entries toward 4158–4160.
💭 Note from Karina
This structure perfectly reflects how liquidity drives movement — not emotion, not indicators.
Patience and precision are the true edge of a trader.
This is my personal view based on SMC principles – not financial advice.
Like & Follow for daily London session updates 💛

After Multiple 4150 Rejections, Gold Eyes Support at 40501. What Happened Yesterday
After an intraday correction, Gold once again tested the 4150 resistance zone, then pulled back toward 4100, only to rebound and touch 4150 again later in the session. Each attempt to break higher was rejected, sending the price back toward interim support.
2. Market Context
Multiple failed breaks above 4150 suggest that the market is not yet ready to extend the rally from Monday. The current price action points to a likely continuation of the correction, as the market digests the strong bullish move from earlier in the week.
3. Technical Outlook
The 4045–4060 zone stands out as a key confluence support, aligning with previous resistance and short-term rising trend line. A dip into this area would be a healthy pullback within the broader uptrend and could attract renewed buying interest from bulls.
4. Trading Plan
My preferred approach is to buy dips into 4045–4060, with invalidation below 4030. This setup offers an attractive risk-reward profile, targeting a retest of 4150 on the next bullish leg.
As long as the support zone holds, the bullish structure remains intact and upside continuation remains the higher-probability scenario.
5. Conclusion
Gold is consolidating after its sharp rally, and short-term correction is part of the process. I remain bullish above 4040-4050 zone, expecting buyers to step back in near support and potentially push for another test of 4150 soon. 🚀

XAUUSD buy setup again !Short-term bullish continuation toward Wave 5 projection.
.
I’m tracking this move as the early leg of Wave 5 — expecting a sharp impulse once momentum confirms breakout above Wave 3
wait for reversal structure change to confirm entry
FXOPEN:XAUUSD

Gold Consolidating Above 4,110$: The Next Wave Is Loading📊 Technical Overview (H1)
Gold is holding firm around the 4,110$ zone, where a clear liquidity pocket has formed after a short-term correction from last week’s rally. The market continues to build a higher-low structure, showing that bulls are quietly absorbing supply before the next impulsive leg.
Price is currently balancing between support at 4,085$ – 4,113$ and resistance at 4,146$ – 4,172$.
A clean break above 4,146$ could trigger the next bullish leg targeting 4,203$, while a temporary dip toward 4,085$ would still remain within the bullish structure.
🎯 Scenarios to Watch:
• Bullish Scenario: If price holds above 4,113$, expect a breakout toward 4,172$ → 4,203$.
• Pullback Scenario: A retest to 4,085$ could act as a liquidity sweep before continuation.
🧠 MMFLOW Insight
“Smart Money doesn’t chase momentum — it builds it. The current range is the calm before the next move.”
⚜️ Bias: Bullish as long as price stays above 4,085$

Gold Price Outlook – Trade Setup (XAU/USD)📊 Technical Structure
OANDA:XAUUSD Gold (XAU/USD) extended its advance, reaching $4,147–$4,156, its highest level in over two weeks. The structure shows a bullish bias as the price consolidates above $4,120, with buyers likely to defend the Support Zone at $4,105–$4,111.
The Resistance Zone at $4,147–$4,156 aligns with a short-term overbought area where some profit-taking may occur. However, as long as the price remains above the $4,111 support, momentum favours a continued push toward the upper boundary of the channel.
🎯 Trade Setup
Idea: Buy near support, targeting a retest of resistance at $4,150–$4,156.
Entry: $4,111 – $4,106
Stop Loss: $4,105
Take Profit 1: $4,147
Take Profit 2: $4,156
Risk–Reward Ratio: ≈ 1 : 6.53
A confirmed break below $4,105 would invalidate this setup and may trigger a correction toward $4,092.
🌐 Macro Background
Gold’s momentum remains firm, buoyed by rising Fed rate-cut expectations and soft U.S. labour data, even as the U.S. government shutdown nears resolution.
FXStreet’s Lallalit Srijandorn noted, “Gold extends gains toward $4,150 as weaker U.S. jobs data and dovish expectations lift investor sentiment.” 【FXStreet】
Labor Market Weakness: According to ADP data, U.S. private-sector job creation fell by an average of 11,250 jobs per week in late October — signalling a slowdown in labour demand after the firm previously reported gains. This reinforces expectations that the Fed could deliver another rate cut by year-end.
Fed Outlook: The CME FedWatch Tool indicates a 68% probability of a 25 bps rate cut in December, and nearly 80% odds by January 2026, supporting gold’s medium-term bullish tone.
Government Shutdown Update: Bloomberg reported that the U.S. Senate passed a temporary funding measure backed by centrist Democrats, expected to end the record-long shutdown. This could marginally reduce safe-haven demand but is unlikely to shift gold’s structural momentum, as macro risks persist.
Fed Speakers Ahead: Comments from Fed officials John Williams, Christopher Waller, Raphael Bostic, and others later today may offer further guidance on the December policy path. Any dovish tone could extend gold’s rally beyond $4,156.
In short, while the resolution of the shutdown could momentarily weigh on gold’s safe-haven appeal, soft employment data and high odds of a December rate cut remain powerful bullish drivers.
🔑 Key Technical Levels
Resistance: $4,147 – $4,156
Support: $4,106 – $4,111
Psychological Level: $4,150
📌 Trade Summary
Gold remains supported above $4,110, with strong upward momentum likely to retest $4,147–$4,156. A buy-on-dip strategy near $4,111–$4,105 remains preferred as long as support holds. The bullish bias persists while the Fed cut outlook strengthens.
⚠️ Disclaimer
This analysis is for reference only and does not constitute trading advice. Trading involves significant risk, and proper risk management is essential.

My predictions and analysis of gold todayMy predictions and analysis of gold today were consistent with the day's market conditions:
1-Accurate judgment on support levels: The key support level at 4100 remained solid, and gold prices rebounded after hitting the bottom at this level, verifying the effectiveness of this support.
2-Consistency between oscillation/breakout forecasts and actual trends: Gold made multiple attempts to break through the 4145 resistance level but pulled back under pressure, with the high-level narrow-range oscillation in line with expectations. It was also clearly indicated that a breakout from the narrow range was likely during the U.S. session.
3-Effective trend and strategy guidance: The trading strategy provided in the morning aligned with gold's price movement, and the core strategy of prioritizing buying on pullbacks was emphasized, which fit the actual market rhythm.
4-Risk reminder: It was advised that one should not blindly chase the upward trend to avoid losses.

#XAUUSD: We are up 1040+ pips from our previous setup! Gold has risen from 3268 to 3364, helping us make substantial positive gains. However, after reaching the $3364 region, the price dropped around 3310 and has since been fluctuating between 3310 and 3340, making it challenging to trade. There’s a possibility that the price might touch 3400 once again before it drops.
Good luck and trade safely.
Thanks for your support! 😊
If you want to help us out, here are a few things you can do:
- Like our ideas
- Comment on our ideas
- Share our ideas
Team Setupsfx_
❤️

#XAUUSD :Is it a Correction Or a start of Major Bearish Trend? Gold has plummeted from 3550 to 3270, and it’s been falling steadily. We firmly believe that the price could reverse from either of our entry points, but given its significant drop, it raises concerns among traders. If the trend has shifted to bearish, it will likely continue to target buyers’ stop losses. In these market conditions, we strongly advise trading with utmost caution and prioritising risk management.
Good luck and trade safely.
Thanks for your support! 😊
If you want to help us out, here are a few things you can do:
- Like our ideas
- Comment on our ideas
- Share our ideas
Team Setupsfx_
❤️

#XAUUSD: Major Update 01/05/2025, Read Description! Gold has dropped over 700 pips since yesterday evening, suggesting further price correction. This is primarily due to strong US dollar data indicating potential correction in DXY Index prices. Additionally, there are speculations that the US has reached out to China for trade talks, although this has not been confirmed. Today and tomorrow are major trading days, with significant news expected to shape gold prices.
For now, you can monitor the prices or take entry if they reach your chosen risk management area. The decision to enter or exit is entirely up to your analysis.
Good luck and trade safely!
Thank you for your unwavering support! 😊
If you’d like to contribute, here are a few ways you can help us:
- Like our ideas
- Comment on our ideas
- Share our ideas
Team Setupsfx_
❤️🚀

XAUUSD(GOLD): +1874 PIPS Target| Touching $3600? Gold experienced a significant price surge, driven by the ongoing conflict between Iran and Israel. This heightened uncertainty among global investors led to a price touch of $3445. The current price is accumulating, and we anticipate a strong bullish distribution in the near future. Please prioritise accurate risk management during trading.
Good luck,
Team Setupsfx_

Gold Trade OpportunityOANDA:XAUUSD
Gold started this week with an impulsive move from the demand zone (3869.29) and is currently at the resistance level (unmitigated H4 supply) at 4145 to 4130.
We could see price sell off to the levels of 4058 for a liquidity sweep and
alternatively Gold could perform a counter trend then continue its bullish run to towards 4360
Waiting for confirmation at the marked key level to make a clear and informed trading decision

XAU/USD – Gold Reaches Supply Zone Prepare for a Pullback to FVg📊 Market Structure
Gold continues to maintain its bullish structure after breaking the structure high (BoS) at the 4,000 USD zone and forming a steep bullish channel over the past 3 sessions.
Currently, the price is precisely hitting the Order Block 4,140 – 4,150 USD — a critical supply zone formed from the previous distribution.
The H1 candle is showing slight technical reaction signs , implying the potential for a short pullback to re-accumulate liquidity.
If a pullback occurs, the Premium Zone 4,080 – 4,085 USD and FVG 4,025 – 4,035 USD will be ideal areas to look for buy signals.
The bullish structure is only invalidated if the H1 candle closes below the Support 4,006 USD zone.
💎 Key Technical Zones
• Order Block: 4,140 – 4,150 USD → main supply zone, where profit-taking pressure appears
• Premium Zone: 4,080 – 4,085 USD → medium-term rebalancing zone
• FVG Zone: 4,025 – 4,035 USD → potential discounted price zone for BUY orders
• Support Zone: 4,000 – 4,006 USD → critical defense zone
🎯 Trading Plan
1️⃣ SELL Scalp – Reaction at OB 4,145 USD
If the price continues to react downwards at the 4,140 – 4,150 USD supply zone:
• Entry: 4,143 – 4,147
• SL: 4,155
• TP1: 4,085
• TP2: 4,035
→ Short-term setup, targeting the rebalancing zone before buying back in line with the trend.
2️⃣ BUY Setup – Continuation from FVG Zone
When the price pulls back to the FVG / Premium Zone and creates a confirmed bullish signal:
• Entry: 4,030 – 4,035
• SL: 4,006
• TP1: 4,090
• TP2: 4,145
• TP3: 4,170
→ Trend-following setup, preferred when the price re-accumulates and a clear rejection appears.
🧠 Vincent’s View
Buyers still control the market, but the current OB touch may trigger a short pullback before the bullish wave continues.
The ideal scenario is “tap OB → pullback FVG → continuation,” maintaining a stable bullish structure towards the 4,170 USD target.
“Buy the dip where fear replaces greed — that’s where the next impulse begins.” ⚜️
⏰ Timeframe: 1H
📅 Updated: 11/11/2025
✍️ Analysis by: Captain Vincent

#XAUUSD: Will There Be Major Price Correction On Gold? Dear Traders,
Gold has been rallying with strong bullish momentum and has not experienced a major correction since the last few weeks. We have identified a key level from which the price can continue its bullish momentum if fundamentals do not change. Furthermore, we can target $4200 in a few weeks if the current momentum continues.
Best regards,
Team Setupsfx_

XAUUSD Breakout Rally Underway — Parallel Channel RetestGold (XAUUSD) is showcasing a classic parallel channel breakout retest pattern that could propel prices higher toward the 4225+ zone in the coming sessions.
Over the past several days, price action has been neatly contained within a parallel channel, bounded by an upward-sloping support line and a steady resistance band. Each swing high and low respected this range, forming a strong structural base for a potential breakout setup.
Recently, the price managed to break above the resistance zone, confirming bullish momentum. This breakout came after a strong impulse move from the channel's support, pushing above the resistance with increasing volume and strength.
Now, the price is revisiting the previous resistance — which is expected to act as a new support. This type of breakout retest is a healthy sign of a sustainable uptrend. If buyers defend this zone, it opens the door for the next bullish leg.
Key Observations:
Support Zone: Around 4100 (former resistance now acting as support)
Resistance Turned Support: Confirming strength in the breakout
Pattern Height Projection: The earlier swing height projected from the breakout point gives a bullish target above 4225
Confirmation Needed: A bounce from the retest zone with a strong candle will confirm the next leg up
Possible Trading Strategy:
Entry: On confirmation candle after retest (e.g., bullish engulfing on 1H or 4H)
Targets:
Target 1: 4165
Final Target: 4225+
Stop Loss: Below 4085 (just under the retest zone)
In summary, the structure favors bulls as long as price holds above the 4100 support. The clean breakout and retest setup, backed by prior channel compression, indicates that XAUUSD is preparing for a fresh upside wave. Keep an eye on the confirmation candle — this move could offer a low-risk, high-reward setup in gold.
