XAUUSD Forming Bullish MomentumGold (XAUUSD) is currently trading around the 4,000 mark, showing strong bullish momentum after an extended breakout from a prolonged consolidation phase. The market has successfully cleared its previous resistance zone, which had acted as a ceiling for months, confirming a continuation of the broader uptrend. The pattern on the chart clearly reflects a breakout-retest-continuation structure, where gold has completed a healthy pullback phase and is now preparing for its next impulsive move to the upside. As long as price remains above the 3,900 support area, the bullish outlook stays intact, with buyers likely targeting the 4,300–4,500 region in the coming sessions.
Fundamentally, gold’s bullish tone is being supported by a combination of softer U.S. dollar sentiment and growing expectations that the Federal Reserve may adopt a more dovish stance heading into 2026. Inflation data has shown signs of moderating, and U.S. Treasury yields have started to ease, which typically benefits non-yielding assets like gold. Additionally, ongoing geopolitical tensions and central bank accumulation of gold reserves continue to add a strong layer of demand, keeping the metal well-supported even during short-term pullbacks.
Looking forward, XAUUSD’s trend remains positive as long as market conditions sustain this risk-hedging narrative. Any dips toward 3,950–3,900 could offer fresh buying opportunities for swing traders targeting the next leg higher. The technical picture complements the fundamentals, suggesting that gold may be entering a new expansion phase toward the 4,500–4,700 zone if momentum persists. A clean daily close above 4,100 would likely confirm this next bullish wave, keeping the overall sentiment firmly in favor of the bulls.
Xauusdupdates

A reversal? No! Our bullish outlook remains unchanged!#XAUUSD OANDA:XAUUSD TVC:GOLD
Looking at the hourly and 4-hour charts, the technical indicators are diverging, indicating a need for a pullback correction. In the short term, it may test the 4115-4105 support level. Therefore, do not trade blindly in the short term, wait for the price to pull back to the support level before participating in long positions.

XAUUSD Potential for Short-Term CorrectionThe short-term outlook for the gold price FOREXCOM:XAUUSD is considered positive (bullish). This sentiment is supported by two key fundamental factors:
The potential end of the US government shutdown.
Market expectations for further policy easing from the Federal Reserve (The Fed).
Price Movement Scenario (Pivot: 4130)
The 4130 level serves as a pivot point, or a determinant of the direction of gold's movement in the near term.
⬆️ Bullish Scenario
If the price moves above 4130, further upside is expected, with the following targets:
Target 1: 4155
Target 2: 4168
Target 3: 4207
⬇️ Bearish Scenario
If the price moves below 4130, a bearish correction is likely, with the following targets:
Target 1: 4105
Target 2: 4085
Target 3: 4055

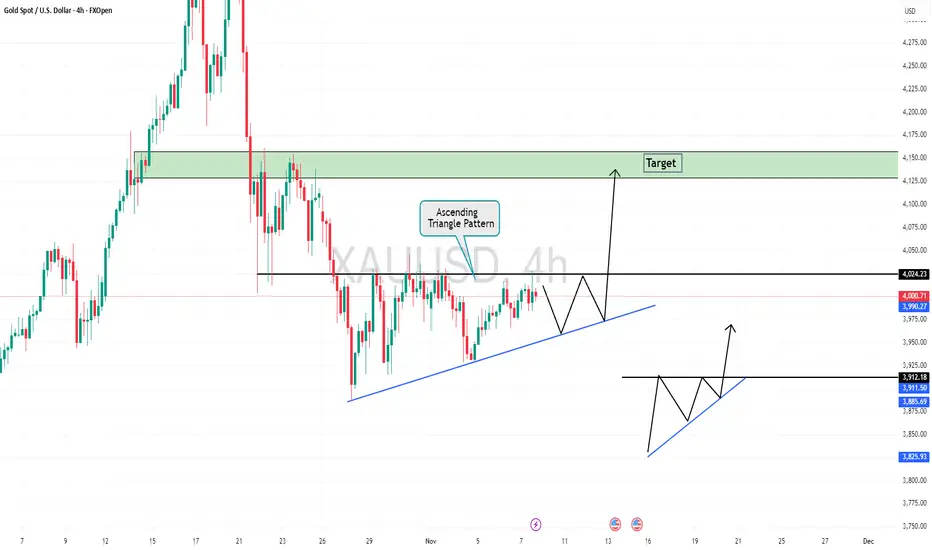
Gold is Ready For Bull From Triangle PatternHello Traders
In This Chart GOLD HOURLY Forex Forecast By FOREX PLANET
today Gold analysis 👆
🟢This Chart includes_ (GOLD market update)
🟢What is The Next Opportunity on GOLD Market
🟢how to Enter to the Valid Entry With Assurance Profit
This CHART is For Trader's that Want to Improve Their Technical Analysis Skills and Their Trading By Understanding How To Analyze The Market Using Multiple Timeframes and Understanding The Bigger Picture on the Charts
Gold Trade Set Up Nov 11 2025Price is trading above PDH and remains bullish on the 1h and 15m making HH/HL with a recent BOS and SSL sweep on the 15m so i will be taking buys to higher BSL levels and daily FVG to fill the imbalance

XAUUSD: Watch for a breakout during the U.S. sessionThe Gold is basically oscillating within a narrow range now, but the U.S. session is bound to break out of this range.
Gold has been consolidating for nearly a month, and finally, the consolidation ended at the end of October and the beginning of November. As the bullish momentum emerged, gold staged a bottoming rebound. As I’ve said before, in a strong upward trend, it’s unwise to call the top prematurely.
For trading strategies, I still recommend prioritizing buying on pullbacks, with support below held at the key integer level of 4100.
Trading Strategy:
Buy 4120 - 4130
SL 4110
TP 4140 - 4150 - 4160
Sell 4160 - 4155
SL 4170
TP 4145 - 4035 - 4025

The bull market has returned. Am I bullish at this price level?#XAUUSD TVC:GOLD OANDA:XAUUSD
Gold prices performed strongly yesterday, closing with a large bullish candle on the daily chart and stabilizing above the daily MA5, officially signaling the return of bulls to the market.
Gold strengthened further today, and from a technical perspective, the bullish trend remains intact. Therefore, continuing to go long on gold is clearly safer. The bullish signal given last night regarding a pullback to the 4075 support level remains valid. However, with the passage of time and the continued strength of gold, a direct pullback to this level in the short term is somewhat difficult. But as a point of multiple pullbacks on smaller timeframes and near the daily MA20, the 4075 support remains reliable. Therefore, we can consider it a defensive level for the short-term bulls. As long as gold prices remain above this level, the bullish momentum will not change.
Currently, looking at the hourly chart, the 4125-4110 range is the support zone for the short term. If the price retraces to this level during the European session, it would be a good entry point, and we can continue to go long on gold within this range.

Is gold about to return to a bullish trend?On Monday, the US dollar index remained below the 100 level as signs that the US government might resume operations boosted market risk sentiment.
Spot gold rebounded sharply, surging over $100 intraday and returning above $4100, reaching a new high in over two weeks.
So far, gold has reached a high near $4150.
Looking at the hourly chart:
The two most crucial support levels for gold are currently around 4120-4115 and the $4000 level.
The 4120-4115 level coincides with the hourly moving average (MA20), and 4115 is also the opening price today. Therefore, if it holds above this level, gold is likely to maintain a consolidation and upward trend today.
Secondly, there's the $4000 level, which is the hourly MA30. It's possible that the price might break through the MA20 and directly reach the MA30.
Therefore, I think it's best to wait until at least 4120-4115 before considering long positions.
If the price breaks through the morning high of 4150, it may continue to reach the high near 4180.

GOLD: Still prioritize buying on pullbacksIn terms of gold's current pattern, the strong momentum built up after a continuous upward move is likely to extend significantly. We remain bullish on the gold market for now. The short-term resistance above is around 4145, which will also be our primary target going forward. On the downside, support is held at the key integer level of 4100, a level that serves as one of the primary retracement points for short-term bullish corrections. Operationally, we prioritize buying on pullbacks.
From the 4-hour chart analysis, the support below will continue to lie around the 4090-4110 range, while the short-term resistance above is focused on 4145-4150. If gold stabilizes above 4150, it may surge toward 4180 today. In trading, we maintain the strategy of buying on pullbacks and should avoid blindly chasing the rally.
Trading Strategy:
Buy 4110 - 4120
SL 4100
TP 4140 - 4145 - 4150
Sell 4150 - 4145
SL 4160
TP 4125 - 4020 - 4015

15 minutes time frame buy position Hi guys as you see I published an Idea with buy position at 15 minutes time frame.
Please getting action after approval candle is ready over top zone of 5 minutes chart

USOIL: Accumulate bullish momentumFrom the daily chart perspective of crude oil, on a partial level, the current oscillating rhythm is a secondary consolidation. Judging from the primary and secondary rhythms, there is still room for a rebound and upward move in the trend. The MACD indicator remains below the zero axis, indicating that bullish momentum still needs to accumulate further. It is expected that after the medium-term trend of crude oil tests the low point and finds support, a rebound and upward movement is likely to form.
Buy 59 - 59.5
SL 58.5
TP 60 - 60.5 - 61
Sell 60.5 - 61
SL 61.5
TP 59.1 - 58.5

GOLD (XAU/USD): FED DOVISHNESS FUELS BREAKOUT! WHERE TO LONG?📰 Fundamental Analysis: The Main Driver (MUST READ)
The macroeconomic winds are strongly pushing Gold higher:
Rate Cut Expectations: The market is currently pricing in over 60% probability of another Fed rate cut in December.
Lower rates weaken the USD and eliminate the opportunity cost of holding non-yielding Gold.
Weak Economic Data: The US Consumer Sentiment Survey from the University of Michigan plunged to 50.3 (lowest since June 2022). This weak reading supports the narrative of a slowing economy, bolstering the case for a more dovish Fed.
💡 Key Event This Week: Focus shifts to FOMC member speeches on Wednesday (following the Tuesday bank holiday) for confirmation on the future rate path.
📊 Technical Analysis: The Perfect Setup
Gold has executed a decisive Breakout from its consolidation range (4,044 - 4,060), confirming a structural shift to a Bullish Trend.
Waiting for the Long Entry: DO NOT CHASE THE PRICE! Be patient and wait for a pullback to the Demand Zone/CP (4,081 - 4,114). This is the optimal area for Bulls to enter and follow the trend.
Targets (TP): If the CP zone holds, potential targets are 4,155, 4,185, and the higher objective at 4,236.
Stop-Loss (SL): Place safely below the old breakout level at 4,044.
🎯 Strategy Summary
Strategy: Wait to Buy (Long) in the 4,081 - 4,114 region.
Risk Note: Caution if price breaks and closes below 4,044.
#XAUUSD #Gold #FedRateCut #Breakout #TechnicalAnalysis #FOMC #TradingSetup

ANFIBO | XAUUSD - Black Friday, but hit $4200 soon [11.11.2025]Well, Anfibo's here again!
XAUUSD Analysis – Daily Trading Plan
Overall Picture:
OANDA:XAUUSD has moved exactly according to my yesterday’s plan, delivering an impressive 750 Pips of profit — a phenomenal start to the new trading week. The bullish structure remains firmly intact, and momentum continues to show strength as price pushes higher toward major resistance zones. For today, my expectation is that XAUUSD will extend its upside move toward the $4,200 region, which also aligns perfectly with the 61.8% Fibonacci extension on the higher timeframe — a strong confluence level where profit-taking is highly likely. At this zone, I will secure additional profits from yesterday’s buy positions and closely monitor price action for potential sell signals.
Trading Plan for Today:
>>> SELL ZONE:
ENTRY: 4185 – 4205
SL: 4210
TP: 4150 – 4130
>>> BUY ZONE:
ENTRY: 4075 - 4090
SL: 4065
TP: 4140 – 4190 - 4200
Risk Management:
Stick to small-to-medium positions within the range; increase size only on confirmed breakouts.
Keep stops tight, as bullish extensions can reverse sharply at major confluence zones.
Maintain Risk:Reward ≥ 1:2 and avoid overtrading during high volatility spikes.
Reassess market bias once price reacts clearly around the $4200 fibo confluence zone.
Conclusion:
Gold continues to reward trend-following strategies as it pushes toward the $4200 target zone. This level will be crucial for today’s session, as it represents both a psychological barrier and a strong fibo confluence. I will lock in further profits on buys once price reaches this region and will only consider sells if price action confirms a reversal pattern.
HAVE A NICE DAY, GUYS!

Gold Finally Moves —Breakout Above 4020 Signals Bullish Momentum1. What Happened Last Week
Gold has spent most of last week consolidating in a narrow range 3960 and 4020, with only a short-lived downside spike on Wednesday. This range reflected market indecision , as traders waited for a clearer direction.
2. What’s Happening Now
The Asian session open this week brought the first meaningful breakout in days — price moved decisively above 4020 resistance and is now holding around the 4050 zone. This is the first clean bullish signal after multiple failed attempts last week.
3. Technical Outlook
From a technical perspective, the breakout opens room for an upside continuation. The next major target for buyers stands around the 4150 resistance.
As long as the 4000 level remains intact, bulls retain full control. That zone now acts as the line in the sand for short-term momentum.
4. Trading Plan
My plan is to buy dips near support and targets near 4150.
If the market closes back below 4000, the bullish bias would weaken, signaling a potential false breakout.
5. Conclusion
Gold has finally chosen direction — and as long as we stay above 4k, buying dips remains the smart play. The next few sessions will confirm if bulls have the strength to push toward 4150. 🚀

ANFIBO | XAUUSD - Effort to Breakout??? [11.10.2025]Hi guys, Anfibo's here!
XAUUSD Analysis – Daily Trading Plan
Overall Picture:
OANDA:XAUUSD is currently trading at the upper boundary of its sideways H1 channel, a key decision point where market sentiment is being tested. This resistance zone has repeatedly acted as a ceiling for price during the current consolidation phase. The question now is whether this level will once again trigger a technical pullback, or if bullish momentum—supported by ongoing geopolitical uncertainty—will be strong enough to deliver a clean breakout and start a new impulsive leg upward. Price action today will be crucial in determining whether gold continues ranging or transitions into a breakout phase.
Trading Plan for Today:
>>> BUY ZONE:
(1) ENTRY: 4040 - 4050
SL: 4030
TP: 4135 – 4150 - 4200
(2) ENTRY: 4070 - 4080 (small vol)
SL: 4065
TP: 4135 – 4150 - 4200
Risk Management:
- Stick to small-to-medium positions within the range; increase size only on confirmed breakouts.
- Keep stops tight, as sideways phases tend to trigger false signals.
- Maintain Risk:Reward ≥ 1:2 and avoid overtrading in choppy conditions.
- Reassess market bias once the H1 channel is decisively broken.
Conclusion:
Gold is sitting right at the “make-or-break” zone of its sideways channel. This area will tell us whether the market plans to reject and pull back, or gather enough momentum for a powerful breakout. As always, we remain flexible: trade the range until it breaks, and prepare to shift bias immediately if a confirmed breakout occurs.
HAVE A WONDERFUL NEW WEEK GUYS!

ElDoradoFx – GOLD ANALYSIS (11/11/2025, ASIA SESSION)
1. Market Overview
Gold opens the Asia session trading near $4,110–$4,115, sustaining the strong bullish momentum from Monday’s US rally. Price action continues to respect the ascending channel structure, but early divergence signals hint at slowing momentum. Bulls maintain control while price holds above $4,097, with short-term consolidation expected before a potential continuation toward $4,130–$4,145.
⸻
2. Technical Breakdown
Daily (D1)
• The daily candle closed bullish above the key level $4,100, confirming a BOS and maintaining structure after the $4,013 breakout.
• RSI ~59 indicates momentum still healthy with room to extend toward $4,150–$4,180.
• Support sits around $4,085–$4,075, which aligns with prior demand and EMA50 confluence.
H1
• Price consolidates within an ascending channel; structure is intact with consistent higher lows.
• RSI hovering near 70 with MACD flattening, showing early exhaustion.
• 200EMA provides dynamic support near $4,095, key zone for intraday buyers.
15M–5M
• Short-term trend remains bullish with visible CHoCHs and BOSs confirming continuation.
• However, candles show rejection at $4,115–$4,118, forming potential liquidity traps before a corrective pullback into the Golden Zone.
• Intraday RSI divergence present on 5M, suggesting potential retracement before next impulse.
⸻
3. Fibonacci Analysis (Swing 4,087 → 4,116)
• 38.2% → $4,105
• 50.0% → $4,101
• 61.8% → $4,097
🎯 Golden Zone: $4,105 – $4,097 (Key re-entry area for continuation)
⸻
4. High-Probability Trade Scenarios
📈 BUY SCENARIO (Primary Bias)
• Entry Zone: $4,105 – $4,097 (Golden Zone / EMA50 retest)
• Targets: $4,120 → $4,130 → $4,145
• Stop Loss: Below $4,090
• Confirmation: Bullish engulfing or CHoCH on 5M/15M chart after retest.
✅ Confluence: EMA structure + previous BOS + Fibonacci support.*
⸻
📉 SELL SCENARIO (Countertrend Pullback)
• Entry Zone: $4,115 – $4,120 (Upper channel + RSI 75 divergence)
• Targets: $4,105 → $4,097 → $4,087
• Stop Loss: Above $4,125
• Confirmation: Bearish rejection candle or BOS break below $4,109.
⚠️ Countertrend only — potential short-term retracement before continuation.
⸻
💥 BREAKOUT SETUPS
• Bullish Breakout: Above $4,120 → Retest $4,115 → Targets $4,130 → $4,145 → $4,165.
• Bearish Breakout: Below $4,087 → Retest $4,090 → Targets $4,075 → $4,065.
⸻
5. Fundamental Watch
• Asia Session: Expected quiet volatility; focus shifts toward liquidity buildup pre-London.
• Key Theme: Market pricing in softer USD ahead of upcoming US CPI release later in the week.
• DXY: Below 106 continues to support gold upside bias.
• Sentiment: Mildly bullish unless DXY rebounds sharply.
⸻
6. Key Technical Levels
Zone Level Remarks
Resistance 1 4,115 Short-term cap, watch for breakout
Resistance 2 4,130 Intraday extension
Resistance 3 4,145 Major target
Support 1 4,105 38.2% fib
Support 2 4,097 61.8% fib / Golden Zone
Support 3 4,087 Key structure base
Breakout Triggers >4,120 (Bullish) / <4,087 (Bearish) Confirmation zones
⸻
7. Analyst Summary
Gold’s momentum remains intact with clear bullish market structure across all timeframes. The current consolidation under $4,115 indicates possible accumulation before a new leg up. Traders should monitor $4,105–$4,097 as the high-probability re-entry area for continuation buys.
Only a clean break below $4,087 would invalidate the short-term bullish bias and shift attention back to $4,075–$4,060.
⸻
8. Final Bias Summary
📊 Bias: Bullish-to-neutral above $4,097; expecting continuation to $4,130–$4,145.
🛑 Invalidation: Bearish below $4,087 (structure break).
⸻
🥇 ElDoradoFx PREMIUM 3.0 – PERFORMANCE 10/11/2025 🥇
📊 Swing precision meets intraday consistency.
━━━━━━━━━━━━━━━
🪙 XAU/USD (GOLD)
🟢 BUY (SWING) +710 PIPS
🟢 BUY +20 PIPS
🟢 BUY +210 PIPS
🟢 BUY +110 PIPS
🔻 SELL +20 PIPS
🟢 BUY +210 PIPS
━━━━━━━━━━━━━━━
💰 TOTAL PIPS GAIN: +1,170 PIPS
📊 6 Trades → 6 Wins | 0 SL | 0 BE
🎯 Accuracy: 100%
━━━━━━━━━━━━━━━
🔥 Clean momentum continuation on GOLD with strong bullish swing setups and precise intraday confirmations.
👏 Congratulations if you profited! ✅✅✅🚀🚀🚀
— ElDoradoFx PREMIUM 3.0 Team 💼

Gold - The bullrun is over today!💰Gold ( TVC:GOLD ) creates a massive top:
🔎Analysis summary:
Starting all the way back in 2015, Gold created a major rounding bottom pattern. After the breakout, Gold started its major bullrun, rallying about +300% over the past couple of years. But after this rally, Gold is now showing clear signs of a serious top formation.
📝Levels to watch:
$4,000
SwingTraderPhil
SwingTrading.Simplified. | Investing.Simplified. | #LONGTERMVISION

GOLD: Buy on pullbacksFrom the 4-hour chart perspective, attention should currently be paid to the short-term resistance zone around 4115-4123 above, with key focus on the critical resistance level around 4145. In the short term, watch the support zone around 4060-4068, and pay key attention to the previous low support zone around 4030-4035.
For trading operations, I still recommend prioritizing buying on pullbacks. At mid-range levels, it’s advisable to mostly observe and refrain from action, be cautious of chasing trades, and patiently wait for key levels to enter positions.
Buy 4070 - 4080
SL 4030
TP 4100 - 4110 - 4120
Sell 4120 - 4110
SL 4130
TP 4090 - 4080 - 4070

Gold:Buying on pullbacksGold bulls continue to surge upward. We will maintain the momentum of buying on pullbacks, which remains our operational goal. First, focus on the previous resistance-turned-support zone around 4040-4055; consider going long if the pullback holds above this level. Next, watch the support zone around 4020-4025 below. Pay key attention to the critical support level around 4000-4008.

GOLD Resistance Ahead!
HI,Traders !
#GOLD keeps going up
And the pair is locally oversold
So after it hits the horizontal
Resistance of 4147.66 we
Will be expecting a local
Bearish correction !
Comment and subscribe to help us grow !

Gold (XAU/USD) 3H Technical AnalysisCurrent Price: $4,091.70
Trend: Short-term bullish continuation
Chart Structure: Breakout from descending channel
🔍 Chart Insights
Descending Channel Breakout:
Gold has clearly broken above the yellow descending channel, confirming a bullish breakout from the previous downtrend.
Support Level Zone (Purple Area):
Support Range: $4,000 – $4,050
This zone was a strong resistance earlier and has now flipped into support after the breakout.
Price is expected to retest this area before continuing higher.
Bullish Structure & Retest Pattern:
The yellow zigzag line indicates a likely scenario where price may pull back slightly to the support zone before continuing the upward move toward the next resistance levels.
Target Levels (Resistance zones):
First Target: $4,120 – $4,160
Second Target: $4,200
Main Target (Highlighted): $4,381
This aligns with Fibonacci extension and prior structural highs.
📈 Bullish Scenario
If price holds above $4,050, the uptrend remains intact.
Momentum could push gold toward $4,200 → $4,380 in the next sessions.
Ideal entry area: near $4,050 – $4,070 (on successful retest).
📉 Bearish Scenario
A confirmed break below $4,000 would invalidate the bullish structure.
Downside targets: $3,940 → $3,880.
⚙️ Summary
Bias Entry Zone Support Resistance Target
Bullish $4,050–$4,070 $4,000 $4,200 / $4,380 $4,381 TFEX:GO1! TFEX:GD1! TFEX:GF1! TFEX:AEONTS1! TFEX:BANK1! TFEX:EURUSD1! TFEX:USD1! TFEX:USDJPY1! TFEX:S501! GPW:FW201! GPW:FPCO1! GPW:FPKN1! GPW:FW401! GPW:FUSD1!

XAU/USD – Gold Retests FVG Preparing for a New Uptrend, Target..📊 Market Structure
Gold has officially broken the bearish structure (BoS + ChoCH) by surpassing the 4,025 USD zone, confirming a significant shift in market momentum.
Following a series of consecutive BoS and a break of the downtrend line, the price is entering a balanced retest phase (FVG 4,030 – 4,040 USD) .
As long as the price maintains above the 4,020 USD support zone, the bullish structure remains intact, and it is expected to target the Liquidity Zone 4,070 – 4,090 USD , further extending to the Order Block 4,118 – 4,125 USD .
💎 Key Technical Zones
• FVG Retest Zone: 4,030 – 4,040 USD
• Trendline Support: around 4,000 USD
• Liquidity Zone: 4,070 – 4,090 USD
• Final Target (OB): 4,118 – 4,125 USD
🎯 Trading Plan
1️⃣ BUY Setup #1 – Main FVG Retest
If the price retraces to the FVG zone of 4,030 – 4,040 USD and forms a bullish confirmation signal (bullish candle / rejection wick):
• Entry: 4,033 – 4,038
• SL: 4,020
• TP1: 4,070
• TP2: 4,090
• TP3: 4,120
→ Enter at the “discount” zone after the market absorbs liquidity.
2️⃣ BUY Setup #2 – Defensive (deep trendline retest)
If the price slightly sweeps the small OB zone around the trendline:
• Entry: 3,998 – 4,004
• SL: 3,985
• TP1: 4,070
• TP2: 4,120
→ The structure remains intact, this entry has a high RR, suitable for mid-term swing.
⚠️ Invalidation:
• If the price closes an H1 candle below 3,985 USD → the short-term uptrend is invalidated.
🧠 Vincent’s View
The buyers are fully controlling the H1 structure after breaking the downtrend line that lasted nearly 2 weeks.
The price is likely to complete the FVG – trendline – breakout retest before continuing to expand towards the liquidity peak of 4,120 USD.
This is the “buy-the-dip” strategic phase for this week.
“Smart money buys the discount while everyone waits for confirmation.” ⚜️🟡
⏰ Timeframe: 1H
📅 Updated: 11/10/2025
✍️ Analysis by: Captain Vincent

XAUUSD SHORT SETUP INTRADAY ( 10 NOV 2025 )If you have doubt on our trades you can test in demo.
OANDA:XAUUSD SHORT SETUP
EP: 4091.659
TP: 4066.848
SL: 4103.906
Trade Ideas:
Idea is clearly shown on chart + we have some secret psychologies and tools behind this.
Trade Signal:
I provide trade signals here so follow my account and you can check my previous analysis. So don't miss trade opportunity so follow must.
