Market volatility, trade steadily.#XAUUSD TVC:GOLD OANDA:XAUUSD
As mentioned last night, gold prices failed to break below the important short-term support level of 3965, so we maintain our bullish view. Although the intraday volatility was not high, the consolidation process can be seen as gold accumulating positions in the short term. Market breakout requires patience. Currently, the daily MA5 and MA10 moving averages are converging around 3980, which is also where the 4-hour middle band is located. The key resistance level in the short term is in the 4015-4030 area. A break above this level could lead to further gains towards 4050-4080.
It's important to be cautious given the recent volatile market with poor continuity. Therefore, even if a breakout occurs today, it is not advisable to rush to buy. Instead, wait for a pullback before entering the market to avoid being trapped by blindly chasing highs. The 3980-3965range remains the ideal entry point for bulls. Maintaining patience is always a key element in trading.
Xauusdupdates

Maintain the morning's trading strategyDue to the government shutdown, the U.S. Bureau of Labor Statistics failed to issue the October Nonfarm Payrolls report as scheduled, marking the second consecutive "absence" of the report.
Therefore, for today's U.S. trading session, we will maintain the morning's trading strategy and continue to treat the market as a volatile trend. We will focus on short-selling on rebounds, adopt a "observe more, trade less" approach, refrain from chasing trades cautiously, and patiently wait for key levels to enter positions.

XAUUSD: Short on rebounds ahead of the Non-Farm PayrollsIt closed around the 3977 level on Thursday, with the lowest touching around 3964.4 before finishing in a range-bound move, which also hit the 3960-3970 zone I indicated yesterday. I also kept emphasizing yesterday not to chase long positions at high levels.
Gold faces heavy resistance above. The bulls can only break through if driven by significant bullish news; otherwise, we will continue to stick to shorting on rebounds. With the Non-Farm Payrolls report due this Friday, we will maintain the approach of shorting on rebounds during the morning.
Looking at the 4-hour chart, the immediate resistance above is focused on the 4020-4025 zone, with the key bull-bear watershed at 4047-4055. For short-term support, watch the 3960-3970 area, while the key support lies at the previous low around 3888-3890.
In terms of operation, I still recommend prioritizing shorting on rebounds. For mid-range levels, we should always adhere to observing more and acting less, be cautious about chasing orders, and patiently wait for entry at key levels.
Trading Strategy:
Sell 4010 - 4020
SL 4030
TP 3980 - 3970 - 3960
Buy 3920 - 3930
SL 3910
TP 3950 - 3960 - 3970

Gold Trade Set Up Nov 7 2025Price has lots of SSL to be swept to the downside so if price continues to make LH/LL on the 15m i will want to see a sweep of internal BSL and respect this 15m FVG to target PDL and lower SSL

GoldXAUUSD
- Symmetrical Triangle as an corrective pattern in Short Time Frame
- Break of Structure
- RSI - Divergence
- Completed " 12345 " Impulsive Waves and " ABC " Corrective Waves
- Change of Characteristics

GOLD HIGH PROBABILITY SETUPS SOON!!!🚨 XAUUSD HIGH PROBABILITY SELL/BUY SETUP 🚨
* Here We Can See Clearly The Next Potential Moves For GOLD Coming Hours/Days.
* Keep Your Eyes Close On Your Trading Positions.
* Happy PIP Hunting Traders.
FXKILLA.

XAU/USD 07 November 2025 Intraday AnalysisH4 Analysis:
-> Swing: Bullish.
-> Internal: Bullish.
Analysis and bias remains the same as analysis dated 20 October 2025.
Price has printed as per previous intraday expectation by printing a bearish CHoCH which indicates, but not confirms, bullish pullback phase initiation.
Price is currently trading within an established internal range, however, I will continue to monitor price with regards to depth of pullback.
Intraday expectation:
Price to continue bearish, react at either discount of 50% internal EQ, or H4 supply zone before targeting weak internal high priced at 4,380.990.
Note:
The Federal Reserve’s sustained dovish stance, coupled with ongoing geopolitical uncertainties, is likely to prolong heightened volatility in the gold market. Given this elevated risk environment, traders should exercise caution and recalibrate risk management strategies to navigate potential price fluctuations effectively.
Additionally, gold pricing remains sensitive to broader macroeconomic developments, including policy decisions under President Trump. Shifts in geopolitical strategy and economic directives could further amplify uncertainty, contributing to market repricing dynamics.
H4 Chart:
M15 Analysis:
-> Swing: Bullish.
-> Internal: Bearish.
You will note how price remains contained in consolidation between a supply and demand zone. The rest of my analysis and bias remains the same as bias date 29 October 2025.
As expected, price has printed a bullish CHoCH to indicate bullish pullback phase initiation.
Price is now trading within an established internal range.
Intraday expectation:
Price to continue bullish, react at either premium of internal 50% EQ or M15 demand zone before targeting weak internal low, priced at 3,886.465.
Note:
Gold remains highly volatile amid the Federal Reserve's continued dovish stance, persistent and escalating geopolitical uncertainties. Traders should implement robust risk management strategies and remain vigilant, as price swings may become more pronounced in this elevated volatility environment.
Additionally, President Trump’s tariff announcements, particularly against China, are expected to further amplify market turbulence, potentially triggering sharp price fluctuations and whipsaws.
M15 Chart:

Gold Price Outlook – Trade Setup (XAU/USD)📊 Technical Structure
OANDA:XAUUSD Gold (XAU/USD) trades near $3,996, struggling to gain clear direction after a short-lived rebound. The chart shows price capped by a descending trendline and the Resistance Zone at $4,001–$4,005, while Support lies between $3,977–$3,981.
Technically, gold remains under mild downward pressure. Unless the price achieves sustained acceptance above $4,006, rallies are likely to attract sellers. A break below $3,980 could trigger fresh momentum toward $3,965, while holding above $4,000 may allow brief consolidation before another leg lower.
🎯 Trade Setup
Idea: Sell near resistance amid capped bullish momentum.
Entry: $4,000 – $4,005
Stop Loss: $4,006
Take Profit 1: $3,981
Take Profit 2: $3,977
Risk–Reward Ratio: ≈ 1 : 5.13
If gold decisively closes above $4,010, the short setup becomes invalid, signalling renewed upside toward $4,020.
🌐 Macro Background
Gold prices are finding moderate support as safe-haven flows return amid political uncertainty and weak U.S. data, while Fed rate cut expectations underpin sentiment.
As FXStreet’s Haresh Menghani reports, “Concerns over the economic fallout from the prolonged U.S. government shutdown and renewed Fed rate cut bets drive safe-haven demand for gold.” 【FXStreet】
Safe-Haven Demand: With the U.S. government shutdown entering its 38th day, investor sentiment remains cautious. The Congressional Budget Office estimates a 1–2% hit to GDP if the impasse continues.
Legal and Policy Uncertainty: The U.S. Supreme Court’s review of Trump’s 1977 emergency powers–based tariffs adds legal uncertainty to trade outlook, further boosting gold’s defensive appeal.
Labor Market Weakness: Private data from Revelio Labs indicated a net job loss of 9,100 in October, while government payrolls declined by over 22,000, pointing to labor market cooling.
Fed Rate Cut Bets: The CME FedWatch Tool now shows a 67% probability of a December rate cut, up from 60% a week earlier. This weighed on the U.S. Dollar, supporting gold despite intermittent profit-taking.
However, with gold struggling to break cleanly above $4,000, traders remain cautious—suggesting a “fade-the-rally” approach is still favoured until clear directional confirmation.
🔑 Key Technical Levels
Resistance: $4,001 – $4,005
Support: $3,977 – $3,981
Psychological Level: $4,000
📌 Trade Summary
Gold’s momentum remains mixed—safe-haven flows and Fed cut bets support dips, but strong resistance near $4,000 continues to cap rallies. The short bias remains valid below $4,006, with room for a move toward $3,970 or lower if sellers regain control.
⚠️ Disclaimer
This analysis is for reference only and does not constitute trading advice. Trading involves significant risk, and proper risk management is essential.

Gold Trade Set Up Secured 450 pipsSet up played out perfectly, sweeping external BSL, tapping 15m supply to target lower SSL levels

XAUUSD: The resistance level at 4020 remains strongGold has attempted to break through the 4020 resistance level several times today but failed. Coupled with the fact that the U.S. initial jobless claims data has not yet been released, it has now re-entered a correction phase.
The resistance level at 4020 remains strong.
For support, the short-term level is still at 3960-3970,and the key previous low support at 3888-3890.
The trading strategy can still refer to our analysis from this morning.

ANFIBO | XAUUSD - Stuck in Sideway channel [11.6.2025]Hi guys, Anfibo's here!
XAUUSD Analysis – Daily Trading Plan
Overall Picture:
At present, OANDA:XAUUSD is moving sideways within a well-defined H1 channel, showing signs of short-term consolidation after recent volatility. The market is currently lacking a clear directional bias, as both buyers and sellers are testing the upper and lower bounds of this intraday structure. Such conditions often favor range-trading strategies, where precision and timing become crucial for capturing short bursts of momentum.
In this context, our plan today remains straightforward and tactical — trade directly off the trendlines of the channel. In other words, we will look to buy at the lower boundary of the range and sell near the upper boundary, while also being prepared to switch positions if a breakout occurs in either direction.
Trading Plan for Today:
>>> SELL ZONE:
(1) ENTRY: 4015 - 4025
SL: 4030
TP: 4050
(2) ENTRY: 4060 - 4080
SL: 4090
TP: 4000 - 3955
Risk Management:
- Stick to small-to-medium positions within the range; increase size only on confirmed breakouts.
- Keep stops tight, as sideways phases tend to trigger false signals.
- Maintain Risk:Reward ≥ 1:2 and avoid overtrading in choppy conditions.
- Reassess bias once the H1 channel is clearly broken.
Conclusion:
Gold is currently in a sideways consolidation phase within its H1 channel, awaiting fresh catalysts to determine direction. Until a decisive breakout occurs, the most effective approach is range trading — buying near support, selling near resistance, and reacting dynamically to any confirmed breakout.
The plan today is simple yet strategic:
Patience and discipline will be key to capitalizing on this quiet yet potentially explosive setup.
HAVE A NICE DAY, GUYS!

XAUUSD- Bullish setupGold is showing early signs of a bullish reversal after finding support around the lower green band and reclaiming the short-term trend zone. Price has broken above the descending structure with increasing momentum, suggesting potential continuation to the upside.
Bullish Confluences:
Bounce from lower volatility band support (oversold zone).
Break above local trend resistance and EMA ribbon.
Higher lows forming, showing renewed buying pressure.
🎯 Fibonacci Targets:
TP1: 38.2% – $4,049
TP2: 61.8% – $4,075
TP3: 100% – $4,117
As long as price holds above the recent breakout zone (~$3,995–$4,000), bulls remain in control. A clean move through the golden zone could confirm continuation toward higher targets.

Gold XAU/USD Bearish Bias Below 4025 Gold rebounded above $4,000 as traders assess the impact of U.S. labor data and the upcoming Federal Reserve meeting on rate expectations.
However, price is now testing a key resistance zone near 4025, keeping short-term sentiment cautious.
Gold stays bearish while below 4025, but a confirmed 1H close above this level would shift bias toward a bullish move targeting 4055–4105.

XAUUSD LONG SETUP INTRADAY ( NOV 06, 2025 )If you have doubt on our trades you can test in demo.
OANDA:XAUUSD LONG SETUP
EP: 3993.469
TP: 4017.410
SL: 3981.518
Trade Ideas:
Idea is clearly shown on chart + we have some secret psychologies and tools behind this.
Trade Signal:
I provide trade signals here so follow my account and you can check my previous analysis. So don't miss trade opportunity so follow must.

XAUUSD SETUP-2 INTRADAY ( NOV 06, 2025 )If you have doubt on our trades you can test in demo.
OANDA:XAUUSD SHORT SETUP
EP: 4018.359
TP: 3994.222
SL: 4030.344
Trade Ideas:
Idea is clearly shown on chart + we have some secret psychologies and tools behind this.
Trade Signal:
I provide trade signals here so follow my account and you can check my previous analysis. So don't miss trade opportunity so follow must.

Gold Trade Set Up Nov 6 2025Price shifted structure to bullish during Asia and London on the 1h but on the 4h price is overbought and is sitting at a strong resistance so i would only buy if price can break and close above supply and most recent 15m swing high but if price stays closed below resistance and respects supply i will look to take sells back down to lower demand zones and SSL levels

GoldXAUUSD
- Symmetrical Triangle as an corrective pattern in Short Time Frame
- Break of Structure
- Order Block
- Change of Characteristics
- RSI - Divergence

Gold: High VolatilityYesterday, gold’s main structure followed a consolidation path, with the focus of its short-term structure edging slightly higher. The risk of price volatility today has increased. Combining the daily and hourly chart trends, the risk of volatility for gold will be very high in the next two days. Subjectively, we temporarily maintain the expectation of a technical correction pullback. Gold’s bullish performance has not been particularly strong, and with heavy resistance above, the trend has not reversed.
From the 4-hour chart, focus on the short-term resistance at the 4010 level, with secondary resistance at 4020-4025. For support, watch the short-term level at 3960-3970 and the key previous low support at 3888-3890. The bull-bear dividing line remains the 4040-4055 range. As long as this resistance range is not broken, I believe the trend has not reversed,on the contrary, any rebound presents opportunities to enter short positions.
We can enter short orders when rebounds encounter pressure. Operationally, it is recommended to continue shorting as long as rebounds fail to break key resistances.
Trading Strategy:
Sell 4010 - 4020
TP 3970 - 3960 - 3950
Buy 3920 - 3930
TP 3950 - 3960 - 3970

We firmly go long when the market is blindly shorting.#XAUUSD OANDA:XAUUSD TVC:GOLD
From the hourly chart, the short-term gold price has broken through the resistance of the triangle pattern boundary. The market has made its choice, and it is clear that we bulls have won. Therefore, we can continue to execute our trading strategy for the next step. Wait for a pullback to 3995-3985 to buy again, with an initial target of 4020-4030.

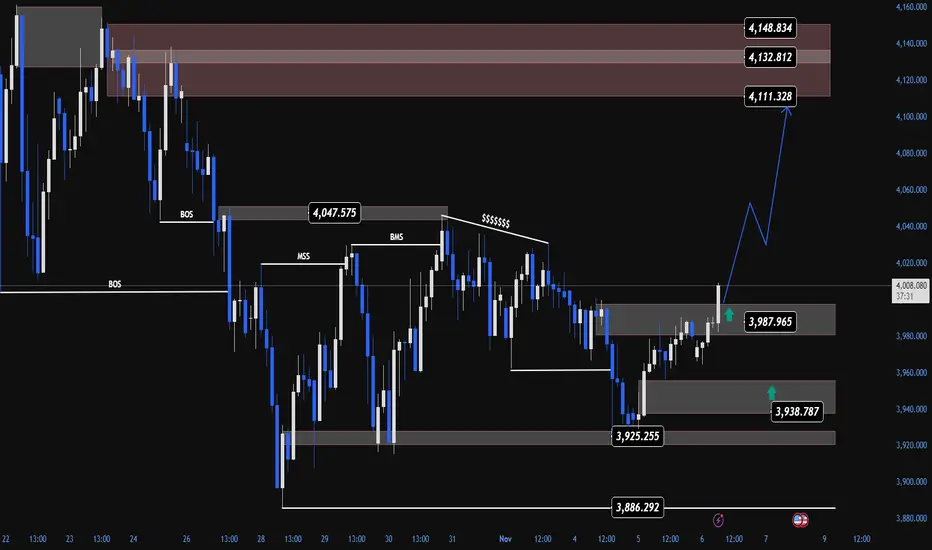
GOLD Smart Money Might Be Preparing for Bullish Structure ShiftGold (XAU/USD) is showing early signs that Smart Money may be shifting from a distribution phase into a short-term accumulation phase.
After a strong bearish leg marked by multiple Breaks of Structure (BOS), recent price behavior now suggests the potential formation of a Market Structure Shift (MSS) — an early indication that institutional flow could be changing direction.
💭 1️⃣ Market Structure – When the Market “Whispers” About Reversal
On the H1 timeframe, we can clearly observe a chain of consecutive BOSs since the 4,150 zone, but what’s intriguing is the reaction around 3,925 – 3,940.
Here, price failed to make new lower lows and began rejecting strongly — leaving several rejection wicks that reveal smart money absorption at discounted prices.
This area represents the discount zone of the current range — where institutions often collect liquidity from trapped sellers before pushing price toward premium levels for redistribution.
The latest Break of Market Structure (BMS) around 3,987 confirms that bearish momentum is weakening, and buyers may be starting to reclaim control in the short term.
🩶 2️⃣ Supply & Demand Zones – Footprints of Smart Money
Karina is currently watching three key zones shaping this market phase:
Demand Zones:
3,938 – 3,925: A strong demand base formed after the initial push upward — acting as a key support if price retraces.
3,986 – 3,988: A minor demand zone formed post-BMS, serving as a potential “reaccumulation point” for the next bullish leg.
Supply Zones:
4,111 – 4,149: Unmitigated Bearish Order Block from the previous decline — the most probable upside target for Smart Money in the current swing.
The projected SMC scenario: Smart Money accumulates at demand → builds liquidity → drives price into the upper supply zones.
🧭 3️⃣ Liquidity Context – Quiet but Purposeful Movement
Gold currently sits within a liquidity equilibrium — a transitional area where both buy- and sell-side liquidity coexist.
Below, 3,886 remains a pocket of sell-side liquidity, while above, large buy-side liquidity pools rest around 4,110 – 4,150.
Smart Money may first collect the remaining sell-side liquidity before triggering a strong upward displacement toward the upper supply zones — following the familiar pattern:
liquidity sweep → displacement → continuation.
🌙 4️⃣ Trade Scenario – Flow With Smart Money, Not Against It
As long as price holds above 3,938 – 3,987, the short-term bias for Karina is bullish.
If price retests these demand zones and forms bullish confirmations (e.g., bullish engulfing or clear order flow shift), it may set the stage for a push toward the 4,111 – 4,148 region.
Entry: 3,938 – 3,987
Stop Loss: 3,925
Take Profit: 4,111 – 4,148
This setup presents roughly a 1:4 R:R, consistent with a buy-side liquidity grab strategy under SMC principles.
🌷 5️⃣ Reflection – When the Market Moves in Silence
After an extended bearish phase, Gold now seems to be accumulating strength in quiet preparation.
This is not a loud reversal — it’s a subtle rebalancing of institutional flow.
To Karina, the market right now feels like a slow, gentle rhythm — calm, deliberate, and full of hidden intent. Sometimes, the key isn’t chasing volatility, but listening to the whispers of Smart Money in the silence of price action. 🌸
This analysis reflects Karina’s personal perspective and is not financial advice.
Do you see the same structure forming? Could this be the early stage of a bullish cycle, or just another liquidity grab? Let’s discuss below 💬
The correction is over; buy gold on pullbacks.#XAUUSD TVC:GOLD OANDA:XAUUSD
With the White House website indicating the ongoing US government shutdown, the normal release of key data such as ADP and NFP may be affected. The news briefly boosted gold prices, leading to a technical rebound in Asian trading.
From the daily chart, the short-term resistance is still around 3980-4000, which is also where the 4H middle line is located. For the bulls to make a full comeback, they need to break through this resistance range and hold above 4000. The current slow and volatile upward trend in gold prices indicates that the bulls still have room to maneuver. In the short term, one can try to continue to be bullish on gold by using the middle line of the hourly chart as a defense. Conservative traders can wait for a pullback to 3970-3955 to try to go long on gold.

XAUUSD Smart Money Zones & Trade Plan — Nov 06, 2025🟡 GOLD ANALYSIS - Updated Nov 06, 2025
OANDA:XAUUSD Gold is consolidating between the $3,950–$4,020 range as the U.S. government shutdown delays key data releases.
DXY is weaker near ~100.15, while the Fed’s recent 25bps cut (3.75–4%) keeps markets uncertain about the next move.
Central Banks remain net buyers (+19t in August, +220t in Q3), led by Poland.
ETF inflows are supporting price while geopolitical tensions continue to fuel safe-haven demand.
🧭 SMART MONEY LEVELS (Valid Today)
🔻 SELL ZONES
• $4,025 – $4,037 → Smart Money Sell Area
• $4,015 – $4,005 → Scalp Sell Area
🔺 BUY ZONES
• $3,938 – $3,915 → Smart Money Buy Accumulation Range
Current Price: ~$3,990
📊 TECHNICAL OUTLOOK
• Holding above $3,950 maintains a mild bullish structure
• Break above $4,020 can retest $4,100
• Break below $3,915 may extend correction toward $3,900
🔮 Timing Insight
Between 22:00–23:00 UK Time, expect a potential bullish liquidity spike near buy zones.
📌 Conclusion
Gold remains in controlled consolidation with a bullish tilt.
Trade reaction to levels, not prediction.
Let liquidity guide entries.

XAUUSD/GOLD 1H BUY PROJECTION 06.11.25XAUUSD (Gold/USD) on the 1-hour timeframe, dated 06.11.25. Here’s a clear breakdown of what the analysis suggests:
🟢 Overall Bias: BUY Projection
The setup shows a bullish outlook for Gold, following a trendline breakout and retest.
🔍 Key Technical Details:
Trendline Break & Retest:
A downward (bearish) trendline was broken to the upside.
Price retested the broken trendline, confirming potential for upward continuation.
Temporary Resistance:
Around 3989–3990 level (current price area).
If this zone is broken cleanly, further upward movement is expected.
Uptrend Line (1H):
An ascending trendline is drawn, suggesting the current bullish momentum.
The projection follows this uptrend structure.
Resistance Levels:
Resistance R1: Around 4000–4010
Resistance R2: Around 4020–4030
These are potential target zones for buyers.
Support / Stop-Loss Area:
Below 3970, marked in the red shaded region, is the invalidation level if price drops below it.
🧭 Projected Path:
The arrows indicate the expected movement:
Minor pullback from temporary resistance.
Bounce off the trendline.
Continuation up through R1 and potentially toward R2.
💡 Summary:
Bias: Bullish (Buy)
Entry Zone: Near 3980–3990 after retest confirmation.
Targets:
TP1 = 4000–4010 (R1)
TP2 = 4020–4030 (R2)
Stop-Loss: Below 3970 support.
Would you like me to calculate the risk-to-reward ratio (RRR) based on these zones
