Gold breaking through this signal could see it reach the $4,000 Gold experienced a sharp drop in the short term, retreating to the support area of 3928 and reversing. The current upward pressure is in the 3977-3989 USD area, which is the key area for short-term gains. If this area is broken, it will once again stand above the 4000 USD mark.
Xauusdupdates

SELL XAUUSD (GOLD) - Great trade opportunityGOLD (XAUUSD) has been in a downtrend lately and has been showing many signs of more bearish movements ahead. Gold is currently in a clear downtrend channel shown on the chart, it has also broken a powerful support level and recently broken the yellow trendline which acted as the last support level near the current price. Gold is likely to hit the next support zone which is shown as the take profit level on the chart. Time to sell!

Gold Approaches 3960 Support After Failing at 4030Yesterday, I highlighted that Gold appeared slightly bullish, forming an ascending triangle with resistance around the 4030 zone. Early in the day, Gold did indeed rise and tested this resistance again. However, after the futures market opened, momentum started to fade, and the price began fluctuating around the 4000 level.
As we entered the Asian session, the bears took control, and Gold is now testing the 3970 level, approaching the key 3960 support, which aligns with yesterday's low.
If we see a break below this support, the next key levels to watch are 3915, a zone where Gold experienced significant reactions last week, and even 3890.
On the flip side, any stabilization above the 4000 level could shift the bias back to bullish.
Key Points:
- Downside: Break below 3960 opens 3915 and potentially 3890.
- Upside: Only stabilization above 4000 would suggest a bullish shift.
🚀 Let's see if Gold can make a move today, but remember, volatility remains extremely high and 3-400 pips means nothing for Gold nowadays

Gold Trade Secured 250 Pips!Our sell set up played our perfectly, broke structure on the 15m, swept 5m BSL, took sells to SSL. What a clean set up

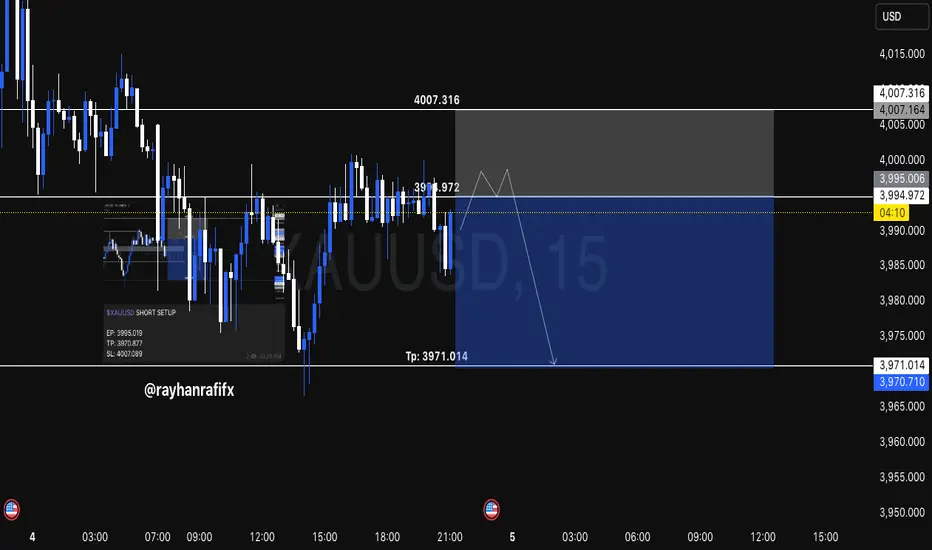
XAUUSD SHORT SETUP INTRADAY ( NOV 04, 2025 )If you have doubt on our trades you can test in demo.
OANDA:XAUUSD SHORT SETUP
EP: 3995.019
TP: 3970.877
SL: 4007.089
Trade Ideas:
Idea is clearly shown on chart + we have some secret psychologies and tools behind this.
Trade Signal:
I provide trade signals here so follow my account and you can check my previous analysis. So don't miss trade opportunity so follow must.
Gold Trade Set Up Nov 4 2025Price is making LL/LH on the 1h and 15m so i am still bearish but first i want to see a sweep of internal BSL followed by 5m bearish candle close to target SSL/PDL

XAUUSD LONG SETUP INTRADAY ( NOV 04, 2025 )If you have doubt on our trades you can test in demo.
Details:
Entry: 3981.277
Target Price: 4005.181
Stop loss: 3969.178
Trade Ideas:
Idea is clearly shown on chart + we have some secret psychologies and tools behind this.
Trade Signal:
I provide trade signals here so follow my account and you can check my previous analysis. So don't miss trade opportunity so follow must.

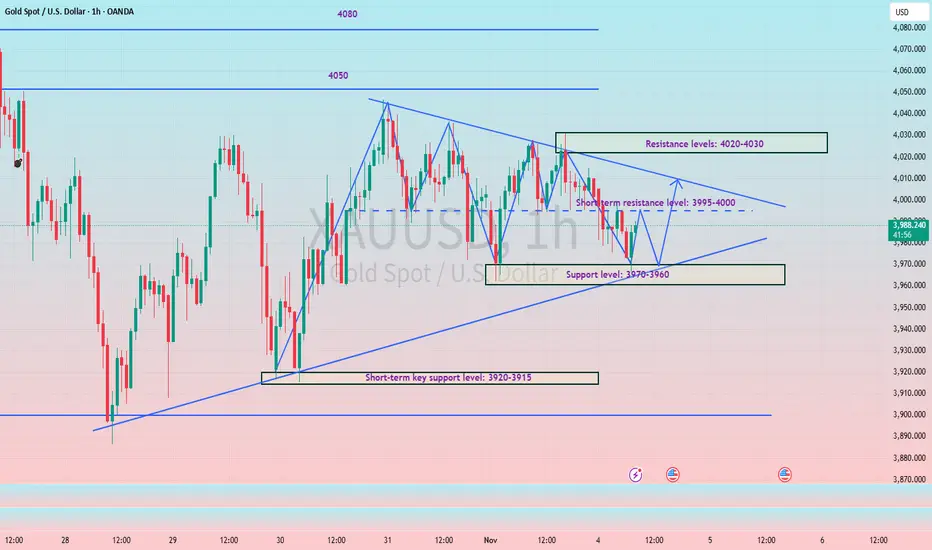
How to keep up with the rhythm of triangle pattern consolidation#XAUUSD OANDA:XAUUSD TVC:GOLD
Gold prices stalled at higher levels yesterday, mainly due to Federal Reserve officials' cautious stance on a December rate cut, which boosted the dollar and dampened enthusiasm for gold's rise. Judging from the current trend, the market is in a converging triangle pattern. The daily MA5 is around 3987, and the MA10 is around 4021. It can be seen that the range between these two points is very small, indicating that the market is also preparing to break out and choose a major direction. Once the gold price breaks out of the triangle pattern and chooses a direction, the daily chart's trendline will widen. Therefore, the key resistance level to watch is 4020-4030, while the key support level is 3970-3960. The European session is expected to trade within a range in the short term. Before a successful breakout, pay attention to the resistance level of the middle band on the hourly and 4-hour charts at 3995-4000. If the price touches the resistance level on the first attempt and fails to break through, a small short position can be considered.
Gold looking for another mega bullish This XAU/USD (Gold vs USD) 2-hour chart shows a consolidation phase between the support zone around 3,922 – 3,886 and the resistance level near 4,039 – 4,153. The price is currently trading near 3,994, indicating indecision before a potential breakout.
If gold holds above the support area, the chart suggests a possible bullish breakout above resistance, leading to a continuation toward the long-term target at 4,376. The upward arrows outline a projected move with minor pullbacks, showing step-by-step momentum building toward the target.
In summary, as long as price remains above support, the bias stays bullish, with confirmation coming from a clear breakout above the 4,040–4,150 resistance zone.

XAU/USD: Powell vs. The Discount ZoneHey traders! Gold (XAU/USD) is caught in a fierce battle: a hawkish Fed is boosting the USD, while the risk of a US government shutdown offers support to Gold.
📰 Key Fundamental Drivers:
The Fed & Powell: Interest rates are likely to remain high (Hawkish stance), pushing the USD stronger and applying DOWNWARD pressure on Gold.
US Government Shutdown: The economic risk could limit the USD's rally, providing support for Gold (the safe-haven asset).
📉 Technical Analysis:
Price is currently moving within a Rising Wedge (a bearish reversal pattern) and heading towards a critical Strategic Support Zone (Discount Zone).
🔥 Strategic Support Zone (The Discount Zone): $3,941 - $3,953. This is an attractive price area to look for a Buy (Long) opportunity with a good risk/reward ratio.
Major Resistance Zone: $4,004 - $4,025.
🎯 Two-Sided Strategy:
1. The Bullish Scenario:
Action: Wait to BUY (LONG) when the price hits $3,941 - $3,953 and shows a strong reversal signal.
Target: $4,004 - $4,025.
2. The Bearish Scenario:
Action: SELL (SHORT) if price is strongly rejected at $4,004 - $4,025 OR if price breaks decisively below $3,941.
Target: Below $3,900.
🚨 Warning: Keep a close watch on comments from FOMC members this week to properly position your risk.
#xauusd #forex #powell #fomc #technicalanalysis #gold #usd #discountzone #tradingview

XAU/USD 04 November 2025 Intraday AnalysisH4 Analysis:
-> Swing: Bullish.
-> Internal: Bullish.
Analysis and bias remains the same as analysis dated 20 October 2025.
Price has printed as per previous intraday expectation by printing a bearish CHoCH which indicates, but not confirms, bullish pullback phase initiation.
Price is currently trading within an established internal range, however, I will continue to monitor price with regards to depth of pullback.
Intraday expectation:
Price to continue bearish, react at either discount of 50% internal EQ, or H4 supply zone before targeting weak internal high priced at 4,380. 990.
Note:
The Federal Reserve’s sustained dovish stance, coupled with ongoing geopolitical uncertainties, is likely to prolong heightened volatility in the gold market. Given this elevated risk environment, traders should exercise caution and recalibrate risk management strategies to navigate potential price fluctuations effectively.
Additionally, gold pricing remains sensitive to broader macroeconomic developments, including policy decisions under President Trump. Shifts in geopolitical strategy and economic directives could further amplify uncertainty, contributing to market repricing dynamics.
H4 Chart:
M15 Analysis:
-> Swing: Bullish.
-> Internal: Bearish.
Analysis and bias to remain the same as yesterday's bias date 29 October 2025.
As expected, price has printed a bullish CHoCH to indicate bullish pullback phase initiation.
Price is now trading within an established internal range.
Intraday expectation:
Price to continue bullish, react at either premium of internal 50% EQ or M15 demand zone before targeting weak internal low, priced at 3,886.465.
Note:
Gold remains highly volatile amid the Federal Reserve's continued dovish stance, persistent and escalating geopolitical uncertainties. Traders should implement robust risk management strategies and remain vigilant, as price swings may become more pronounced in this elevated volatility environment.
Additionally, President Trump’s tariff announcements, particularly against China, are expected to further amplify market turbulence, potentially triggering sharp price fluctuations and whipsaws.
M15 Chart:

ElDoradoFx – GOLD (XAUUSD) ANALYSIS (04/11/2025, LONDON SESSION)1. Market Overview
Gold enters the London session trading just below the $4,000 handle, recovering after an early Asian dip to $3,970. The market remains in a range-to-accumulation phase, consolidating beneath descending structure resistance ($4,008–$4,016) and above key support ($3,985–$3,970). Momentum indicators suggest early bullish restoration, but price action remains capped under the 200EMA, awaiting a confirmed breakout to define London’s direction.
⸻
2. Technical Breakdown
🔹 Daily (D1)
Gold holds above the 100EMA, keeping the medium-term structure bullish. RSI at ~50.5 indicates neutrality after a corrective pullback from $4,046. As long as price stays above $3,985, the bullish structure remains intact.
🔹 H1
The pair trades within a descending channel, testing dynamic resistance at $4,004–$4,008. The 50EMA is flattening near the 200EMA, hinting at a potential cross for trend continuation. MACD is stabilizing with higher histogram lows, a bullish sign of momentum recovery.
🔹 15M–5M
Short-term structure shows a series of higher lows (3,970 → 3,982 → 3,993) but faces a clear supply ceiling at 4,004–4,010. RSI around 55–60; MACD positive, suggesting accumulation pressure and reduced selling volume.
⸻
3. Fibonacci Analysis (Swing 3,970 → 4,008)
• 38.2% = 3,993
• 50.0% = 3,989
• 61.8% = 3,985
🎯 Golden Zone: 3,993 – 3,985 → Active demand area for potential long entries.
⸻
4. High-Probability Trade Scenarios
📈 BUY SCENARIO (Primary Bias)
• Buy Zone: 3,993 – 3,985 (Golden Zone)
• Confirmation: Bullish CHoCH or engulfing candle in zone with RSI > 50
• Targets: 4,004 → 4,016 → 4,028 → 4,046
• Stop Loss: Below 3,970
📊 Justification: The Golden Zone aligns with previous liquidity sweep and ascending channel support — strong probability for continuation if defended during London volatility.
💥 Breakout BUY Setup
• Trigger: Break & close above 4,008
• Retest Entry: 4,004–4,006
• Targets: 4,016 → 4,028 → 4,046 → 4,060
• Stop Loss: Below 3,995
📉 SELL SCENARIO (Countertrend)
• Sell Zone: 4,004 – 4,016 (EMA confluence & descending structure)
• Confirmation: Bearish rejection or RSI divergence > 65
• Targets: 3,989 → 3,970 → 3,945
• Stop Loss: Above 4,020
📊 Justification: A rejection from this area would indicate failed breakout momentum, creating a high R:R short toward range support.
⚠️ Break & Retest SELL Setup
• Trigger: Break below 3,970
• Retest Entry: 3,978–3,974
• Targets: 3,965 → 3,945 → 3,920
• Stop Loss: Above 3,985
⸻
5. Fundamental Watch
• UK/EU Data: Light calendar — focus remains on USD strength and DXY (106.10).
• US Factors: Factory Orders and Fed speakers later today; could affect volatility mid-London to NY overlap.
• Sentiment: Gold remains technically bullish but constrained by short-term dollar resilience and yield stabilization.
⸻
6. Key Technical Levels
Type Levels Notes
Resistance 4,004 / 4,016 / 4,028 / 4,046 Supply + 200EMA zone
Support 3,993 / 3,985 / 3,970 / 3,965 Fibo + structural base
Golden Zone 3,993 – 3,985 Main liquidity pivot
Break Buy Trigger Above 4,008 Confirmed bullish continuation
Break Sell Trigger Below 3,970 Bearish momentum confirmation
⸻
7. Analyst Summary
Gold is building pressure within a compressed wedge, where the Golden Zone (3,993–3,985) represents the pivot of the day.
Momentum indicators lean bullish, but the 200EMA and trendline resistance near 4,004–4,008 remain the key barriers.
A clean breakout above 4,008 opens the path to 4,028–4,046, while failure to hold above 3,985 may trigger a retracement to 3,965–3,945.
⸻
8. Final Bias Summary
✅ Primary Bias: Bullish above 3,985
⚠️ Neutral Zone: 3,985–4,004 (wait for breakout confirmation)
❌ Bearish Only Below: 3,970
🎯 Expert Outlook: Focus on buying dips near the Golden Zone with confirmation; avoid premature entries before breakout validation.
⸻
🥇 ElDoradoFx PREMIUM 3.0 – PERFORMANCE 03/11/2025 💸
📊 Smart Entries | Clean Profits | No Drawdown
━━━━━━━━━━━━━━━
🪙 GOLD RESULTS
🟢 BUY +120 PIPS
🟢 BUY +30 PIPS
🔻 SELL +90 PIPS
🟢 BUY +40 PIPS
🟢 BUY LIMIT +200 PIPS
🔻 SELL +20 PIPS
🟢 BUY +40 PIPS
🟢 BUY +20 PIPS
🟢 BUY +40 PIPS
💰 GOLD TOTAL: +600 PIPS
━━━━━━━━━━━━━━━
📱 BTC/USD WEEKEND TRADES
🚀 BUY +900 PIPS
🚀 BUY +1,300 PIPS
📱 BTC TOTAL: +2,200 PIPS
━━━━━━━━━━━━━━━
📊 COMBINED GAIN: +2,800 PIPS
✅ 11 Trades → 11 Wins | 0 SL | 0 BE
🎯 Accuracy: 100%
━━━━━━━━━━━━━━━
🔥 Flawless start to November — precision entries, strong momentum, and clear profit execution across GOLD and BTC!
👏 Congratulations if you profited! ✅✅✅🚀🚀🚀

Gold Awaits Direction Near $4,000 as Fed Comments Limit Upside🔍 Market Context
Gold is trading slightly below the $4,000 mark in early Asian hours, pressured by the Fed’s hawkish tone despite weaker US manufacturing data.
Fed Chair Jerome Powell signaled that another rate cut this year is “not guaranteed”, tempering expectations for further easing.
Meanwhile, ISM Manufacturing PMI slipped to 48.7 in October, below forecast — showing a slowdown, yet not enough to shift the Fed’s cautious stance.
Markets currently price in a 70% chance of a 25 bps cut in December and a total 82 bps by end-2026, reflecting moderate easing expectations rather than a full pivot.
📊 Technical Outlook (H1–H4)
Gold is consolidating around the 3,984–3,985$ area, forming a reaction base above 3,963$ support.
The structure remains within a short-term ascending channel, with the next directional cue likely from the 4,024$ resistance zone.
Key Levels:
• Support 1: 3,963$ – 3,984$ (liquidity defense zone)
• Support 2: 3,923$ (bullish invalidation level)
• Resistance 1: 4,024$
• Resistance 2 / Target: 4,046$
A sustained break above 4,024$ could trigger momentum toward 4,046$, confirming trend continuation.
Conversely, losing 3,963$ would expose 3,923$ as the next liquidity pool before a potential rebound.
🎯 Trading Outlook
Bias remains neutral-to-bullish as long as 3,963$ holds.
If price reacts positively at this zone during the Asian session, short-term buyers may step in toward 4,024$–4,046$.
However, any fresh hawkish comments from Fed officials could cap gains and trigger profit-taking.
⚜️ MMFLOW Insight:
“Liquidity builds where patience fades — smart money waits for the crowd to act first.”

Gold Price Outlook – Trade Setup (XAU/USD)📊 Technical Structure
OANDA:XAUUSD Gold is struggling to stay above $3,980, with clear resistance forming at $3,997–$4,005, just below the psychological $4,000 barrier. The price structure indicates a bearish short-term bias: rallies toward resistance may attract sellers targeting the $3,964–$3,956 support zone.
A sustained break below $3,956 would likely extend the decline toward $3,945, while only a decisive close above $4,010 would invalidate the downside bias.
🎯 Trade Setup
Entry: $3,997 – $4,005 (resistance retest)
Stop Loss: $4,007
Take Profit: $3,964 / $3,956
Risk-Reward Ratio: ≈ 1 : 4.67
🌐 Macro Background
Gold prices remain under pressure near $4,000 after the Federal Reserve’s hawkish tone boosted the U.S. Dollar.
As FXStreet’s Lallalit Srijandorn wrote: “Gold trades in negative territory near $4,000 as traders dial back expectations for additional Fed rate cuts.” 【FXStreet】
Fed Stance: Chair Jerome Powell stated another rate cut this year is “not a foregone conclusion.” Markets now assign roughly 70% odds of a 25bps cut in December, down from over 90% a week ago.
Data Impact: The ISM Manufacturing PMI fell to 48.7 in October (vs. 49.5 expected), highlighting slowing U.S. manufacturing — a potential drag on the dollar if weakness deepens.
Upcoming Event: Traders are watching ADP employment data (Wednesday) for labor market clues; weaker results may offer short-term relief for gold.
However, with the Fed maintaining a restrictive stance and the USD regaining momentum, gold’s upside remains capped in the near term.
🔑 Key Technical Levels
Resistance: $3,997 – $4,005
Support: $3,964 – $3,956
Psychological Level: $4,000
📌 Trade Summary
Gold remains confined below $4,000 amid hawkish Fed rhetoric and mixed U.S. data.
Short-term strategy favours selling rallies near $4,000, targeting $3,956, with stops above $4,007.
Only a breakout above $4,010 would shift bias to neutral.
⚠️ Disclaimer
This analysis is for reference only and does not constitute trading advice. Trading involves significant risk, and proper risk management is essential.

ElDoradoFx – GOLD SESSIONS ANALYSIS (03/11/2025, PRE-ASIA SESSIGold ends the NY session stabilizing near 4,009, after multiple rejections from 4,025–4,030, confirming that sellers are still defending the upper liquidity zone. Meanwhile, buyers continue holding 4,004–3,995, maintaining a short-term ascending structure. This compression phase between resistance and support signals an imminent breakout setup — with Asia likely to decide direction for the next leg.
⸻
📊 Technical Outlook
🔹 D1: Gold remains bullish above the 100EMA, sustaining higher lows from 3,962 → 3,985 → 3,995. RSI ~52 — neutral but holding mid-range momentum. Daily breakout above 4,025 could reopen the path toward 4,060–4,082.
🔹 H1: Structure compressing between 4,025 resistance and 3,995 support. EMAs converging; MACD neutral with low volatility — ideal for a pre-breakout scenario.
🔹 15M–5M: Price forming equal highs at 4,011–4,012 and higher lows near 4,004. RSI 54–58, indicating gradual bullish accumulation before volatility expansion.
⸻
✨ Fibonacci Golden Zone (Last Swing 3,995 → 4,030)
38.2% = 4,016
50.0% = 4,012
61.8% = 4,008
🎯 Golden Zone: 4,016 – 4,008 (acting as key liquidity zone and short-term pivot).
⸻
🎯 High Probability Zones
📈 BUY SCENARIO (Primary Bias)
✅ Buy Zone: 4,016 – 4,008 (Golden Zone)
🎯 Targets: 4,025 → 4,036 → 4,046 → 4,060
🛑 Stop Loss: Below 3,995
⚡ Confirmation: Bullish engulfing or CHoCH above 4,012–4,016 with MACD crossover upward.
📊 Bias Rationale: The market continues to respect higher lows and absorb liquidity dips — indicating smart money accumulation around the Golden Zone.
💥 Breakout BUY Setup
Trigger: Break & close above 4,025
Retest: 4,022–4,024
🎯 Targets: 4,036 → 4,046 → 4,060 → 4,082
🛑 Stop Loss: Below 4,010
📉 SELL SCENARIO (Contingency Setup)
⚠️ Sell Zone: 4,025 – 4,036 (liquidity pocket + supply zone)
🎯 Targets: 4,012 → 4,004 → 3,985 → 3,965
🛑 Stop Loss: Above 4,046
⚡ Confirmation: Sharp rejection or RSI divergence >65 from 4,025–4,030 area.
📉 Break & Retest SELL Setup
Trigger: Break below 3,995
Retest: 4,000–3,997
🎯 Targets: 3,982 → 3,965 → 3,945
🛑 Stop Loss: Above 4,008
⸻
📰 Fundamental Watch
• Asia session: Low-impact day; volatility expected from liquidity sweeps.
• US Dollar Index (DXY) holding above 106 — mild pressure on gold short-term.
• Global markets: Traders positioning ahead of Fed and NFP later this week, keeping gold in range mode for now.
⸻
📌 Key Levels
Resistance: 4,025 / 4,036 / 4,046 / 4,060
Support: 4,012 / 4,004 / 3,995 / 3,982
Golden Zone: 4,016 – 4,008
Break Buy Trigger: > 4,025
Break Sell Trigger: < 3,995
⸻
✅ Summary (Expert View)
Gold remains bullish-to-neutral, consolidating between 4,004–4,025.
The Fibonacci Golden Zone (4,016–4,008) continues to act as the core decision area — expect Asia to attempt a liquidity sweep before breakout.
⚡ Expert Bias: BUY setup favored above 4,008, targeting 4,036–4,046.
Bearish bias only if 3,995 breaks cleanly.

XAU/USD BULLISH CONTINUATION SETUPAnalysis:
On the XAU/USD (Gold vs USD) chart, price action shows a strong bullish structure forming after multiple Change of Character (CHoCH) and Break of Structure (BOS) confirmations. The market recently created an equal low (EQL) around the 3990–3995 zone, indicating potential liquidity build-up below.
Price has since rebounded from this demand area and is currently trading near the entry zone (around 4007–4008), suggesting a possible bullish continuation if structure holds.
Key observations:
Demand Zone: 3990–3995 region — a high-probability area where buyers previously stepped in.
Entry Level: Around 4007 — ideal for a long setup upon bullish confirmation.
Target Zone: 4060–4066 — aligning with the previous weekly high, acting as a strong liquidity target.
Stop Loss (Implied): Below 3988 zone, under equal lows for risk management.
Bias:
Bullish — as long as price holds above 3990 and maintains structure, the next push toward 4060–4066 remains likely.

XAU/USD – Bearish Continuation Outlook (Smart Money Framework)XAU/USD – Bearish Continuation Outlook (Smart Money Framework)
🧭 Market Structure Overview
The major structure is bearish — confirmed by a Market Structure Break (MSB) after the last swing high.
Every bullish move since then is viewed as a retracement into premium price for better short entries.
Smart Money likely accumulating shorts above internal liquidity levels before driving price lower.
🟩 Premium Supply Zones (Sell Areas)
1️⃣ Be-BB (Bearish Breaker Block) → 4,180 – 4,240
💣 Main shorting area
Price expected to tap this level to mitigate sell-side imbalance.
Watch for liquidity grab above 4,060 before reversal.
Confirmation: bearish engulfing or BOS on lower timeframes (LTF).
2️⃣ Be-OB (Bearish Order Block) → 4,260 – 4,320
🚫 Last line of defense for bears
If price reaches here, expect a strong rejection due to trapped buyers and institutional orders.
Perfect “last tap” zone before deep markdown.
🟥 Discount Demand Zones (Targets)
🔻 Primary Demand Zone Area → 3,820 – 3,870
Previous accumulation zone (high-volume node).
Take-profit target for swing shorts.
Potential re-entry area for Smart Money to reload buys later.
🎯 Expected final destination if bearish pressure sustains.
📉 Bearish Scenarios
⚔️ Scenario 1 – Textbook Smart Money Setup
Price retraces to 4,060–4,180 zone (Be-BB).
Liquidity grab above 4,060 (previous high).
Bearish rejection → BOS → Sell continuation.
Targets: 3,939 → 3,870 → 3,820.
💥 Most probable scenario.
⚔️ Scenario 2 – Deep Retracement Then Dump
Bulls push higher into 4,260 (Be-OB).
Liquidity sweep and institutional fill.
Massive rejection → sell-off continuation.
🔥 Deeper pullback = bigger sell move later.

Can gold prices go long amid a narrow stalemate?#XAUUSD TVC:GOLD OANDA:XAUUSD
Gold prices continued to fluctuate narrowly throughout the evening⚖️, with the hourly and 2-hour moving averages converging in the 4010-4005 range, as both bulls and bears awaited a clear directional decision from the market.📊
However, from a technical perspective, gold prices have failed to break below the 4-hour moving average support at 3995 and the daily MA5 at 3985📈. These are crucial short-term support levels🚀, and the fact that gold prices haven't broken them confirms strong buying support below💪. This suggests that any short-term decline should be viewed as a technical correction rather than a market reversal.🤔
Therefore, although the short-term direction is not yet clear, considering the support formed by the 4-hour moving average and the daily MA5, I remain bullish and await a breakout from the consolidation pattern in gold prices🐂.
There may not be much clear information tonight, so let's take a look at the performance of gold prices in the Asian session👀. In summary, the current trend is still in an upward channel. As long as the 3995-3985 level holds, I will maintain a bullish view. On the upside, pay attention to the short-term resistance at 4020-4030🤩.

Above 4000, continue to be bullish on gold.#XAUUSD OANDA:XAUUSD TVC:GOLD
Gold prices fell after opening lower in Asian trading today, but rebounded after touching the key support zone of 3960-3950 and then entered a narrow range of fluctuation. Judging from the current trend, gold is still in an upward channel, and the price is still stabilizing above the daily MA5. Therefore, as long as it does not break below the daily MA5 of 3985, we can continue to maintain a bullish view.
Observing the 1H and 4H charts, we can see that the moving average support is basically maintained in the 4010-4000 range. If the gold price retraces to this range in the short term, we can consider going long on gold. Meanwhile, the first resistance level to watch is 4035-4045, which is both the rebound high point that gold prices repeatedly tested last Friday and the location of the daily MA10 moving average. Only by breaking through and stabilizing above this level will gold prices further test the upper resistance of 4050, or even higher.

XAU/USD – Gold Accumulates Before Breakout, Target 4,096 USD🔍 Market Context
Gold is trading within a symmetrical triangle pattern , reflecting short-term accumulation before forming a new breakout wave.
After a sharp decline from the peak of 4,096 USD, the market has shown two instances of Change of Character (ChoCH) – an early sign indicating the return of buying pressure.
As long as the price holds above the 3,959 – 3,917 USD range, the short-term bullish structure remains intact. This support zone serves as a crucial “discount zone” in the current accumulation cycle.
💎 Key Technical Zones
• Support Zone 1: 3,959 USD → main structure holding area, coinciding with the lower trendline.
• Support Zone 2: 3,917 USD → final liquidity reaction zone.
• Resistance Zone: 4,040 USD → potential break & retest area.
• Liquidity Zone: 4,096 USD → expansion target if the peak is broken.
🎯 Trading Scenarios
1️⃣ BUY Setup – Favoring the bullish structure
• Entry: 3,959 – 3,917 USD
• Stop Loss: 3,905 USD
• Take Profit:
– TP1: 3,985
– TP2: 4,040
– TP3: 4,072
– TP4: 4,096
✳️ “Buy the discount” – prioritize buying orders at the confluence support zone of trendline + FVG to follow the SMC flow.
2️⃣ SELL Scalp – Secondary strategy when price reacts at the peak
• Entry: 4,096 USD
• Stop Loss: 4,108 USD
• Take Profit:
– TP1: 4,072
– TP2: 4,040
– TP3: 3,985
✳️ “Sell the premium” – only activate if there is a strong price rejection signal at the liquidity peak.
💬 Conclusion
The short-term trend of gold remains bullish as the price stays above the trendline and continuously forms higher lows.
The main strategy is buy the dip – sell reaction around the 3,959 → 4,096 USD range.
The confirmation point for a strong bullish trend will be when the price closes steadily above 4,040 USD .
“Smart money accumulates in silence before the market makes noise.”
⏰ Timeframe: 1H
📅 Update: 03/11/2025
✍️ Analysis by: Captain Vincent

November Gold Paradox: Expected Strength Meets Blurred Direction
🍂 November typically brings seasonal bullish moves for Gold; demands from India and China, central bank interest, and safe-haven flows as the year winds down.
⭐But November 2025 opens with hesitation, not momentum.
October closed with fresh all-time highs, followed by a sharp end-month correction that broke short-term structure. Now, Gold begins November range-bound, lacking both clarity and fundamental conviction.
Contributing to this indecision is the U.S. government shutdown, which has delayed critical economic data. Without jobs reports or inflation metrics, the Fed has no updated visibility and traders are left without macro confirmation to support directional conviction. While shutdowns often support Gold as a safe haven, the current blackout has instead amplified uncertainty.
🔹 This first week already carries weight: ISM Manufacturing PMI on Monday (negative for Dollar as of recent release) and ADP Employment on Wednesday; two of the few confirmed releases still standing despite the shutdown. They could offer short-term directional clues if volatility aligns with structure, but just as easily trigger reactive spikes that fade within hours. Either way, the message is the same let structure confirm before conviction takes over.
Until that changes, structure not sentiment is the only valid guide.
📚 November’s Setups in Disguise
Gold is trading November more in anticipation.
Because the market isn’t lost, but simply waiting for structure to confirm direction.
Our metal is moving between defined zones, reacting level to level, not to headlines or speculation.
For now, price is holding inside a decision area, no breakout yet and that telling us to be patient.
Here’s the paradox:
→ If Gold begins to rally this month, the whispers of an early Fed pivot will return. Risk appetite expands, and momentum traders chase continuation.
→ If it sells off, those same expectations get priced out. The safe-haven flows unwind, and bearish narratives resurface.
→ But if Gold simply stays trapped in a wide, reactive range both buyers and sellers become liquidity for one another if they do not pay attention.
And that’s the part most traders miss. November is a preparation month.
Volatility without confirmation is dangerous.
→ Read the structure, not the headlines.
→ Trade the reaction, not the assumption.
→ Focus on your system, not the noise.
Clarity will come, but maybe not in the first week.
⚖️ The Mindset Shift This Market Demands
Beware this not the Gold environment we were trading even two months ago.
We’ve entered a phase where volatility has changed: one-minute candles can travel 200+ pips, and price can sweep both sides of structure in minutes. Volumes in a day can exceed 2000+ pips.
🔹 Think in wider zones, not narrow scalps.
High timeframe levels — like H1/30M and H4 — are providing more stability in these volatile conditions. Entries defined there, confirmed on M15 or M5, are showing better follow-through.
🔹 Consider reducing your lot sizes.
Not as a rule, but as a response to the increased range and unpredictability. What worked with older volatility may now lead to outsized losses in the blink of an eye.
🔹 Let go of urgency.
This isn’t about catching every move. In fact, the best setups in this market come from not chasing, but letting structure unfold first. 1 good setup/day is more than enough.
🔹 Trade with the trend first — countertrend only with caution.
The current volatility makes every retracement look like opportunity, but most reversals are just liquidity sweeps. Until structure confirms a real shift, fading moves is riskier than riding them.
XAUUSD has changed pace again. And the traders who are adapting ,without needing to predict ,are the ones who’ll stay in profit in this cycle.
This November isn’t a month for bold predictions, so let’s trade what’s real, adjust often, and survive cleanly into December, with capital and clarity intact.
If this article gave you clarity for the weeks ahead, drop a 🚀 and follow us ✅for Trading Psychology articles and daily ideas.

Today's gold trading strategyCentral bank gold purchases + Diversification away from the US dollar
Global central banks increase holdings to record levels: In the third quarter of 2025, global central banks' net gold purchases reached 220 tons (up 28% compared to the previous period), and 95% of the surveyed central banks plan to continue increasing their holdings in the next 12 months. Central banks in China, Kazakhstan, and others have been increasing their purchases continuously, forming a "buying buffer" at the $4,000 level, which provides a long-term supporting logic that is irreversible.
The acceleration of de-dollarization is beneficial: 73% of the surveyed central banks predict that the share of US dollar reserves will decrease in the next five years. The substitutive value of gold as a non-credit asset is prominent, and the willingness of central banks in emerging markets to increase their holdings is particularly strong (48% plan to increase holdings). Structural demand supports the upward movement of the gold price median.
Investment demand experiences explosive growth: In the third quarter of 2025, global gold investment demand reached 537 tons (up 47% compared to the previous year), and the "fear of missing out" (FOMO) mentality pushed individual and institutional funds to continuously flow in, forming a positive cycle of "fundamental factors + capital factors".
Today's gold trading strategy
buy:3990-4000
tp:4010-4020
sl:3980

Today's gold trading strategyExtreme Risk Hedging: The Underestimated "Black Swan" Defense Value
The "gray rhino" threat of global debt risks: According to the International Finance Association (IIF), the global debt scale will exceed 400 trillion US dollars in 2025, with the debt/GDP ratio reaching 360%, setting a new record high. The default rate of emerging market dollar bonds has risen from 5% in 2024 to 8%, and countries like Argentina and Turkey have shown signs of debt restructuring. Gold, as the "ultimate payment tool during a debt crisis", has been severely undervalued in terms of its hedging value - during the 2008 financial crisis and the 2012 European debt crisis, the increase in gold prices during the stage of debt risk outbreak was over 20%, and currently, the debt risk premium corresponding to 4023 US dollars only reflects 30%, with significant upward potential.
Inflation hedging of global supply chain "fragmentation": The World Bank's "Global Supply Chain Report 2025" shows that the "regionalization" of global supply chains has led to a 12% increase in intermediate product costs, with the transportation costs of energy and metals rising by more than 20%. This "supply chain inflation" is different from traditional demand-driven inflation and has the characteristics of "strong stickiness and long duration", while the hedging efficiency of gold against supply chain inflation (correlation 0.8) is significantly higher than that against demand-driven inflation (correlation 0.5). Currently, the market's pricing of supply chain inflation is insufficient, and the anti-inflation attribute of gold has not been fully exerted.
Hedging demand for "multi-point spread" of geopolitical conflicts: In addition to the conflicts in the Middle East and Russia-Ukraine, "hidden geopolitical risk points" such as shipping safety in the Red Sea, the situation on the Korean Peninsula, and political unrest in South America are also brewing - the number of attacks on merchant ships in the Red Sea increased by 50% month-on-month in October, the number of intercontinental missiles launched by North Korea reached a new high since 2017, and the new government of Argentina's implementation of the "dollarization" policy has triggered domestic unrest. These risk points have not yet formed a market consensus, but if a "single point breakthrough" occurs (such as the interruption of shipping in the Red Sea), it will trigger concentrated buying of gold for hedging, pushing the gold price to increase by more than 2% in a single day.
Today's gold trading strategy
buy:4000-4010
tp:4020-4030
sl:3990
