XAU USD Last bullish leg ?Price has broken short-term bearish structure and moved above the moving-average channel with strong momentum, indicating a shift toward bullish control. The rising trendline is holding as support, confirming structural reversal.
Fibonacci levels provide clear upside targets, with 38.2% at 4040–4050 as the first objective, followed by a constrained upper target near 4070, just below the 61.8% retracement and prior supply zone.
As long as price holds above the breakout zone and trendline, continuation toward 4040–4070 remains the most probable outcome.
Xauusdupdates

Gold (XAU/USD) 4H Chart Analysis – Short-Term Reversal from ?Technical Overview:
Gold has recently rebounded from a High Demand Zone around the $3,900–$3,910 region, showing clear signs of buyer re-entry after a prolonged bearish correction. The candle structure suggests strong bullish intent, with higher lows forming and a potential continuation toward the next liquidity area.
Key Observations:
🔹 High Demand Zone: Price reacted strongly here, indicating institutional buying pressure.
🔹 High Prop POI (Point of Interest): Served as a key accumulation level before the breakout.
🔹 SMC Trap: Indicates a prior liquidity grab, trapping late sellers before the move up.
🔹 Bullish Momentum Building: Consecutive bullish candles after rejection from the demand zone strengthen the reversal bias.
Target Projection:
🎯 Immediate Target: $4,080 – $4,100 (aligned with local resistance and liquidity grab zone).
🛑 Support: $3,905 (must hold to maintain bullish structure).
💎 Extended Target (if momentum continues): $4,160 – $4,180 (previous major swing high zone).
Summary:
Gold is showing a short-term recovery phase within a broader bullish structure. A confirmed 4H close above $4,030 would likely propel price toward the $4,100 region, while a drop below $3,900 would invalidate the bullish setup.
📊 Suggested Title:
"Gold Rebounds from Key Demand Zone, Eyes $4,100 Resistance 🔥"

XAU/USD 29 October 2025 Intraday AnalysisH4 Analysis:
-> Swing: Bullish.
-> Internal: Bullish.
Analysis and bias remains the same as analysis dated 20 October 2025.
Price has printed as per previous intraday expectation by printing a bearish CHoCH which indicates, but not confirms, bullish pullback phase initiation.
Price is currently trading within an established internal range, however, I will continue to monitor price with regards to depth of pullback.
Intraday expectation:
Price to continue bearish, react at either discount of 50% internal EQ, or H4 supply zone before targeting weak internal high priced at 4,380. 990.
Note:
The Federal Reserve’s sustained dovish stance, coupled with ongoing geopolitical uncertainties, is likely to prolong heightened volatility in the gold market. Given this elevated risk environment, traders should exercise caution and recalibrate risk management strategies to navigate potential price fluctuations effectively.
Additionally, gold pricing remains sensitive to broader macroeconomic developments, including policy decisions under President Trump. Shifts in geopolitical strategy and economic directives could further amplify uncertainty, contributing to market repricing dynamics.
H4 Chart:
M15 Analysis:
-> Swing: Bullish.
-> Internal: Bearish.
As expected, price has printed a bullish CHoCH to indicate bullish pullback phase initiation.
Price is now trading within an established internal range.
Intraday expectation:
Price to continue bullish, react at either premium of internal 50% EQ or M15 demand zone before targeting weak internal low, priced at 3,886.456.
Note:
Gold remains highly volatile amid the Federal Reserve's continued dovish stance, persistent and escalating geopolitical uncertainties. Traders should implement robust risk management strategies and remain vigilant, as price swings may become more pronounced in this elevated volatility environment.
Additionally, President Trump’s tariff announcements, particularly against China, are expected to further amplify market turbulence, potentially triggering sharp price fluctuations and whipsaws.
M15 Chart:

ANFIBO | XAUUSD - Bullish Head & Shoulder [10.29.2025]Hi traders, Anfibo's back!
XAUUSD Analysis – Daily Trading Plan
Overall Picture:
OANDA:XAUUSD recently reached a new ATH near $4,400/oz, before undergoing a healthy correction back to the $3,890 support level following an exceptionally strong rally fueled by geopolitical tensions. After this retracement, gold is now consolidating around the $4,000 zone, showing signs of breaking above the descending trendline on the H1 timeframe — a signal that short-term bullish momentum may be reemerging.
From a structural standpoint, this pullback appears to be part of a technical correction within an ongoing uptrend, not a trend reversal. Currently, the market is stabilizing and setting up for a potential new wave upward. I’m personally watching for a Head & Shoulders (H&S) formation to develop — this could offer optimal Buy and Sell opportunities depending on which neckline breaks first.
I still believe gold is likely to revisit the $4,200 area soon , as long as the $3,890 support holds firm and global risk sentiment continues to favor safe-haven assets.
Trading Plan for Today:
>>> SELL ZONE:
ENTRY: 4135 - 4150
SL: 4165
TP: 4045 - 4010 - 4000
>>> BUY ZONE:
ENTRY: 4000 - 4010
SL: 3990
TP: 4135 - 4150 - 4200
Risk Management:
- Prioritize Buy setups following the higher-timeframe trend; Sell only for intraday scalps.
- Maintain a minimum Risk:Reward ratio of 1:2.
- Avoid entries during major geopolitical or economic announcements.
- Monitor the Head & Shoulders pattern closely — confirmation will guide the next major move.
Conclusion:
Gold has completed a healthy correction after its parabolic surge to $4,400, and the market is now regrouping around the $4,000 zone, with early signs of renewed bullish momentum. As long as $3,890 remains intact, the broader trend remains bullish, and I expect a potential rebound toward $4,200 in the near term.
Patience and precision are key here — waiting for the Head & Shoulders formation to confirm will provide the best entry signals for both sides of the market. Until then, the bias remains bullish with a short-term recovery underway.
GOODLUCK, LOVE U GUYS!

Focus on the Federal Reserve, short once in 4020.#XAUUSD OANDA:XAUUSD TVC:GOLD
Last night, I gave everyone a trading strategy to short at 3975-3990. It can be said that there were several opportunities after the Asian session opened. As long as you followed the strategy and executed the short order, I believe you will definitely have a rich return if you seize any of the opportunities.
However, please note that trading is never done blindly. Price trends change over time, so please combine strategies with flexible responses. For example, since the current gold price has broken through the trendline resistance, short-term traders should be more cautious.
With the trend resistance broken, the short-term bulls have strengthened further. The first resistance level to watch is 4000-4005. As a psychological barrier for previous defense, gold prices will definitely test this resistance level first if they want to rise further. If this level is broken, gold will continue its upward trend and further test yesterday's rebound high of 4020. This is also the key level that bears need to defend today. Therefore, I believe we should not rush into trading in the short term. We can patiently observe the market performance. When the gold price rebounds to the 4010-4020 resistance range and encounters resistance, we can consider shorting gold appropriately.

GOLD (XAU/USD): FED ALERT! IS THE BOTTOM IN?Hello TradingView Community! Gold is standing at a critical juncture. The convergence of the US Federal Reserve (FED) decision, US-China trade talks, and geopolitical risks is setting the stage for significant market movement.
1. 🌍 Fundamental Analysis (Macro): Geopolitics vs. Rate Cuts
Bearish Headwinds: Positive developments in US-China trade discussions eased comprehensive trade war fears, causing safe-haven demand to drop and pushing Gold below the $3,900 mark.
Strong Support Factors:
The market is heavily anticipating the FED will cut borrowing costs by 25 basis points at the conclusion of its two-day meeting (scheduled for tonight/early tomorrow). Lower rates typically support Gold (a non-yielding asset).
Escalating US-Russia geopolitical tensions (new sanctions, canceled meetings) and the ongoing US government shutdown highlight internal instability, providing a continuous underlying bid for the safe-haven metal.
2. 📈 Technical Analysis: Wave C Bottom and Rebound Targets
Based on the Elliott Wave structure on your chart, the technical picture is sharp:
Wave C Completion: The recent drop to $3,892.152 appears to have completed the 5-wave structure of the larger corrective Wave C. This suggests a strong possibility that a major bearish cycle has ended.
LONG Target: If the rebound scenario holds, Gold is targeting the crucial Fibonacci resistance zone: $4,135 - $4,180.
Key Levels to Watch:
Confirmation Resistance: A decisive break above $4,042 will strongly confirm the upward momentum.
Stop-Loss (SL): Risk management demands a strict stop-loss placed just below the Wave C low at $3,892.152.
Conclusion: The combination of geopolitical support, FED rate cut expectations, and the technical signal of a potential Wave C bottom offers an attractive Risk/Reward setup for LONG (Buy) positions. All eyes are now on the FED announcement tonight/tomorrow morning!
#XAUUSD #GOLD #FED #ElliottWave #TradingView #MarketUpdate What are your thoughts? Are you going Long or Short into the FED event? 👇
Would you like me to draft a quick contingency plan for Gold in case the FED's statement is unexpectedly hawkish (less dovish than expected)?

Today's gold trading strategyLoose expectations are overpriced.
The current market has already regarded a 25 basis point rate cut in October as "a done deal", and even anticipates a further rate cut in December (with a 91% probability). Under such extreme expectations, the previous gains in gold have overestimated the policy benefits. Once the Federal Reserve releases a cautious signal, it will trigger a "buy expectation, sell reality" correction.
Internal divisions conceal hawkish risks.
There are profound differences within the Federal Reserve regarding the subsequent policy path - Milan and others who are dovish support further easing to address employment risks, while Schmidt and others who are cautious emphasize that "the current policy is slightly tight and appropriate", and need to be vigilant about inflation fluctuations. Against the backdrop of government shutdown leading to data "vacuum", Powell is likely to retain policy flexibility and will not explicitly commit to a rate cut in December. This "vague hawkish" statement will directly suppress the gold price.
Today's gold trading strategy
sell:3980-3990
tp:3970-3960
sl:4000

GOLD (XAU/USD): FED ALERT! IS THE BOTTOM IN?Hello TradingView Community! Gold is standing at a critical juncture. The convergence of the US Federal Reserve (FED) decision, US-China trade talks, and geopolitical risks is setting the stage for significant market movement.
1. 🌍 Fundamental Analysis (Macro): Geopolitics vs. Rate Cuts
Bearish Headwinds: Positive developments in US-China trade discussions eased comprehensive trade war fears, causing safe-haven demand to drop and pushing Gold below the $3,900 mark.
Strong Support Factors:
The market is heavily anticipating the FED will cut borrowing costs by 25 basis points at the conclusion of its two-day meeting (scheduled for tonight/early tomorrow). Lower rates typically support Gold (a non-yielding asset).
Escalating US-Russia geopolitical tensions (new sanctions, canceled meetings) and the ongoing US government shutdown highlight internal instability, providing a continuous underlying bid for the safe-haven metal.
2. 📈 Technical Analysis: Wave C Bottom and Rebound Targets
Based on the Elliott Wave structure on your chart, the technical picture is sharp:
Wave C Completion: The recent drop to $3,892.152 appears to have completed the 5-wave structure of the larger corrective Wave C. This suggests a strong possibility that a major bearish cycle has ended.
LONG Target: If the rebound scenario holds, Gold is targeting the crucial Fibonacci resistance zone: $4,135 - $4,180.
Key Levels to Watch:
Confirmation Resistance: A decisive break above $4,042 will strongly confirm the upward momentum.
Stop-Loss (SL): Risk management demands a strict stop-loss placed just below the Wave C low at $3,892.152.
Conclusion: The combination of geopolitical support, FED rate cut expectations, and the technical signal of a potential Wave C bottom offers an attractive Risk/Reward setup for LONG (Buy) positions. All eyes are now on the FED announcement tonight/tomorrow morning!
#XAUUSD #GOLD #FED #ElliottWave #TradingViewIndia #MarketUpdate What are your thoughts? Are you going Long or Short into the FED event? 👇

ElDoradoFx PREMIUM – GOLD ANALYSIS (29/10/2025, LONDON SESSION)1. Market Overview
Gold recovered strongly from 3,918 lows, printing a clean bullish reversal overnight during Asia, now trading near 3,990–3,998.
The market structure has shifted short-term bullish after a clear CHoCH and BOS, but price is testing heavy resistance at the psychological 4,000 level and the H1 supply zone (3,995–4,013).
London session opens at a decisive point — momentum favors buyers, but a rejection at 4,000–4,013 could trigger a short-term pullback before continuation.
⸻
2. Technical Breakdown
🔹 Daily (D1):
• Price bounced from 3,918 forming a bullish rejection candle.
• RSI turning upward near 50, showing recovery strength.
• Long-term uptrend intact above the 100 EMA (3,842) but short-term correction not complete.
✅ Bias: Neutral to bullish while above 3,918.
🔹 H1:
• Market showing a confirmed CHoCH above 3,965 with bullish momentum candles.
• Currently retesting the descending trendline and 200 EMA (4,000–4,013) zone.
• RSI near 58, MACD histogram positive but slowing — possible short-term exhaustion.
⚠️ Bias: Bullish but watch for rejection at 4,000–4,013.
🔹 15M–5M:
• Clear bullish wave with strong EMA alignment (8 > 20 > 50).
• Structure forming higher highs and higher lows.
• Minor divergence appearing near 3,998, indicating potential retracement to 3,965–3,955.
🎯 View: Buy pullbacks into key retracement zones.
⸻
3. Fibonacci Analysis (Swing 3,918 → 3,998)
• 38.2% = 3,972.6
• 50.0% = 3,958.6
• 61.8% = 3,945.0
🟩 Fibonacci Golden Zone: 3,958 – 3,945
Confluence: prior H1 resistance turned support + trendline retest zone.
⸻
4. High-Probability Trade Scenarios
🟩 Bullish Scenario (Primary Bias)
• Buy Zone: 3,972 → 3,958 (Golden Zone)
• Confirmation: Bullish engulfing or CHoCH on 5M
• Targets: 3,991 → 4,004 → 4,013 → 4,030
• Stop Loss: Below 3,945
• Notes: Structure remains bullish as long as 3,945 holds.
🟥 Bearish Rejection (Countertrend)
• Sell Zone: 4,004 – 4,013 (H1 Supply + EMA Confluence)
• Confirmation: Rejection candle / Bearish divergence
• Targets: 3,974 → 3,959 → 3,945
• Stop Loss: Above 4,020
⚡ Breakout Setup
• Buy Breakout: Above 4,013 (retest holds) → Target 4,030 → 4,070
• Sell Breakout: Below 3,945 → Target 3,918 → 3,904
⸻
5. Fundamental Watch
• No major UK data early; focus remains on USD Index (DXY 106.2).
• US 10-year yields stabilizing; if yields drop, gold could push above 4,000.
• Market sentiment cautiously bullish ahead of mid-week U.S. news.
⸻
6. Key Technical Levels
Type Levels (USD)
Resistance 3,998 / 4,004 / 4,013 / 4,030 / 4,074
Support 3,972 / 3,958 / 3,945 / 3,918
Golden Zone 3,958 – 3,945
Break Buy Trigger > 4,013
Break Sell Trigger < 3,945
⸻
7. Analyst Summary
Gold shows strong intraday bullish momentum but faces resistance at 4,000–4,013.
If London retraces to 3,972–3,958, this area becomes the Golden Opportunity Zone for continuation buys.
A breakout above 4,013 confirms trend reversal to 4,030–4,074.
Failure to hold 3,945 will re-expose 3,918 lows.
⸻
8. Final Bias Summary
Main Bias: Bullish
Secondary Bias: Short-term sell at 4,013 only if strong rejection
Golden Zone (Buy): 3,958 – 3,945
Breaking Price: Above 4,013 for buys / Below 3,945 for sells
London Outlook: Expect minor dip, then bullish continuation if support holds.

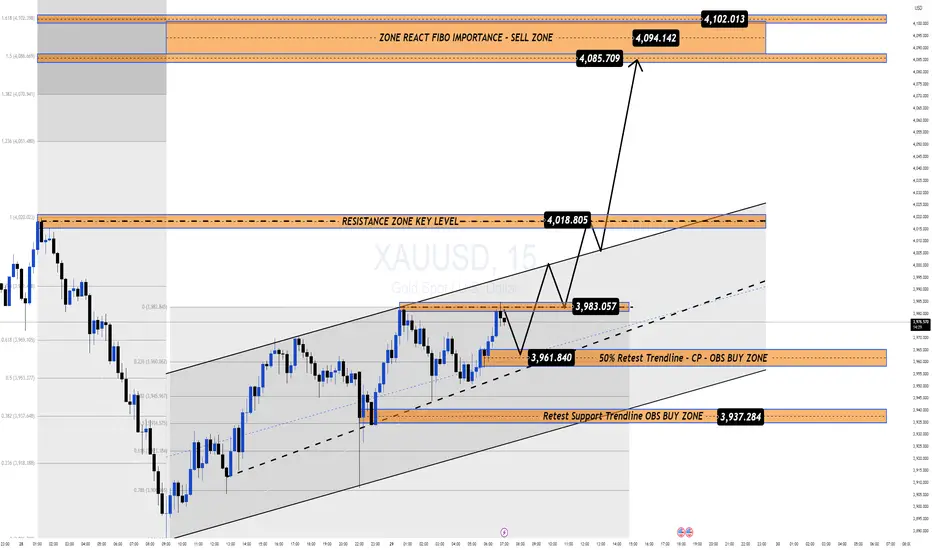
Gold Recovers 1000 Pips Ahead of FOMC: Key Levels in Focus📊 Market Overview
After a sharp selloff that shook long positions, Gold has rebounded nearly 1000 pips, recovering from the 388x area toward 398x ahead of the upcoming FOMC meeting.
Despite the short-term recovery, Gold remains down around 3.5% this week, reflecting cautious sentiment as traders reposition before the Fed decision and amid fading U.S.–China trade tensions.
Currently, price is trading near $3,980–3,990 during the Asian session, consolidating under the psychological $4,000 zone.
💎 Technical Outlook (H1–M15)
Gold continues to trade within a short-term ascending channel, forming a corrective recovery inside a broader downtrend.
Immediate Support Zones:
• 3,961 – 3,937 → Trendline retest & OBS Buy Zone
• 3,918 → Structural invalidation area
Resistance & Key Reaction Levels:
• 4,018 – 4,085 → Mid-term key resistance
• 4,094 – 4,102 → Major Sell Zone (Fibo 1.5–1.618 confluence)
📍If Gold breaks and holds above 4,018, momentum could extend toward 4,085 – 4,102, where strong selling pressure may reappear.
📍If the price rejects at 4,094 – 4,102, expect a corrective move back toward 3,961 – 3,937, aligning with the channel base and trendline retest.
🌍 Macro Context – FOMC Ahead
Markets expect the Fed to cut rates by another 25bps, following September’s “risk management” cut.
However, if Powell’s tone turns hawkish, Gold could face renewed downside pressure as rate-cut expectations fade, particularly for December.
Conversely, a cautious or dovish tone emphasizing inflation risks and slower growth could boost Gold above $4,100 in the short term.
Meanwhile, easing trade tensions between the U.S. and China and the ongoing equity rally may continue to limit safe-haven demand.
🧭 Summary
Gold is holding a short-term recovery bias, yet the medium-term trend remains fragile ahead of the FOMC.
Expect volatility around the 4,000–4,100 zone, with the Fed statement likely to set the next major direction.
🛡️ Stay patient — liquidity builds before clarity, and key reactions around $4,094–4,102 will reveal the next macro impulse.
Gold Extends Decline Below $4,000 as Risk Appetite Returns🔍 Market Context
Gold continues to struggle amid renewed optimism around US–China trade talks.
The shift in sentiment has reduced safe-haven demand, while softer expectations of further Fed rate cuts keep the US Dollar capped — offering limited downside support for XAUUSD.
However, the technical landscape remains clearly bearish.
The break below the $4,000 handle confirms continuation of the downtrend first outlined in early-week plans.
📊 Technical Analysis
Structure: Gold maintains a clean bearish channel on the H1–H4 frame.
Immediate resistance: $3,985 – $4,000 (former support, now supply zone).
Target zones:
• Short-term liquidity area near $3,925–$3,930
• Extended target sits around $3,880–$3,860, aligning with Fibo 1.618.
Invalidation: Only a sustained break and hold above $4,020–$4,030 would neutralize this short-term bearish bias.
🎯 Trading Outlook
If gold retests the broken $4,000 zone and fails to regain it,
expect sellers to extend control toward $3,920 or lower ahead of the FOMC meeting.
That event may later define the next recovery point — but for now, momentum remains firmly on the downside.
⚜️ Summary
Gold’s recent slide isn’t random — it’s structural.
The market is rebalancing after excessive bullish sentiment,
and liquidity below $3,900 is likely to attract attention before any significant rebound.
Watch the reaction near $3,920–$3,880 —
that’s where the next meaningful decision for gold may emerge.
📊 MMFLOW TRADING Insight:
“Smart money doesn’t chase candles — it waits for liquidity to shift.”

Today's gold trading strategyPolicy expectations of "pseudo-loosening" hard to support gold prices
Although the market has priced in a 25 basis point rate cut by the Federal Reserve in advance, this expectation has shown obvious signs of loosening. On the one hand, although the core PCE inflation in the US has declined, it still remains above the 2% target. The president of the Dallas Federal Reserve has explicitly stated that "a single rate cut does not represent the start of a loosening cycle", suggesting that the subsequent policy will adopt a wait-and-see attitude. On the other hand, this rate cut is more of a "preventive adjustment" to the economic resilience rather than an emergency measure to deal with a recession, and it cannot be compared with the intensity of the 2020 loosening cycle. More importantly, although the US dollar index has temporarily retreated to around 98.6, it still holds the support of the 50-day moving average. Once the Federal Reserve sends a signal of "pausing rate cuts", the US dollar is likely to resume its upward trend, exerting a secondary pressure on gold prices.
Today's gold trading strategy
sell:3970-3980
tp:3960-3950
sl:3990

XAUUSD | Gold to drop 2000PIPS, where is the best sell zone?🔍 Market Context
After breaking the medium-term uptrend structure at the main Trendline , gold has formed a clear sequence of Lower High – Equal Low (EqL) , indicating a phase shift from bullish to bearish.
Currently, the price is fluctuating around the 3,960–3,970 USD zone – this is a temporary liquidity accumulation area before heading up to retest the resistance at 4,015–4,050 USD , which was previously a Demand Zone now turned into a Supply Zone .
If a strong bearish reaction occurs here, it is highly likely that the price will extend its decline towards the Order Block 3,945–3,960 USD zone, or even deeper to the Premium Zone 3,884 USD .
💎 Key Technical Structure
Main Trendline: broken, confirming a structure change (ChoCH).
Resistance Zone: 4,010–4,015 → quick reaction resistance.
Supply Zone: 4,043–4,060 → strong technical pullback zone.
Premium Zone: 3,884–3,900 → discount zone, potential temporary bottom.
📈 Trading Scenarios
1️⃣ SELL Zone 1 – Scalp Reaction at Resistance Zone
Entry: 4,010 – 4,015
SL: 4,025
Take Profit : 4,005 - 3,995 - 3,975 - 3,965 - Open
➡️ Quick scalp reaction at nearby resistance – suitable for London/NY session trading.
2️⃣ SELL Zone 2 – Major Retest at Supply Zone
Entry: 4,043 – 4,060
SL: 4,065
Take Profit : 4,050 - 4,040 - 4,030 - 4,020 - 4,010/Open
➡️ Main setup – retest of supply zone confluencing with broken trendline, high probability if strong rejection on H1/H4.
3️⃣ SELL Continuation – Break & Retest below 3,945 USD
Entry: 3,945 – 3,950
SL: 3,965
TP: 3,884
➡️ Setup breaks EqL bottom confirming downtrend continuation, targeting Premium Zone.
4️⃣ BUY Setup – Reversal at Premium Zone 3,900 USD
Entry: 3,900
SL: 3,880
TP1: 3,910 - 3,920 - 3,930 - 3,940 - 3,950/Open
✅ Condition:
Only buy when a strong reaction candle appears (long-tail rejection / ChoCH bullish on M15–H1).
➡️ This is the final discount zone before major capital can return to the market – technical reversal setup, low risk / high reward.
⚠️ Risk Management
Prioritize SELL at supply zones, BUY at Premium – avoid trading mid-range.
Reduce volume in scalp setup (Sell 1).
If price closes above 4,070 → short-term downtrend is invalidated.
💬 Conclusion
Gold remains under short-term bearish pressure, however, the 3,884–3,900 USD zone could act as strong support.
The suitable strategy is to capitalize on the two resistance zones for Selling and observe technical Buying at the Premium bottom.
👉 Comprehensive Strategy:
Sell 4,010–4,015 | SL 4,025 | TP 4,005 → 3,965 🎯
Sell 4,043–4,060 | SL 4,065 | TP 4,050 → 4,010 🎯
Buy 3,900 | SL 3,880 | TP 3,910 → 3,950 🎯
🔥 “Trade with patience, react at precision zones — that’s how consistency is built.”
⏰ Timeframe: 1H
📅 Update: 28/10/2025
✍️ Analysis by: Captain Vincent

Gold Price Outlook – Trade Setup (XAU/USD)📊 Technical Structure
Gold price (XAU/USD) is trading near $3,965, with the upside capped at the $3,981–$3,990 resistance zone. The chart shows a recent rejection at resistance and sellers stepping in. Unless bulls break above $3,990, the bias remains bearish with a retest of $3,923–$3,915 support zone likely.
🎯 Trade Setup
Entry: $3,81–$3,989 (near resistance)
Stop Loss: $3,993
Take Profit: $3,930 / $3,915
Risk-Reward Ratio: ≈ 1 : 4.53
🌐 Macro Background
Gold is under renewed pressure as US–China trade optimism undermines safe-haven demand. U.S. President Trump said a trade deal with China could be finalized this week, which boosted market sentiment. As Kitco’s senior analyst Jim Wyckoff noted: “The U.S.-China trade tensions have really diminished, with a possible trade deal later this week after a summit meeting between Presidents Xi and Trump. That’s bearish for safe-haven metals.” 【FXStreet】
On the monetary policy side, the Federal Reserve is expected to cut interest rates by 25 bps, lowering the Fed Funds Rate to 3.75%–4.00%. CME’s FedWatch tool shows markets have priced in nearly a 100% probability of this move, with further easing expected in December. While this provides some support to gold, trade optimism currently outweighs Fed dovishness.
🔑 Key Technical Levels
Resistance: $3,981 – $3,990
Support: $3,923 – $3,915
Psychological Level: $4,000
📌 Trade Summary
Gold remains capped below $3,990 and is at risk of further declines toward $3,930–$3,915. Short positions near resistance are favoured, unless Fed surprises with a deeper cut or US–China trade talks collapse, which could flip sentiment.
⚠️ Disclaimer
This analysis is for reference only and does not constitute trading advice. Trading involves significant risk, and proper risk management is essential.

GOLD DOUBLE TOPS BEARISH DIVERGENCEAs depicted on the chart, Gold has confirmed a double tops bearish divergence on 4H time frame. This suggests that Big players will be off loading their profits to dip buyers before next rally. What to watch for is a close below yesterday's Opening candle $4,263 for the ultimate target of $3,982. If you take this trade stop loss or invalidation level is at $4,381. Have a great trading week fellow traders. cheers!!

ElDoradoFx PREMIUM – GOLD ANALYSIS (29/10/2025, ASIA SESSION)Gold (XAUUSD) closed the US session near 3,950 after rejecting from the descending trendline and the intraday 200EMA cap around 3,960–3,970.
The current structure shows a corrective rebound inside a broader bearish leg, with D1 still pointing down but short-term exhaustion visible around 3,885–3,900.
Asia opens with minor consolidation below resistance, setting the stage for either a continuation breakdown or a temporary pullback to 3,970–3,990 before sellers re-enter.
⸻
2. Technical Breakdown
Daily (D1)
• Still in a clear corrective phase after failing to hold 4,100–4,140 resistance.
• Price now hovering above the 100-day EMA at 3,842, which acts as medium-term support.
• RSI at 47 – neutral but with downside pressure.
Bias: Bearish while below 3,996; looking for retracement sell setups.
⸻
1H Chart (H1)
• Price rejected from descending trendline near 3,970–3,980.
• Currently consolidating near 3,950, with structure forming a wedge under the 50EMA and 200EMA.
• MACD histogram turning flat, RSI recovering from 27 → 45 range.
Bias: Neutral-to-bearish; a rebound toward 3,970 may offer short opportunities.
⸻
15M Chart (M15)
• Micro bullish correction from 3,886 → 3,960, now forming lower highs.
• Momentum fading near 200EMA (3,955–3,960).
• RSI oscillating around 50; MACD decreasing – indicating loss of short-term momentum.
View: Expect a liquidity sweep into 3,970–3,985, then potential sell reaction.
⸻
5M Chart (M5)
• Tight consolidation between 3,948–3,960; lower timeframe CHoCH visible.
• EMA stack is compressing, hinting at volatility buildup.
• A clean break below 3,945 could trigger a new push to 3,920/3,900.
Short-Term View: Scalpers may watch for fake-out above 3,960 or breakout below 3,945.
⸻
3. Fibonacci Analysis (Last Swing: 4,019 → 3,886)
• 38.2% = 3,936
• 50% = 3,952
• 61.8% = 3,967
✅ Golden Zone = 3,952 – 3,967 → current price zone (high confluence).
⸻
4. High-Probability Trade Scenarios
🟥 Bearish Continuation (Primary Bias)
• Sell Zone: 3,952 – 3,970 (Fibonacci + 15M EMA confluence)
• Trigger: Bearish engulfing or 5M structure break below 3,945
• 🎯 Targets: 3,925 → 3,905 → 3,886 → 3,860
• 🛑 SL: Above 3,975–3,980
⸻
🟩 Bullish Reversal (Countertrend)
• Buy Zone: 3,910 – 3,920 (intraday demand)
• Trigger: Clear 5M CHoCH + bullish engulfing
• 🎯 Targets: 3,940 → 3,955 → 3,970
• 🛑 SL: Below 3,900
⸻
5. Fundamental Watch
• Asia session quiet — focus remains on USD and US yields after yesterday’s strong data.
• DXY remains elevated near 106.20 → limits upside on gold.
• Traders should anticipate low volatility early, followed by possible retracement during London buildup.
⸻
6. Key Technical Levels
Type Levels (USD)
Resistance 3,952 / 3,970 / 3,985 / 3,996
Support 3,930 / 3,910 / 3,886 / 3,860
Golden Zone 3,952 – 3,967
Break Sell Trigger <3,945
Reversal Trigger >3,970
⸻
7. Analyst Summary
Gold remains trapped below major EMA resistance and inside a corrective wedge.
The Golden Zone (3,952–3,967) aligns perfectly for fresh sell entries if momentum confirms.
Unless bulls reclaim 3,980+, the probability favors continuation toward 3,910 → 3,886.
Preferred Strategy:
Sell retracement from 3,952–3,970 (with confirmation).
If price breaks 3,945 → sell continuation.
Avoid buys unless 3,970 breaks and holds.
⸻
8. Final Bias Summary
Primary Bias: Bearish
Secondary Bias: Countertrend buy only from 3,910 support
High-Probability Zone: 3,952 – 3,967
Breakout Confirmation: Sell below 3,945
Invalidation: Above 3,980
⸻
🥇 ElDoradoFx PREMIUM 3.0 – PERFORMANCE 28/10/2025 💸
📊 Precision entries. Consistent gains.
━━━━━━━━━━━━━━━
🟢 BUY LIMIT +45 PIPS
🟢 BUY +80 PIPS
🟢 BUY +30 PIPS
🟢 BUY +90 PIPS
🟢 BUY +110 PIPS
🔻 SELL +60 PIPS
🟢 BUY +110 PIPS
📱 BTC BUY +600 PIPS
━━━━━━━━━━━━━━━
🏆 GOLD TOTAL: +525 PIPS
🪙 BTCUSD BONUS: +600 PIPS
💰 TOTAL DAILY PROFIT: +1,125 PIPS
📊 8 Signals → 8 Wins | 0 SL
🎯 Accuracy: 100% ✅
━━━━━━━━━━━━━━━
🔥 Flawless day! Every setup hit target with precision — GOLD and BTC both in perfect sync.
👏 Congratulations if you profited! ✅✅✅🚀🚀🚀

Why am I bearish when the market is bullish?#XAUUSD TVC:GOLD OANDA:XAUUSD
We have reminded everyone today that you can short gold in batches at key points, and now all short positions have been exited. When entering the market, it depends on the technology; when leaving the market, it depends on the mentality. Don’t be dominated by fear and greed. Profits belong to you only when you really get them in your hands. Otherwise, everything is just empty talk.
Short-term bears should not continue to participate blindly. By observing the hourly line trend, we can find that this is a typical upward trend. Therefore, bulls may still have a certain rebound momentum in the short term. But it should also be noted that there is pressure from the golden section point of 38.2%, or 3975, and it is also close to the downward trend line. Therefore, for evening trading, I think we can continue to be patient and wait, observe the performance of 3975-3990, and then consider appropriately participating in shorting gold after there is obvious pressure but it is not broken.

GOLD H1 OUTLOOKH1 Gold Looking Bearish Structure
Selling First Zone Of FVG
Sllibg Second Zone Of CISD
Target Old Low / Sell Side Liquidity
Stay Tuned Boost The Post And Follow Us

“Gold Rebounds from Demand Zone — Short-Term Recovery Ahead”Analysis:
Gold (XAU/USD) on the 4-hour chart shows a strong corrective decline after forming an SMC trap near the 4,250–4,300 zone, where liquidity was swept before a sharp selloff. Price has now reached the High Probability POI (Point of Interest) around the 3,850–3,880 region, showing early signs of a bullish reaction.
The recent candle structure indicates buyers are stepping in from this demand zone, confirming a potential short-term reversal. If momentum sustains, the first target zone lies around 3,950–3,980, aligning with minor resistance and previous imbalance fill.
Outlook:
📈 Bias: Bullish correction (short-term)
🧭 Key Support: 3,850 – 3,880
🎯 Target: 3,950 – 3,980
⚠️ Invalidation: Break below 3,840 may reopen bearish continuation toward 3,780

28/10/68 : XAUUSD ( US Session )Using it from US Session until 11.00AM , I'll new analysis and update at 12.00PM
Resistance
3947-3953
3936-3942
3930
Support
3918
3907-3912
3896-3901

#XAUUSD: Massive Drop Is In Making! Bears In ControlDear all,
We are seeing significantly increased bearish volume since yesterday now we think price is likely to remain bearish for couple of days or week so price could make major correction. Please wait for price to settle down.
Good Luck
Team Setupsfx_

#XAUUSD: +6000 Pips Swing Move In Making, Patience Pays!
Gold prices have fallen sharply as the DXY has regained strength. Following the recent significant sell-off, we can anticipate the potential direction of the price. Three key targets can be considered if the price moves in our favour. The first is a nearby target at $4000 which would represent a gain of 1100 pips. Subsequent targets should be determined according to your trading plan.
There are two potential entry points; if the first is invalidated the second should be considered.
We wish you the best of luck and trade safely.
Team Setupsfx 🚀❤️

Gold Trade Set Up Oct 28Gold has is trade well below PDL so im still bearish. I want to see price sweep internal SSL, to then sweep BSL before selling down to external SSL and 4h demand
