GOLD (Xauusd) is going DOWN! great sell tradeAs you can see GOLD - Xauusd is in a clear downtrend. The red lines drawn show a downward channel which indicate that GOLD is now moving to the downside... Secondly, Gold has broken a powerful support level (the upper green line)! It is now very likely to head down to the lower green line (next support level). Great time to sell!
Xauusdupdates

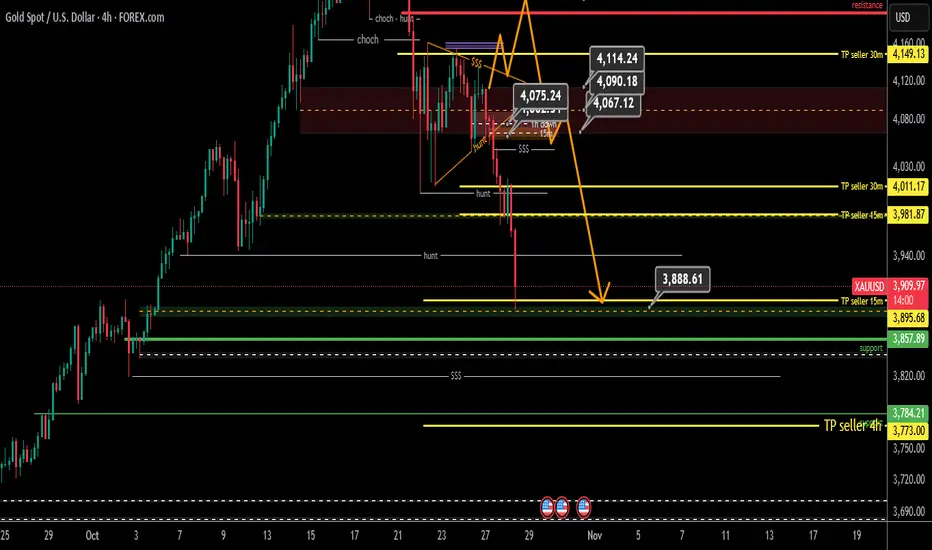
Update Two 4-Hour Gold Analysis
Hello Traders
So far, yesterday's analysis target has been touched, but the seller is still present in the market, and today the 4-hour seller entered the market, and the long-term 4-hour analysis that we had last week gained more strength, the 4-hour sellers target was defined as 3773, which was explained in the relevant post about the entry of sellers. So, every pullback will still have more sellers in the market. For the sell, all the yellow lines of the TPs settled by the candlestick failure act as current resistance and are considered the pullback zone.
Good luck.
Links to the two analyses:
Today's gold trading strategyThe strong dollar trend has taken shape and formed a "suppression loop"
Recently, the US dollar index has surpassed the 107 mark, reaching a new high since November last year, exerting strong pressure on gold prices. This strength is not a short-term fluctuation but the result of the resonance of three factors: The US third-quarter GDP grew at an annual rate of 4.9%, and in October, non-farm payrolls increased by 336,000. The economic resilience exceeded expectations, completely dispelling the market's aggressive expectations for the Fed to cut interest rates; The European Central Bank released dovish signals suggesting a possible early end to interest rate hikes, forming a "scissors gap" with the Fed's policy, driving European capital to flow into US assets; Japan's intervention in the foreign exchange market led to a contraction in US liquidity, further strengthening the scarcity of the US dollar. Historical data shows that the correlation coefficient between the US dollar index and gold prices is -0.87. For every 1% increase in the US dollar, the average gold price drops by 1.2%. Under the current strong trend, the pressure on gold prices is inevitable.
Today's gold trading strategy
sell:3900-3910
tp:3890~3880
sl:3920

Gold price analysis October 28📉 GOLD UPDATE – Correction Phase Continues
Gold remains under bearish pressure as buyers failed to hold the price above 4057, confirming that sellers are back in control. The market structure now supports a continued corrective move toward the 3955 support zone during the European session. A further breakdown below this level could open the way to 3892, which serves as the next key downside target.
For now, the focus should remain on SELL setups during the London session. Any BUY positions would be considered counter-trend and only valid if price shows strong rejection signals at key supports or reclaims the 4057 zone.
🎯 Trading Plan
SELL trigger: Price rejection at resistance zone 4050
SELL DCA: On break below 3955
Target: 3890

ElDoradoFx PREMIUM – GOLD ANALYSIS (28/10/2025, LONDON SESSIONGold extended its bearish continuation during Asia, breaking below 3,940, confirming dominance of sellers. London opens with price sitting near 3,935–3,940, still within the bearish structure that began at 4,106.
Momentum is strongly negative, with EMAs (50/100/200) aligned downward and RSI below 40 across all intraday frames. The market remains inside a descending channel — each recovery is being sold aggressively.
⸻
2️⃣ Technical Breakdown
🔹 Daily (D1)
• Fourth consecutive bearish candle confirms strong downside momentum.
• RSI (46) still neutral but leaning bearish; MACD histogram fully red.
• Price approaching potential higher-timeframe support near 3,900–3,880.
Bias: Bearish correction still in play until 3,880 or D1 reversal candle appears.
🔸 H1
• Structure: clean lower highs (4,106 → 4,048 → 3,997) and lower lows (3,971 → 3,935).
• RSI (27) deeply oversold, signaling possible micro bounce but no reversal yet.
• 100/200 EMA above at 3,990–4,040 acting as strong resistance.
Bias: Bearish below 4,000, corrective pullback likely capped at 3,995–4,010.
🔹 M15
• Extended downtrend channel remains active.
• Every minor pullback rejected under 3,950–3,960.
• MACD shows no bullish divergence yet; sellers still in control.
Bias: Sell pullbacks near resistance levels.
🔹 M5
• Micro CHoCH confirmed lower highs.
• RSI near 30 with weak attempt to rebound.
• Short-term liquidity zone forming 3,930–3,940, potential area for retest before continuation.
Bias: Bearish to neutral; short rallies only if confirmed rejection on M5–M15.
⸻
3️⃣ Fibonacci Analysis (Golden Zone)
Last H1 swing: High 4,106 → Low 3,935
• 🔸 38.2% → 3,990
• 🔸 50% → 4,009
• 🔸 61.8% → 4,028
✅ Golden Zone = 3,990 – 4,028
This zone aligns with the H1 supply area and EMA confluence, making it the optimal retracement level to rejoin the bearish trend.
⸻
4️⃣ High-Probability Trade Scenarios
📉 SELL SCENARIO (High Probability)
• Entry: 3,990 – 4,028 (Golden Zone)
• Stop-Loss: 4,035 – 4,045
• Targets: 3,955 → 3,935 → 3,910 → 3,885
• Confluence: EMA cluster, Fib 61.8%, trendline resistance
• Bias: Strong short continuation if rejection occurs inside Golden Zone
⸻
⚡ BREAKDOWN SELL
• Trigger: Clean H1 candle close below 3,930
• Entry: 3,928 – 3,935 on retest
• Stop-Loss: Above 3,945
• Targets: 3,912 → 3,900 → 3,885
• Bias: Follows continuation of bearish momentum below weak low.
⸻
🟢 COUNTERTREND BUY (Low Probability)
• Trigger: Bullish BOS + strong engulfing candle above 3,960
• Entry: 3,960 – 3,965
• Stop-Loss: 3,940
• Targets: 3,985 → 3,995 → 4,009
• Bias: Only if London forms a liquidity sweep under 3,930 with strong reclaim.
⸻
5️⃣ Fundamental Watch
• No major Asia data; London expected to move with USD Index (DXY) flows.
• DXY above 106 favors continued gold weakness.
• Traders monitoring US GDP & PCE later this week, meaning liquidity could tighten today.
• Expect volatility spikes near London–NY overlap as large players position early.
⸻
6️⃣ Key Technical Levels
Type Price Levels
Resistance 3,960 / 3,975 / 3,990 / 4,009 / 4,028
Support 3,935 / 3,924 / 3,910 / 3,885 / 3,872
Golden Zone 3,990 – 4,028
Breakdown Trigger < 3,930
Bullish Reclaim Trigger > 3,965
⸻
7️⃣ Analyst Summary
The bearish structure remains dominant across all timeframes. Momentum favors continuation toward 3,910–3,885, with the best entry region at 3,990–4,028 Golden Zone.
If London opens with liquidity sweeps below 3,930, wait for a quick retracement to sell at premium pricing.
Only strong reclaim above 3,965 could trigger a short-term intraday recovery to 3,990–4,009 before sellers step in again.
⸻
8️⃣ Final Bias Summary
📉 Primary Bias: Bearish – Sell rallies into 3,990–4,028
📈 Secondary Bias: Bullish only above 3,965 (confirmed reclaim)
🎯 Targets: 3,955 → 3,935 → 3,910 → 3,885
✨ Golden Zone: 3,990 – 4,028
🛑 Invalidation: H1 close above 4,045
⸻
— ElDoradoFx PREMIUM 2.0 Team 🚀
⸻

GOLD (XAU/USD): SHORT SETUP — RIDING THE FINAL BEAR LEG!1. MACRO VIEW: THE FED STALEMATE
The Gold market is being pulled in opposing directions:
Bearish Pull (USD Strength): Positive news on the US-China trade deal reduces safe-haven demand.
Bullish Push (Gold Support): Near-certainty of a 25bps Fed rate cut on Wednesday weakens the USD. Plus, escalating US-Russia geopolitical tension maintains risk appetite for Gold.
Bottom Line: While a weaker USD supports Gold, Technical Analysis suggests a deeper correction must complete first.
2. TECHNICALS: STRUCTURE IS DECIDEDLY BEARISH
Trend Shift: After a strong rally, Gold has broken major support structure, confirming a Bearish Shift in the short-term trend.
Scenario: We anticipate a technical pullback (Pullback) to retest the new resistance level. Once the retest is complete, selling pressure should resume to finish the corrective move.
3. 💡 TRADE STRATEGY (THE SHORT)
We are primarily SELLING (SHORT), positioning for the completion of the corrective cycle:
Ideal Entry Zone (Entry): 3,949.849 (Retesting the broken prior Support, now Resistance)
Take Profit (TP1): 3,929.793
Take Profit (TP2): 3,878.287 – 3,811.333 (Major Demand Zone Target)
Stop Loss (SL): Above 3,949.849 (Above Confirmed Resistance)
⚠️ Warning: Wednesday’s FED rate decision will cause extreme volatility. Risk management is paramount!
Where do you think this final drop will bottom out? Let me know below! 👇
#Gold #XAUUSD #FOMC #TradePlan

Gold Price Outlook – Trade Setup (XAU/USD)📊 Technical Structure
OANDA:XAUUSD Gold (XAU/USD) continues to trade under bearish pressure, dropping to the $3,980–3,940 range, marking its lowest in three weeks. The chart highlights:
Resistance Zone: $3,975 – $3,981 (aligns with a descending trendline).
Support Zone: $3,936 – $3,943, with $3,930 as key downside level.
Price action shows lower highs, suggesting sustained bearish momentum. A corrective bounce into the resistance zone could be met with fresh selling interest.
📌 Trade Setup
Entry: $3,975 – $3,981 (near resistance & trendline)
Stop Loss: $3,986
Take Profit 1: $3,945
Take Profit 2: $3,936
Risk/Reward: ≈ 1 : 3.72
🌍 Macro Background
Gold’s decline is largely driven by renewed US–China trade optimism, which has reduced safe-haven demand. As reported, officials from both sides agreed on a trade deal framework ahead of Trump–Xi talks this week, pressuring gold prices despite weaker USD and dovish Fed expectations. Meanwhile, traders remain cautious ahead of the FOMC meeting (Oct 28–29), where markets have priced in a 96% chance of a 25 bps Fed rate cut.
Adding to the downside pressure, the People’s Bank of China (PBoC) paused gold purchases, while China’s imports fell 17.6% in September, further reducing demand support. However, US Treasury yields remain soft, and JPMorgan projects long-term bullish momentum for gold, forecasting an average $5,055/oz in Q4 2026.
🔑 Key Technical Levels
Resistance: $3,975 / $3,981
Support: $3,943 / $3,936
Breakdown Target: $3,900
📋 Trade Summary
Gold remains under pressure, trading below $4,000 with bearish momentum intact. Short-term rallies toward resistance offer opportunities to sell, targeting the $3,930–3,940 support zone. Market focus shifts to the FOMC decision and US–China talks, which could define gold’s next breakout direction.
⚠️ Disclaimer
This analysis is for reference only and does not constitute trading advice. Trading involves significant risk, and proper risk management is essential.

XAUUSD Crashes 1500 Pips — Key Supports Gone!Gold started the week poorly, dropping around 1500 pips and, more importantly, breaking three key support levels:
• the rising trendline that started back in August,
• the 4020 horizontal support zone,
• and even the psychological 4000 level.
Overnight, the price attempted to reclaim 4000, but failed — currently trading around 3965.
The next immediate support sits at 3945, and even if we see a rebound from here, bulls will need to hold the price firmly above 4000 to have any chance of a reversal.
If this level also fails, the next obvious medium-term target is the 3720–3750 zone.
I m bearish for now, but there isn’t a clean or logical entry point at the current levels — I will wait until a clearer setup forms.

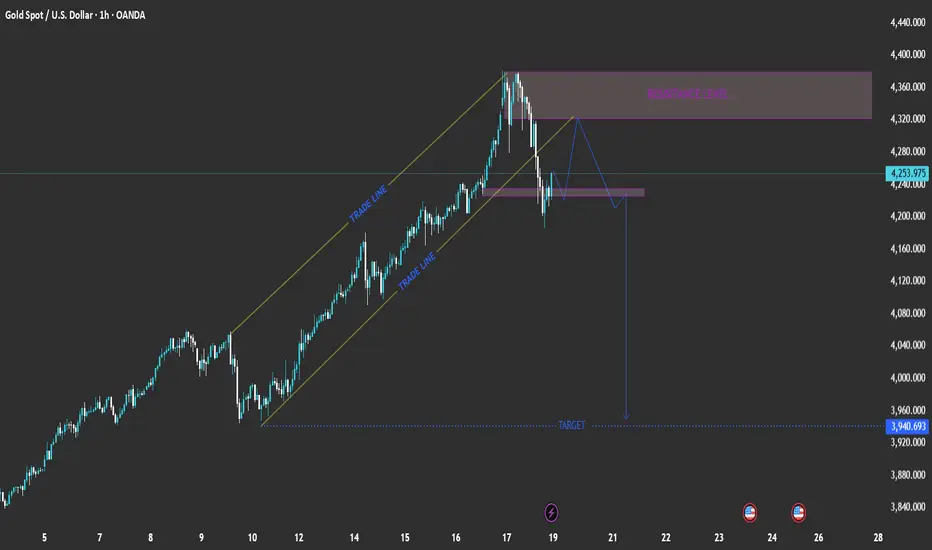
XAU/USD: Channel Breakout → Retest → Downside Target at 3,940EURONEXT:FTI1! EURONEXT:FTI1! EURONEXT:VU8F2026 EURONEXT:VM81! EURONEXT:VV6X2025 EURONEXT:V26X2025 EURONEXT:NS8Z2025 EURONEXT:YG8F2026 Pair: Gold Spot (XAU/USD)
Timeframe: 1-hour
Current Price: 4,253.975
Trend: Recently broke out of an ascending channel (bearish signal)
📉 Chart Breakdown
1. Ascending Channel (Trade Lines)
Price was moving steadily inside a rising channel, indicated by the two parallel yellow “TRADE LINE” levels.
The break below the lower trade line suggests weakening bullish momentum and potential trend reversal.
2. Resistance Level (4,320 – 4,360 zone)
Marked in purple, this zone served as a key resistance.
Price rejected strongly from this area, confirming seller presence.
3. Structure Retest and Potential Move
After the channel break, price retraced back to retest the broken channel support (now resistance).
The projected blue path shows a lower-high formation followed by a new drop, completing a bearish continuation pattern.
4. Target Zone
The projected target is near 3,940.693, aligning with previous structure support.
This level could serve as a profit-taking area for short positions.
📊 Summary of Key Levels
Zone Type Range / Level
4,320 – 4,360 Resistance Strong supply zone
4,220 – 4,240 Retest zone Potential short entry area
3,940 Target Bearish target / demand zone
⚙️ Trading Plan Concept (Hypothetical)
Bias: Bearish
Entry Idea: Wait for rejection from 4,220–4,240 zone.
Stop Loss: Above 4,280 (resistance)
Take Profit: Around 3,940 (target)
Risk/Reward: Approximately 1:3 or better
🧭 Conclusion
The chart suggests that Gold (XAU/USD) might be entering a corrective bearish phase after failing to sustain its bullish channel. A retest of broken structure before another drop aligns with typical market structure behavior.
Gold bulls are powerless to recover rebound continues to bearishThis week, global financial markets are focused on the Federal Reserve's upcoming interest rate decision. Gold prices typically have a negative correlation with real interest rates. Rate cuts typically reduce the opportunity cost of holding gold, thus supporting prices. In the current environment of rising risk appetite, even if the Fed cuts rates as expected, gold's safe-haven appeal may be offset by trade optimism.
Yesterday, gold prices broke through the psychologically important 4,000 level as expected, and we saw significant returns on both short positions. After consolidating below the 4,160 high, gold is poised to break lower, generally in line with expectations. The daily candlestick pattern formed a doji candlestick pattern, followed by a mid-sized bearish candlestick pattern that engulfed the lower level, continuing its downward trend. The daily and weekly corrections are still ongoing. The daily chart finally closed at 3982, with a long black candlestick with a long upper shadow. Today's market continues to short. Gold's resistance level is currently moving downwards. The four-hour chart is entirely filled with long black candlesticks. Any rebound is easily swallowed by these large black candlesticks. These large black candlestick bodies demonstrate the strength of the bears, breaking through all support levels. The only lower support level is around 3950. If this breaks down, bears will target around 3800. Therefore, we will continue to focus on long positions, clearly at yesterday's support point, around 4040.
From a technical analysis perspective, gold is showing clear bearish signals on the one-hour chart. The moving averages are showing a bearish alignment, with the short-term moving averages pushing downward, indicating that short-term bears have the upper hand. Furthermore, the MACD indicator's death cross continues to diverge, and the growing green momentum bar further confirms the downward price trend. During the Asian session, watch for a rebound in gold prices to the 4035-4040 range. A small position can be entered into a short position with a stop-loss above 4050 to protect against losses from a sudden price reversal. Target prices can initially target the 4000 mark, with further downside potential targeting the 3980-3950 range.

ElDoradoFx PREMIUM – GOLD ANALYSIS (28/10/2025, ASIA SESSION)Gold closed the US session around 3,982 after extending its sell-off from 4,048, confirming strong bearish continuation from the 4,38x top. The current structure remains heavy, with the H1 100/200 EMA acting as dynamic resistance and repeated rejections near 3,997–4,002.
Momentum indicators across intraday timeframes still favor sellers, but Asia may open with a brief corrective retracement before the next bearish leg toward 3,958–3,945 liquidity zones.
⸻
2️⃣ Technical Breakdown
🔹 Daily (D1)
• Third consecutive bearish daily candle confirming continuation of the mid-term correction.
• Price now trades around 3,982, testing the mid-range zone between 3,880–4,020.
• RSI slipping near 50, signaling room for more downside before oversold conditions.
• MACD histogram remains negative but moderating — corrective phase within broader uptrend.
🧭 Bias: Bearish continuation inside medium-term correction; key support 3,880.
⸻
🔸 1H Chart (H1)
• Structure: Clear lower highs from 4,12x → 4,072 → 4,048 → 3,997.
• Strong break of structure below 3,985 → 3,971 confirms downtrend intact.
• Price remains below all EMAs and the descending trendline.
• RSI ~37 (slightly oversold); MACD momentum still negative.
📉 Intraday Bias: Bearish below 4,021; corrective only if price reclaims that level.
⸻
🔹 15M Chart (M15)
• Descending channel clearly defined; price rejected twice near 3,997–4,002.
• Pullbacks shallow, suggesting weak buyer interest.
• MACD histogram fading after short correction — selling pressure resuming.
⚠️ Short-term Bias: Sell rallies until clean BOS above 4,021.
⸻
🔹 5M Chart (M5)
• Micro downtrend confirmed with CHoCH back to the downside at 3,996.
• Price consolidating near 3,982, forming minor liquidity base pre-Asia open.
• RSI ~36; momentum weak but potential short-term rebound toward 4,000 before next drop.
🔎 Micro Bias: Intraday pullback expected; structure favors new lower high formation near 4,009–4,021.
⸻
3️⃣ Fibonacci Analysis – Golden Zone
Last H1 swing: High 4,048 → Low 3,971
• 38.2% → 3,998
• 50% → 4,009
• 61.8% → 4,021 ✅
✨ Golden Zone = 4,009 – 4,021
This zone aligns with the descending trendline, the H1 EMA cluster, and prior supply rejection — making it the highest-probability short area for continuation.
⸻
4️⃣ High-Probability Trade Scenarios
🟢 Bearish Continuation Setup (Preferred Scenario)
✅ Sell Zone: 4,009 – 4,021 (Golden Zone)
🎯 Targets: 3,985 → 3,971 → 3,958 → 3,945
🛑 Stop-Loss: Above 4,028–4,032
📈 Reasoning: Structural alignment with EMAs, Fib confluence, and trendline resistance.
⸻
⚡ Momentum Breakdown Setup (Continuation Trade)
✅ Sell Trigger: Break & retest below 3,971
🎯 Targets: 3,958 → 3,945 → 3,930 → 3,920
🛑 Stop-Loss: Back above 3,985
📈 Reasoning: Structural breakdown confirmation and liquidity grab continuation.
⸻
⚪ Countertrend Buy Setup (Low Probability)
✅ Buy Trigger: Clean 15M BOS + retest above 4,021
🎯 Targets: 4,034 → 4,048 → 4,072
🛑 Stop-Loss: Below 4,009
📈 Reasoning: Short-term recovery if DXY weakens or liquidity imbalance above 4,02x forms.
⸻
5️⃣ Fundamental Watch
• Asia session quiet: no tier-1 data expected.
• Focus remains on USD index drift and post-US yield sentiment.
• If DXY holds firm above 106, gold downside pressure persists.
• Watch early Shanghai open flows — potential liquidity sweep near 3,971 before NY continuation.
⸻
6️⃣ Key Technical Levels
Type Levels
Resistance 3,997 / 4,009 / 4,021 / 4,034 / 4,048
Support 3,985 / 3,971 / 3,958 / 3,945 / 3,930
Golden Zone 4,009 – 4,021
Break Sell Trigger < 3,971
Break Buy Trigger > 4,021
⸻
7️⃣ Analyst Summary
The market remains structurally bearish across all intraday frames, with strong EMA alignment and trendline rejection confirming continuation bias. Asia session likely sees a corrective bounce into the 4,009–4,021 Golden Zone, where the best-quality short setups align.
Only if buyers reclaim and hold above 4,021 will momentum shift for a potential relief rally toward 4,048/4,072. Otherwise, expect renewed pressure targeting 3,971 → 3,958 → 3,945.
⸻
8️⃣ Final Bias Summary
📉 Primary Bias: Bearish → Sell rallies into 4,009–4,021
📈 Secondary Bias: Bullish only above 4,021 (retested hold)
🎯 Targets: 3,985 → 3,971 → 3,958
✨ Golden Zone: 4,009 – 4,021
🛑 Invalidation: H1 close above 4,032
⸻
🥇 ElDoradoFx PREMIUM 2.0 – PERFORMANCE 27/10/2025 🥇
📅 Smart setups. Steady profits.
━━━━━━━━━━━━━━━
🔻 SELL +220 PIPS
🟢 BUY +145 PIPS
❌ BUY -60 PIPS (SL)
🔻 SELL +210 PIPS
━━━━━━━━━━━━━━━
💰 GOLD TOTAL PIPS WON: +515 PIPS
📊 4 Trades → 3 Wins | 1 SL
🎯 Accuracy: 75%
━━━━━━━━━━━━━━━
🔥 Solid and precise session — trend moves respected technical zones perfectly.
👏 Congratulations if you profited! ✅✅✅🚀🚀🚀

XAU/USD DOUBLE TOP FORMATION BEARISH MOVE TARGETTING SUPPORT🧩 Key Observations:
1. Double Top Formation
Two clear peaks around 4160–4180 zone (marked circles).
This confirms strong resistance and a potential reversal zone.
2. Trendline Resistance
A descending trendline from previous highs keeps price suppressed.
Every retest of this line has led to rejection — confirming bearish control.
3. Bearish Structure
Lower highs and lower lows clearly visible → consistent with downtrend.
Recent pullback appears corrective before another potential drop.
4. Projected Move (Arrow Path)
The arrow suggests a short-term retracement to ~4120–4150 zone (trendline + resistance confluence).
Then, a continuation down toward the target zone near 3968–3980.
5. Support & Target Levels
Immediate Support: 4040–4050
Main Target: 3968–3980 (shown on chart)
Major Resistance: 4160–4180

GOLD (XAUUSD) — Market Sitting Below 3,980… What’s Next?Gold finally filled the Daily Fair Value Gaps below and we’re now sitting around 3,976 after a heavy pullback. Trend is still bullish overall, this looks like a normal correction after that vertical move up.
I’m watching the current Daily FVG support between 3,950 – 3,980.
If buyers defend this area → I’m looking for long entries.
Buy Plan (Only if we see bullish reaction):
• Entry zone: 3950 – 3980
• TP1: 4050 (small bounce liquidity)
• TP2: 4150 (upper FVG)
• TP3: 4250 if momentum is strong
• SL: below 3930 (clean invalidation)
Bearish invalidation:
If 3,930 breaks and closes below FVG → gold likely continues down to 3,880 next demand area .

Weak market rebound can short goldGold prices encountered resistance near 4,084 and began to pull back. The short position we entered in the morning has now been closed for profit around 4,044. Currently, gold has broken below the triangular consolidation zone, which aligns with our expectations. Based on the current technical structure and market sentiment, we do not plan to enter any long positions for the time being.
The key support below gold prices now is the market’s psychological level of 4,000. Judging from the current market conditions, unless a major risk event occurs unexpectedly, a break below 4,000 is only a matter of time. After the Asian session’s rally followed by a pullback, and the European session’s break below today’s low, we can continue to enter short positions if there is a rebound during the U.S. session.

GOLD aka XAUUSD is heading to the downside!!Last week XAUUSD (Gold) had a very bearish week! It ended its bullish streak of years and declined to the downside. It only recently broke a very strong support zone (the green trendline) and struggled to break above the resistance zone (red trendline). It should drop all the way down further all the way to the 3833 level.

Plan XAU 27-oct 2025 Related Information:!!!
The top economic officials of China and the United States agreed on Sunday on the framework of a potential trade deal that will be discussed when U.S. President Donald Trump and Chinese President Xi Jinping meet later this week. U.S. Treasury Secretary Scott Bessent said that discussions on the sidelines of the ASEAN Summit in Kuala Lumpur had removed the threat of a 100% tariff on imports from China that was set to take effect on November 1.
personal opinion:!!!
Gold prices are moving sideways in the $4000–$4100 range.
Important price zone to consider : !!!
Resistance zone point: 4000 zone

Gold Trade Set Up Oct 27 2025Gold has broke structure to the downside once again on the 1h so i am expecting a continuation back down but first i want to see a sweep of EQH and tap into 1h FVG before looking for internal 5m structure to sell down to SSL

Today's gold trading strategyThe contradiction between supply and demand has set the price floor.
The gold market is currently facing a dual situation of "tight supply and strong demand". On the supply side, the global underground reserves of gold are only 20%, and the output of mined gold in 2025 can only maintain a slow growth of 3,000 tons. Moreover, new mines need 5-7 years to come into production, and there is simply no possibility of a significant increase in supply in the short term. The marginal production cost has risen to $1,500 per ounce, providing a strong support for the gold price. On the demand side, not only are global central banks buying gold in a frenzy, but the gold purchase volume is expected to exceed 10,000 tons in 2025. The private investment demand in Asian markets such as China and India is also surging. In 2024, the consumption of gold bars and coins in China increased by 46.02%. This supply-demand gap is difficult to fill in the short term and will inevitably push the gold price to rise.
Today's gold trading strategy
xauusd @ buy4050-4060
TP:4080-4100-4150
SL:4030

XAU/USD – Downtrend Holds as Gold Tests the Lower Channel🔍 Market Context
Gold remains under pressure after failing to reclaim the 4,060 breakout zone.
Recent attempts to recover have been absorbed by sellers, confirming short-term weakness and the continuation of the downward structure.
The market appears to be in a redistribution phase, as traders await clarity from upcoming macro data.
📊 Technical Analysis
Structure: Clear bearish channel with lower highs forming below the broken trendline.
Key resistance: 4,058–4,060 (previous breakout support now acting as supply).
Support zones:
• 4,004–4,000 → short-term liquidity area.
• 3,928–3,930 → deeper liquidity pocket + Fibo reaction zone.
Bias: Downtrend remains intact unless price reclaims and holds above 4,070–4,080.
🎯 Short-Term Outlook
If gold continues to reject from the 4,050–4,060 area,
a further move toward 4,000 and possibly 3,928 is likely.
Conversely, a clean reclaim above 4,080 could invalidate the current bearish pressure and trigger a short-term recovery.
⚜️ Summary
Gold is not collapsing — it’s resetting structure after an extended rally.
The focus remains on how liquidity behaves near 4,000.
If that zone breaks, expect momentum to accelerate toward 3,928 before buyers step back in.
📌 MMFLOW TRADING Insight:
“Follow the structure, not the emotion — liquidity always tells the truth.”

Gold Rebound SetupGold (XAU/USD) is testing the support trend line around 4030. If it holds, price may rebound toward resistance levels at 4160 and 4236, with a potential target near 4370. A break below the trend line could indicate further downside pressure.

GOLD (XAU/USD): THE FED & THE FINAL DIP – GET READY TO SHORT!1. MACRO OVERVIEW SUMMARY
Headwinds (Short-term): The agreed-upon US-China trade framework reduces tariff fears, putting near-term selling pressure on Gold.
Tailwinds (Mid-term): Weak CPI data (3% inflation) solidifies expectations for Fed rate cuts (weakening the USD) + Escalating Russia-Ukraine Tensions.
The Decisive Event: The FOMC decision on Wednesday will serve as the ultimate compass for Gold's next major move.
2. TECHNICAL ANALYSIS: STRUCTURE & TARGETS
Current Structure: Following the strong bullish impulse, Gold is in a major corrective phase. The recent price structure was broken, confirming that the short-term trend has shifted to bearish.
Anticipated Scenario: Gold has likely completed its retracement and is expected to execute the final drop to conclude the correction process before a potential reversal.
The Magnet (Target): The critical Value Gap on the daily timeframe (around $3,880 – $3,920) is the ultimate destination this final move is likely heading for.
WAITING FOR ENTRY: Gold is anticipated to rally slightly to retest the recently broken structure area before continuing its descent.
3. TRADING STRATEGY (BEARISH BIAS)
We favor a SHORT position, aligning with the final corrective down-move:
Ideal Entry Zone: $4,080 – $4,100 (Retest of the broken structure).
Take Profit (TP1): $3,970 (Nearest Demand/Support Zone).
Take Profit (TP2): $3,880 (Final Target at the major Daily Value Gap).
Stop Loss (SL): $4,135 (Above the key Supply Zone).
Crucial Note: Maintain strict risk management ahead of Wednesday's FOMC. This short move could finalize the major correction!
Where do you think this final drop will end? Comment below!
#Gold #XAUUSD #FOMC #Trading #TradePlan

XAU/USD 27 October 2025 Intraday AnalysisH4 Analysis:
-> Swing: Bullish.
-> Internal: Bullish.
Analysis and bias remains the same as analysis dated 20 October 2025.
Price has printed as per previous intraday expectation by printing a bearish CHoCH which indicates, but not confirms, bullish pullback phase initiation.
Price is currently trading within an established internal range, however, I will continue to monitor price with regards to depth of pullback.
Intraday expectation:
Price to continue bearish, react at either discount of 50% internal EQ, or H4 supply zone before targeting weak internal high priced at 4,380. 990.
Note:
The Federal Reserve’s sustained dovish stance, coupled with ongoing geopolitical uncertainties, is likely to prolong heightened volatility in the gold market. Given this elevated risk environment, traders should exercise caution and recalibrate risk management strategies to navigate potential price fluctuations effectively.
Additionally, gold pricing remains sensitive to broader macroeconomic developments, including policy decisions under President Trump. Shifts in geopolitical strategy and economic directives could further amplify uncertainty, contributing to market repricing dynamics.
H4 Chart:
M15 Analysis:
-> Swing: Bullish.
-> Internal: Bearish.
Analysis and bias remains the same as yesterday's analysis dated 22 October 2025.
Price has printed according to my analysis dated 20 October 2025 where I mention that price is to continue bullish, react at either premium of 50% internal EQ, or M15 demand zone, before targeting weak internal low priced at 4,185.910.
Price has printed a bearish iBOS and subsequently a bullish CHoCH to indicate, but not confirm bullish pullback phase initiation.
Price is now trading within an established internal range.
Intraday expectation:
Price to react at either premium of 50% internal EQ, or M15 demand zone, before targeting weak internal low priced at 4,004.280.
Note:
Gold remains highly volatile amid the Federal Reserve's continued dovish stance, persistent and escalating geopolitical uncertainties. Traders should implement robust risk management strategies and remain vigilant, as price swings may become more pronounced in this elevated volatility environment.
Additionally, President Trump’s tariff announcements, particularly against China, are expected to further amplify market turbulence, potentially triggering sharp price fluctuations and whipsaws.
M15 Chart:

GOLD HIGH PROBABILITY SETUPS SOON!!!🚨 XAUUSD HIGH PROBABILITY BUY SETUP 🚨
* Here We Can See Clearly The Next Potential Moves For GOLD Coming Hours/Days.
* Keep Your Eyes Close On Your Trading Positions.
* Happy PIP Hunting Traders.
FXKILLA.
