XAUUSD – Gold Trapped in Uncertainty Before the FOMC Market Overview:
Gold remains range-bound as US–China trade optimism tempers safe-haven demand, while expectations for further Fed rate cuts continue to weigh on the USD and cushion downside pressure.
The market is hesitant ahead of the two-day FOMC meeting this week, as traders await clear policy guidance before taking larger directional bets.
In short — macro tone is mixed:
Trade headlines reduce fear.
Fed expectations support gold.
Yet the chart shows indecision — a compression phase before expansion.
Technical Outlook (H1)
On the chart, gold continues to oscillate inside a tightening triangle, holding above the 4,050–4,060 Support Trendline (OBS BUY ZONE).
The liquidity structure shows buy-side absorption near the lows, while sellers remain active around the 4,186–4,260 resistance zones.
If gold maintains stability above 4,050, buyers may attempt to push toward the 4,107 neckline, and possibly test 4,186, before meeting the next supply layer at 4,260.
Conversely, a failure to hold support could expose the 4,002 and 3,930 liquidity pools below.
Key Technical Zones:
Support Trendline / OBS BUY ZONE: 4,058 – 4,050
Neckline / Local Resistance: 4,107 – 4,110
Reaction Zone (Fibo / Supply): 4,186 – 4,260
Deeper Liquidity Zone: 4,002 – 3,930
MMFLOW View – Plan for the Session
At this stage, the market is in accumulation mode.
As long as price stays above 4,050, MMFLOW maintains a neutral-to-bullish bias, focusing on how price reacts near the neckline at 4,107.
The ideal scenario would be:
A short-term pullback to absorb liquidity near 4,050,
Followed by a push toward 4,186,
Then a possible correction before the FOMC outcome.
However, if sellers manage to reclaim 4,050, a drop into 4,002 or even 3,930 could mark the next deep liquidity grab — setting up the base for a larger rally later.
Summary:
Gold remains stuck between macro hesitation and structural compression.
Liquidity is building on both sides — and the breakout direction will likely align with post-FOMC volatility.
🟡 Bias: Neutral-to-Bullish above 4,050.
Watch how the market defends 4,058 and reacts at 4,107–4,186.
📊 What’s your take — will FOMC give gold a reason to break free, or keep it trapped another week?
👉 Follow MMFLOW TRADING for daily structure breakdowns & institutional flow insights.
🟣 Chart: XAUUSD H1 – Smart Money Flow structure showing liquidity sweep, compression triangle, and Fibo confluence zones before the FOMC decision.
Xauusdupdates

Plan |Gold Gradually Accumulating, Preparing for an Upward Wave?🔍 Market Context
After reaching the historical peak ATH GOLD 4,371 USD , gold underwent a deep correction, breaking the short-term bullish structure (BoS) and retesting the OB Bearish zone above .
However, since the price returned to the 4,040 – 4,060 USD area, the market has shown clear signs of liquidity absorption ($$$) and maintained an internal upward trendline, indicating that buying momentum is returning.
The current structure suggests gold is in a re-accumulation phase before forming a medium-term recovery wave towards the 4,185 → 4,243 USD zone.
Buyers hold the advantage as long as the price does not break the main support trendline.
💎 Key Technical Structure
Support Zone: 4,040 – 4,060 USD → a strong support zone confluencing with the trendline, where institutional buying previously appeared.
Support Trendline: connecting the series of higher lows from 15/10 → short-term trend remains bullish.
Liquidity Zone $$$: 4,060 – 4,080 → supply absorption zone, confirming its role as a “price base”.
Resistance Zone: 4,149 – 4,185 → the first resistance zone to break to confirm the recovery momentum.
Target FVG / Supply Zone: 4,243 – 4,250 → potential profit-taking area or reversal consideration point.
Current structure:
→ Short-term: bullish corrective move.
→ Medium-term: potential for forming an extended recovery wave if holding above 4,040 USD.
📈 Trading Scenarios
1️⃣ BUY Setup – Retest Trendline / Liquidity Zone 4,060 USD
Entry: 4,060 – 4,070
SL: 4,035
TP1: 4,149
TP2: 4,185
TP3: 4,243
✅ Condition:
Price hits the trendline or liquidity zone 4,060 and shows a bullish reversal signal (rejection / bullish engulfing).
➡️ This is a high-probability setup, confluencing trendline structure + liquidity zone support, often where large buyers re-enter the market.
2️⃣ BUY Setup – Break & Retest resistance zone 4,149 USD
Entry: 4,149 – 4,155
SL: 4,130
TP1: 4,185
TP2: 4,243
✅ Condition:
Wait for the price to break the 4,149 resistance zone with strong volume, then lightly retest without closing below 4,130.
➡️ Trend-following setup – confirms the return of buying momentum and extends the target to the FVG zone 4,243 USD.
3️⃣ SELL Setup (Scalp reaction) – FVG 4,243 USD
Entry: 4,240 – 4,245
SL: 4,255
TP: 4,185 → 4,150
✅ Condition:
Only execute if there is a strong reaction at FVG 4,243 without a continuation break signal.
➡️ Short-term technical sell – leveraging the supply zone reaction, not holding the position long.
⚠️ Risk Management
Prioritize trading in the buy direction, avoid selling against the main trend.
If H2 closes below 4,035 → bullish scenario invalidated, wait for a new structure.
Do not FOMO buy in the mid-range (4,090–4,130).
Keep moderate volume, move SL to breakeven when price surpasses 4,149.
💬 Conclusion
Gold is in a gradually ascending accumulation phase after a strong decline.
As long as the price holds the trendline and support zone 4,040 – 4,060 USD, gold is likely to rebound following the liquidity + breakout retest model, with the main target being 4,185 → 4,243 USD .
If it breaks through 4,243 USD, the market could trigger a stronger rally towards 4,300 – 4,340 USD .
👉 Reasonable Strategy:
Buy 4,060–4,070 → TP 4,185 / 4,243 USD
Add Buy when breaking 4,149 USD with volume confirmation.
Technical Sell 4,243 USD if there is no signal to break higher.
🔥 “As long as 4,040 holds, gold remains in accumulation — patience will pay.”
⏰ Timeframe: 2H
📅 Update: 27/10/2025
✍️ Analysis by: Captain Vincent

Gold Price Outlook – Trade Setup (XAU/USD)📊 Technical Structure
OANDA:XAUUSD Gold (XAU/USD) is consolidating within a symmetrical triangle formation. The resistance zone lies between $4,104 – $4,113, while the support zone is marked at $4,050 – $4,055. The price has repeatedly tested both zones, suggesting market indecision. A breakout from this tightening structure could dictate the next directional move.
📌 Trade Setup
Entry: $4,061 (near trendline support)
Stop Loss: $4,050 (below support zone)
Take Profit: $4,113 (resistance)
Risk–Reward (R:R): ≈ 1 : 4.36
🌍 Macro Background
Renewed optimism surrounding US-China trade talks has reduced safe-haven demand, leading to gold’s decline near $4,065 earlier today. US Treasury Secretary Bessent confirmed that both sides reached a framework for discussion, with China expected to delay its rare earth policy by one year. At the same time, markets are nearly certain the Federal Reserve will deliver a 25 bps rate cut at the October FOMC meeting, with another cut possible in December. While trade optimism weighs on gold, rate-cut expectations continue to provide a safety net for the metal.
🔑 Key Technical Levels
Resistance: $4,104 / $4,113
Support: $4,055 / $4,061
Upside Target (if breakout): $4,130 – $4,150
📋 Trade Summary
Gold is trapped in a tightening triangle between $4,055 and $4,113. Traders may look for long entries on dips near $4,061 with targets at $4,113, aligning with Fed rate-cut expectations. However, renewed US-China optimism caps the upside. A decisive break below $4,050 would invalidate the bullish outlook and open the door toward $4,020.
⚠️ Disclaimer
This analysis is for reference only and does not constitute trading advice. Trading involves significant risk, and proper risk management is essential.

Today's gold trading strategyExpectation of policy easing "stable with growth": Despite the presence of hawkish voices within the Federal Reserve, core officials have expressed clear signals of easing measures - the President of the St. Louis Federal Reserve, Musalem, explicitly stated that if there are further risks in the labor market, he might support another rate cut. More importantly, the probability of a rate cut at the October 28-29 interest rate meeting remains above 90% in the market. This policy expectation provides a solid support for gold. As an interest rate-sensitive asset, gold's attractiveness will continue to rise in an environment where the easing expectation is clear.
Today's gold trading strategy
xauusd @buy4060-4080
TP:4110-4130-4200
SL:4040

XAU/USD: Wave 5 is already starting or the bulls' last hope?XAU/USD: Wave 5 is already starting or the bulls' last hope?
📈 Weekly Scenarios
Bullish scenario: Price holds above ~$4,056-4,000, breaks through ~$4,267 → start of waves (5) up → target ~$4,380-4,455+.
Consolidation: Price moves between ~$4,000 and ~$4,267, forming a base before the next major move.
Bearish scenario: Break of support at ~$4,000 with volume confirmation → start of correction → target ~$3,820-3,943.
✅ Conclusion
On the weekly timeframe, gold is at a key milestone: either a strong profitable rally (wave 5) begins, or a correction reverses.
Main signals: holding above ~$4,000 and breaking through ~$4,267 is the way to the upside; a break below ~$4,000 is a signal for caution.

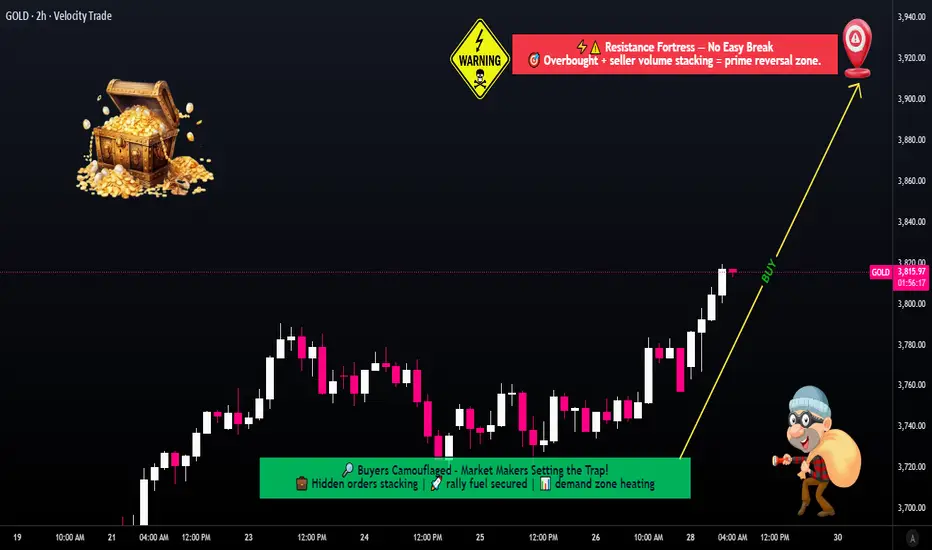
XAU/USD | Day Trade Bullish Map – Can Gold Reach 3800 This Week?🏆 XAU/USD | Metal Market Wealth Strategy Map (Day Trade) 🥇
🎯 Plan: Bullish Wealth Heist
The thief’s map is drawn — and today, the gold vault is our target.
🔑 Strategy Style (Thief Layering Method):
Instead of a single-entry, this plan uses layered limit orders (multiple entry levels). Think of it as planting “buy traps” across the chart to secure the best loot.
📥 Entry Layers (Buy Limits):
3660 💰
3670 💰
3680 💰
3690 💰
3700 💰
(⚡ Add more layers if your style allows — the thief never comes with just one key!)
🛑 Stop Loss (Escape Door):
SL @ 3630 (⚠️ Reminder: This is MY thief escape hatch. You’re free to place your own exit plan depending on risk appetite.)
🎯 Target (Loot Point):
TP @ 3800 (near strong resistance, overbought zone & police patrol 🚨)
— Remember: take profits where you feel safe. The thief escapes when the bag is full!
📊 Thief’s Key Notes
This is a layering strategy, designed for dynamic entries & better position cost-averaging.
XAU/USD often reacts strongly around resistance bands — watch for liquidity hunts before the move.
Don’t marry the trade — grab profit, exit quick, and live to raid another day.
🔗 Related Pairs to Watch (Correlation Check)
OANDA:XAGUSD (Silver): Moves in sync with Gold, but can be more volatile.
TVC:DXY (US Dollar Index): Inverse correlation — if USD weakens, gold often rallies.
FX:EURUSD : Another inverse play against USD, gold strength may reflect here.
SP:SPX / PEPPERSTONE:NAS100 : Risk sentiment cousins — equity weakness often boosts gold.
✨ “If you find value in my analysis, a 👍 and 🚀 boost is much appreciated — it helps me share more setups with the community!”
⚠️ Disclaimer: This is a Thief Style Strategy, shared for educational & fun purposes only. Not financial advice — trade at your own risk.
#XAUUSD #Gold #Forex #DayTrading #TradingStrategy #ThiefTrader #FXCorrelation #Metals #Scalping #TradingView

XAU/USD Metals Outlook: Bullish Path with Layered Buy Entry Plan🔥 XAU/USD: Thief’s Gold Heist Strategy Map (Swing/Day Trade) 💰
🎯 Asset: XAU/USD (Gold vs. U.S. Dollar) — The Shiny Metal’s Wealth Hunt!📈
Market: Metals Market
🏆 Strategy Vibe: Bullish Bandit Plan with a Thief-Style Layering Twist! 😎
🕵️♂️ The Thief’s Bullish Plan: Steal the Gold!
We’re diving into the XAU/USD market with a bullish swing/day trade setup using a slick Thief Layering Strategy. This involves stacking multiple buy limit orders to catch the price at key levels. No boring single entries here — we’re building a multi-layered trap to snag those pips! 🪤
📊 Key Setup Details
🎯 Entry Levels:
Deploy the Thief Layering Strategy with multiple buy limit orders at:
💰 3760
💰 3780
💰 3800
Pro Tip: Feel free to add more layers based on your risk appetite! Stack those limits like a master thief planning a heist. 😏
🛑 Stop Loss:
Thief’s SL set at 3720.
Note: Dear Ladies & Gentlemen (Thief OG’s), this SL is my take — you’re the boss of your trades! Set your stop loss based on your risk tolerance. Trade smart, steal smarter! 💡
🎉 Take Profit Target:
Aim for the Electric Shop High Voltage Trap at 3920. This zone screams strong resistance, overbought signals, and a potential trap for the unprepared. Escape with your profits before the market zaps you! ⚡️
Note: Thief OG’s, this TP is my suggestion. Grab your profits at your own pace and risk level — make it rain when you’re ready! 💸
🔗 Related Pairs to Watch (Dollar-Based Correlations)
Keep an eye on these USD-based pairs for market synergy and correlation:
FX:USDJPY : A stronger USD could pressure gold prices, so watch for inverse moves. If USD/JPY spikes, XAU/USD might dip. 📉
OANDA:USDCHF : Another safe-haven pair. If CHF strengthens, it could signal risk-off vibes impacting gold. 👀
TVC:DXY (U.S. Dollar Index): Gold often moves inversely to the dollar. A rising DXY could cap XAU/USD’s upside — stay sharp! 🧠
OANDA:XAGUSD (Silver): Gold’s shiny cousin often follows XAU/USD’s lead. Check for confirmation in silver’s price action. ✨
Why Watch These? Correlations help you spot market sentiment. If USD strengthens across pairs, gold’s bullish run might face resistance. Use these as your Thief’s Radar to time your entries! 🕵️♀️
🔑 Key Points of the Thief Strategy
Layering Entries: Multiple buy limits spread risk and increase chances of catching a favorable entry. Think of it as setting multiple traps for the price! 🪤
Risk Management: The suggested SL at 3720 keeps losses tight, but adjust based on your account size and risk tolerance.
Resistance Watch: The 3920 zone is a high-voltage trap with overbought signals. Secure profits early to avoid getting caught in a reversal. ⚡️
Market Context: Gold thrives in uncertainty, so keep an eye on global events, Fed news, or inflation data that could spark volatility. 📡
⚠️ Disclaimer
This is a Thief-Style Trading Strategy crafted for fun and educational purposes. Trading involves risks, and past performance doesn’t guarantee future results. Always conduct your own analysis and trade at your own risk. Stay sneaky, stay safe! 😎
✨ If you find value in my analysis, a 👍 and 🚀 boost is much appreciated — it helps me share more setups with the community!
#️⃣ #XAUUSD #GoldTrading #ThiefStrategy #SwingTrading #DayTrading #BullishSetup #ForexTrading #TradingView
XAU/USD Technical Setup ‖ Bullish Momentum or Smart Trap?🏆 XAU/USD: The Golden Heist Blueprint | Swing & Scalp Strategy 💰
📊 Market Overview
Asset: XAU/USD (Gold vs U.S. Dollar)
Market: Precious Metals
Strategy Type: Dual Setup - Swing Trading (Bullish) & Day Trading/Scalping (Bearish)
Risk Level: High Volatility Zone ⚠️
🎯 The Master Plan
🚀 Bullish Scenario: "To The Moon" Setup
Breakout Level: $4,400.00
Action: Direct long entry on confirmed breakout above resistance
Logic: Clean break = institutional momentum shift
🔻 Bearish Scenario: Scalping/Day Trade Setup
Breakdown Level: $4,050.00
Action: Short positions on confirmed break below support
⚠️ Trap Alert: Any pullback above $4,050.00 post-breakdown = potential smart money trap. Watch for false breakouts!
🛡️ Risk Management Zone
Stop Loss (Pullback Buy Plan): $3,950.00
⚠️ Disclaimer: This SL is based on my analysis for the bullish pullback scenario. You're the captain of your own ship! Adjust stops according to your risk tolerance, account size, and trading style. Never risk more than you can afford to lose.
🎖️ Profit Targets
Buy Side Target: $4,600.00
Exit Strategy Notes:
Strong resistance confluence at this level
Overbought conditions likely
Potential trap zone for late entries
Recommendation: Scale out profits gradually rather than waiting for the full target
Sell Side Target: $4,050.00
Exit Strategy Notes:
Major support level - expect bounces
High probability of liquidity grab at this zone
Consider partial profit taking before reaching full target
Recommendation: Trail stops as price moves in your favor
⚠️ Disclaimer: These targets are MY analysis, not financial advice. Take profits when YOUR strategy signals, not mine. Trail stops, scale out, or exit based on YOUR plan. Your money, your rules! 💪
🔗 Related Markets to Watch
Correlated Assets:
DXY (U.S. Dollar Index): Inverse correlation - Dollar strength = Gold weakness
GC (Gold Futures): Direct correlation - Institutional positioning indicator
XAUEUR (Gold vs Euro): Alternative safe-haven flow gauge
US10Y (10-Year Treasury Yield): Inverse correlation - Rising yields pressure Gold
BTCUSD (Bitcoin): Risk-on/risk-off sentiment indicator
Key Fundamental Drivers:
Fed monetary policy & interest rate decisions
Inflation data (CPI/PCE reports)
Geopolitical tensions (safe-haven demand)
Real yields & opportunity cost
🔑 Key Technical Points
✅ Breakout Confirmation: Wait for candle close above/below key levels
✅ Volume Analysis: High volume breakouts = higher probability
✅ Smart Money Traps: Watch for failed breakouts and liquidity grabs
✅ Risk-Reward Ratio: Calculate before entry - minimum 1:2 recommended
✅ Market Structure: Respect higher timeframe trends
🎭 Trading Psychology Reminder
This strategy has a playful "heist" theme for entertainment, but make no mistake — treat your capital with serious respect. The market doesn't care about our plans. Adapt, manage risk, and preserve capital above all else.
Remember:
No setup is guaranteed
Always use stop losses
Never risk your rent money
Emotions are the enemy
The market pays patient traders
✨ If you find value in my analysis, a 👍 and 🚀 boost is much appreciated — it helps me share more setups with the community!
#XAUUSD #Gold #GoldTrading #ForexTrading #SwingTrading #DayTrading #Scalping #TechnicalAnalysis #PreciousMetals #TradingStrategy #RiskManagement #Forex #GoldAnalysis #TradingIdeas #MarketAnalysis #PriceAction #Breakout #SupportAndResistance #TradingView #ForexSignals
Happy trading, and may the pips be ever in your favor! 🎯💎

XAUUSD: Structure Broken! Can the Fed Rate Cut Save Gold?Gold has just completed its first losing week in 10, after a historic rally. Following the record peak of $4,381.21, Gold experienced a sharp correction driven by profit-taking and easing US-China trade tensions. However, weaker-than-expected US CPI data has strongly reinforced expectations for an upcoming Fed rate cut, creating a significant market conflict.
I. MARKET CONTEXT ANALYSIS (H4)
Structure: The prior bullish structure has been broken, shifting the bias to bearish in the short term.
Liquidity: Market forces are now targeting key stop-loss zones to collect liquidity before the next major move.
Strategy: We look to Sell when price pulls back to the Supply Zone (Premium) and Buy when price sweeps liquidity into the strong Demand Zone.
II. DETAILED TRADING PLAN
1. SELL Scenario 📉 (At Supply Zones)
Trade 1:
Entry: $4,202 - $4,204
SL: $4,212
TP: $4,194 / $4,184 / $4,174 / $4,164
Trade 2:
Entry: $4,252 - $4,256
SL: $4,272
TP: $4,236 / $4,216 / $4,196 / $4,176
2. BUY Scenario 📈 (At Demand Zones)
Trade 1:
Entry: $4,158 - $4,161
SL: $4,151
TP: $4,168 / $4,178 / $4,188 / $4,198
Trade 2 (Critical):
Entry: $3,966 - $3,969 (Strong Demand Zone, post-liquidity sweep)
SL: $3,949
TP: $3,989 / $4,009 / $4,029 / $4,049
III. RISK MANAGEMENT NOTE
Capital: Always limit risk to ≤ 1% of capital per trade.
Confirmation: Prioritize waiting for reversal confirmation on lower timeframes (M15/M5) to optimize Risk/Reward ratio.
This is the decisive moment! Trade safe and good luck!
#XAUUSD #Gold #GoldAnalysis #Forex #Trading #Fed #Inflation

Review of Gold's Performance This Week📝This week, the gold market experienced severe volatility, showing an overall trend of a sharp decline followed by a volatile rebound. The details are as follows:
📈Price Movement:
On Monday, gold prices fluctuated between 4,218.32 and 4,354.88.
On Tuesday, gold plummeted by 6.3% at one point, marking the largest single-day drop since April 2013.
On Wednesday, it continued to fall, hitting a low of 4,003.43.
On Thursday, gold fluctuated within the range of 4,065.47 to 4,154.52.
On Friday, gold prices fell again, dropping below 4,060 at one stage with an intraday decline of over 1%, and finally closed at 4,110.55.
💡Influencing Factors:
✔The main reasons for the sharp volatility in gold prices this week include the following:
After a rapid rise in early stages, gold was in an overbought state, creating technical correction pressure. Meanwhile, investors had a strong sentiment to take profits, leading to a large number of sell-offs.
✔In addition, the cooling of risk aversion, the strengthening of the U.S. dollar, and the fact that Federal Reserve officials entered a blackout period ahead of the interest rate decision that are resulting in a lack of remarks supporting interest rate cuts in the market also reduced the appeal of gold.
✔However, factors such as the ongoing U.S. government shutdown, geopolitical tensions, and market expectations for further interest rate cuts by the Federal Reserve provided certain support for gold prices.
💎Outlook for the Future:
From a technical perspective:
If gold breaks through 4,161, it may pave the way for a test of 4,200. If it continues to rise, traders may push gold prices above 4,250, or even target 4,300 and higher record highs.
But if gold falls below 4,040, the next target will be the October 22 low of 4,004.

Gold Breakdown Alert! Bears Aiming $3980 NextGold is currently showing a descending triangle / bearish channel pattern on the 15-minute chart. After testing the upper trendline resistance around 4113–4115, price has started to reject, indicating potential downward pressure.
The trendlines show clear lower highs and lower lows, confirming a short-term bearish structure. Volume is also decreasing on upward moves, suggesting weakening buying momentum.
📉 Trade Setup (Scalping / Intraday)
Signal: 🔻 SELL XAU/USD below 4105
Entry Zone: 4105 – 4110
Target 1: 4050
Target 2: 3980
Stop Loss: 4135
Risk/Reward Ratio: ~1:2
⚙️ Technical Indicators
Trendline Resistance: 4115
Support Zone: 4050 / 3980
Momentum: Bearish bias
Structure: Lower highs forming under descending resistance
💬 Analyst View
Gold may continue its short-term correction phase if it fails to hold above the 4110 resistance zone. A breakout below 4100 could trigger a fresh wave of selling pressure targeting the 4050 area initially.
If bulls reclaim 4135, this analysis becomes invalid and could shift bias to neutral.

Analysis of gold price trends next weekShort-term catalyst: Risk disturbances and technological stabilization form a synergy
Geopolitical "tail risks" continue to escalate: The escalation of US sanctions against Russian energy giants, the intensification of competition in the technology sector between China and the US, coupled with the 23-day government shutdown crisis in the US, have continuously fuelled market risk aversion. What is even more alarming is that the new restrictions in the Russian energy sector have spilled over to the transportation costs of commodities, and if this potential risk unfolds, it will rapidly drive funds into gold.
Stabilization after sharp decline validates support strength: On October 21, the spot price of gold in London dropped by more than 6% from its historical high of 4,381 US dollars, approaching the 4,100 US dollar mark, but then rebounded rapidly. On October 23, the intraday gain was over 1.27%, recovering most of the lost ground. This "sharp decline without collapse" trend fully confirms the strong support effect in the 4,000-4,100 US dollar range and also reflects the market's recognition of the long-term value of gold.
Technical aspect presents "strong consolidation" characteristics: The daily chart shows that after the price decline, it still operates above the middle band (3,964.72 US dollars) of the Bollinger Bands, without disrupting the upward trend; the RSI indicator has dropped from the overbought zone to the middle-high level of 58.19, which is a healthy "cooling without breaking through". Currently, the price is in the stabilization stage after the correction, and as long as the key support is held, the second upward attack momentum will gradually accumulate.
Trading strategy for gold next week
xauusd @buy4040-4060
TP:4110-4150-4200

Gold at a Critical Crossroads: Surge to $4700 or Drop to $3500?If the price breaks through the yellow zone, it could reach the red zone range. And if it doesn't cross the yellow zone, there's a chance it could head toward the 4700 range

XAUUSD – CPI Cools, USD Weakens, and Gold Regains MomentumMarket Overview:
Gold has regained bullish traction after the latest US CPI report showed softer inflation data, leading to a weaker USD and renewed buying across metals.
CPI figures came in below market expectations (Core CPI 0.2% vs 0.3%, CPI m/m 0.3% vs 0.4%, CPI y/y 3.0% vs 3.1%), signalling lower inflation pressure and reinforcing bets that the Fed will stay dovish heading into November.
As a result, gold bounced strongly from the 4,050–4,058 support zone, reclaiming key structure levels and stabilising above 4,100 USD/oz.
Market sentiment remains risk-sensitive, but the short-term tone favours further upside correction, as long as gold holds above the trendline and liquidity support zones highlighted on the chart.
Technical Outlook (H2):
The market structure suggests gold has completed its correction phase and is attempting to form a new bullish leg.
Price action shows a clean rejection at the 4,050 liquidity base, and the next immediate objectives are the 4,211 neckline and 4,260–4,342 supply zones.
Key Technical Levels:
Support / Buy Zone: 4,058 – 4,002
Liquidity Sweep Zone: 3,930 – 3,940
Resistance / Neckline: 4,211
Sell Zone Reaction Fibo: 4,260 – 4,342
Trading Plan – MMFLOW View
🔹 BUY Zone #1 (Continuation Play)
Entry: 4,058 – 4,050
Stop Loss: 4,035
Take Profit: 4,155 → 4,211 → 4,260
🔹 BUY Zone #2 (Liquidity Sweep Scenario)
Entry: 4,002 – 3,930
Stop Loss: 3,915
Take Profit: 4,058 → 4,155 → 4,211
Ideal setup if price retests liquidity before CPI-induced recovery continues.
🔹 SELL Zone(Reaction Trade)
Entry: 4,260 – 4,342
Stop Loss: 4,355
Take Profit: 4,211 → 4,100 → 4,058
Weekly Bias & Summary:
With CPI cooling and the USD losing momentum, gold’s structure points to a recovery phase, possibly extending into Wave III of the medium-term cycle.
However, the 4,211 neckline remains the key pivot — a breakout above this zone could trigger momentum extension toward 4,260–4,340, while a rejection may result in another range-bound pullback.
🟡 MMFLOW Bias: Bullish while above 4,050 — dips remain opportunities to buy.
Macro tone favours risk-on rotation, supporting gold’s upside into next week.
📊 Do you think gold will break 4,211 for the next bullish leg, or is another correction incoming before the real move?
👉 Follow MMFLOW TRADING for daily institutional updates and Smart Money Flow structure.

Analysis of the trend of gold next weekCurrently, the gold market is in a stage of "shock - upward movement driven by news". Although there is a battle between bulls and bears at the $4112 level, the upward opportunities next week are more worthy of attention. It is necessary to lay out in line with the trend and strictly control risks. The specific strategy is as follows:
I. Core Logic: Key Factors Influencing the Gold Price Trend Next Week
1. **The medium - and long - term support foundation remains intact**: The Federal Reserve has already started the interest - rate - cutting cycle. Judging from the meeting minutes, officials tend to gradually continue to loosen policies. As a result, the cost of holding gold is getting lower and lower, and its attractiveness is naturally increasing. Moreover, global central banks are still continuously buying gold. This long - term and large - scale buying can underpin the gold price, making a significant decline highly unlikely. In addition, the output growth rate of the world's top ten gold - mining enterprises has only been 1.8% in the past three years, and the problem of tight supply will also support the price in the long term.
2. **Short - term positive signals are increasing**: There are new signs of tension in the Middle East situation. The Houthi militia in Yemen has attacked the cargo ships in the Red Sea, resulting in 18% of the world's container ships changing their routes, and the shipping costs have soared. The market's safe - haven demand has significantly rebounded. Once such geopolitical risks ferment, they will drive funds to flow into gold. At the same time, the gold price rebounded after falling to around $4000 this week, indicating that the buying support at low levels is very strong, and much of the previous pullback pressure has been released.
3. **Key events next week will determine the direction**: The market is closely watching the changes in relevant news. Whether it is the new dynamics of the Middle East situation or the policy signals from the Federal Reserve, they will directly affect the gold price trend. Judging from the recent fluctuations, as long as the support near $4000 is not broken, the possibility of an upward trend is greater than that of a downward trend.
Trading strategy for gold next week
xauusd @buy4040-4060
TP:4110-4150-4200

Gold Trade Set Up Oct 24 2025Price has shifted to bearish structure in London session so for CPI i am expecting a run of SSL first to induce sellers, followed by internal 5m-15m bullish structure to then run up to sweep BSL and fill the daily FVG

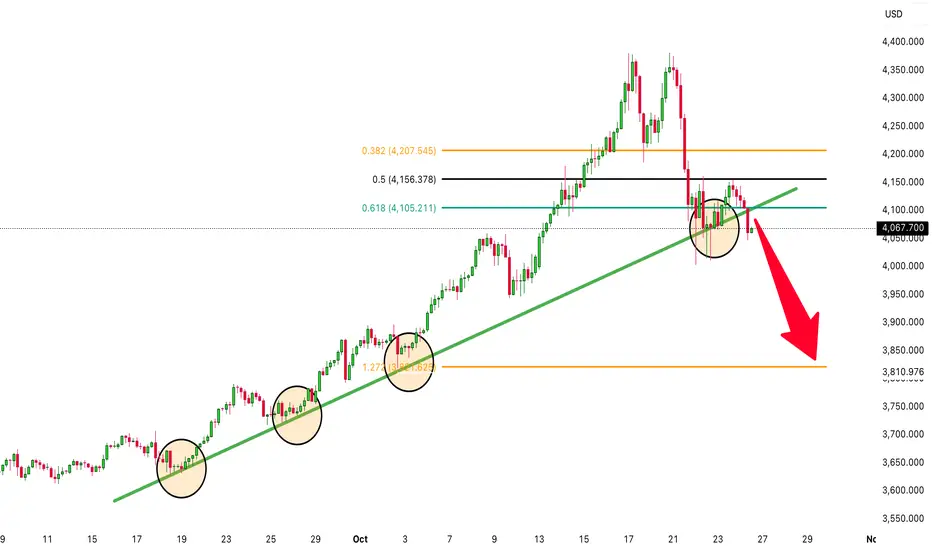
Time for GOLD To DROP! (XAUUSD is heading to the downside!)For many weeks gold (XAUUSD) has been sky rocketing to the upside, however there have been many new signals indicating that it could be a bearish move to the downside. Nothing keeps going up forever! Gold has broken major support levels including the trendline that has been holding it up for weeks. It has also been struggling to break above the fibonacci level of 0.50! Time to sell!
Gold:The main strategy is to go shortToday the gold rebounded to a high of around 4144.5 before coming under pressure and declining. It then fluctuated after touching a low of around 4070.
Regarding the current market trend, it is recommended to mainly trade based on technical trends: look for opportunities to go short when rebounds are under pressure. After all, the recent pullback and adjustment of the bullish trend have not yet come to a complete end.
As the U.S. government shutdown continues, some important economic data has entered a vacuum period, leading to widespread market speculation. Currently, a series of major news events—including China-U.S. trade relations, geopolitics, and the Federal Reserve's interest rate cuts—are all affecting market sentiment. After gold plummeted sharply at the start of the week and held the 4000 level, the bulls launched repeated counterattacks.
However, the sustainability of this bullish momentum appears weak for now: gold surged to around 4144 in the morning session but came under pressure again, and has now broken below the 4100 level, turning weak in the short term with further downside potential.
For resistance levels, pay attention to the short-term pressure around 4145-4150; for support levels, keep an eye on the short-term support around 4065-4070,At the same time, we must also be wary of Black Friday. If the support level is broken, gold is likely to continue falling to around 4000.
Since gold is under pressure and struggling to break through, the main trading strategy should be to go short when rebounds encounter pressure. Avoid trading in the middle range adopt a "wait and see" approach and refrain from chasing trades impulsively. Instead, wait patiently for key levels to enter positions.
💎Trading Strategy:
Buy 4060 - 4070
SL 4050
TP 4080 - 4100 - 4120
Sell 4100 - 4110
SL 4120
TP 4080 - 4070 - 4060
Daily-updated accurate signals are at your disposal. If you run into any problems while trading, these signals serve as a reliable reference—don’t hesitate to use them! I truly hope they bring you significant assistance

4H see W shape. Support is not broken and it is still bullish.Although gold has experienced a temporary pullback today, we remain bullish as long as the price remains above the upward trend line. While the hourly chart shows a downward trend, with moving averages diverging downward and technical indicators like the MACD forming a death cross, it appears that bears have regained control of the market in the short term.
But from the 4H perspective, if the short-term decline continues and it can effectively rebound after touching the trend line and move out of the W-shaped structure, then gold will be expected to hit the 4135-4145 pressure again, and then gradually hit the 4160, 4200 and other periodic resistance levels until the bulls return. As time goes by, the support points on the short-term trend line are constantly moving up. If it falls back to 4050-4035, try to go long on gold in batches with light positions, and the target is 4090-4130.
OANDA:XAUUSD
XAUUSD on consolidation ready for again upside XAUUSD is cool down & captured the consolidation zone from 4090-4140 .
What are my conditions For Today's session?
Currently i m looking for buy trade from 4085-4175 zone ,I'm expecting H4 and H1 Candle closing will be above 4100 .
Targets: 4145- 4175.
✳️Secondly if H4-H1 candle closes below 4070
our buying will be postpond and market will test 4045.

XAU/USD: US/RUSSIA TENSION RISING – WHERE NEXT FOR GOLD?Gold (£4,140/oz) has bounced back after a recent sharp drop from its record high. This strength is due to fresh US sanctions on Russia stirring geopolitical risk, and anticipation ahead of the key US Inflation Data (due 24/10). Fundamentals are putting a solid floor under the yellow metal.
📌 TECHNICALS & THE GAME PLAN
The Crucial Resistance: $4,180 - $4,186
Action: Look to SELL if price hits this level and shows clear signs of rejection. Only BUY for a continuation if it breaks decisively above $4,186 (The "Line in the Sand").
The 'Sweet Spot' Support: $4,085 - $4,091
Action: Bias BUY. This is the ideal area for a 'Buy The Dip' trade, supported by strong macro-fundamentals and recent buying interest.
The Safety Net (Stop-Loss): Below $4,057
If this level breaks, the pressure is on for a drop towards $4,000.
💡 VERDICT & STRATEGY
Gold is currently consolidating. Given the fierce geopolitical news flow, the best strategy is to look for long entries around that crucial support zone.
Ideal Entry: $4,085 - $4,091
Stop Loss (SL): Tight, just below $4,057
Target (TP): Aim for a re-test of $4,180
Keep your eyes peeled! And remember to watch that US Inflation figure! 🚀
#XAUUSD #Gold #ForexTrading #Geopolitics #TechnicalAnalysis #MarketAnalysis #Inflation #TradingStrategy #BuyTheDip #UKTraders

XAU/USD 10-23-25After the recent runup with gold it has pulled back to the 23.6 fib level on the daily timeframe and actually pushed below showing strong support in the 3975 - 4040 daily zone.
I would like to think that price will run right back up to retest the recent ATH of about 4382Gbut if I know gold in all her trickiness she will coast along at this 23.6 level then perhaps dip to the 38.2 or even the 50 then get a strong push back up to retest the high and from there probably come back down or push thru depending on macro economic and political events at that time.
Going back a few months to May of this year you can kind of see how price experienced similar behavior when it was breaking thru the 3430 - 3505 daily zone which obviously is that real push thru the previous psychological ATH level of 3500. Now history is repeating itself as we push to stay above the recent psychological ATH of 4000 towards 4500.
We shall see...

Gold Price Outlook – Trade Setup (XAU/USD)📊 Technical Structure
OANDA:XAUUSD Gold is consolidating between $4,132 resistance and $4,091 support. Price rejected from the resistance zone and is currently sliding lower. The structure shows a potential bearish continuation if sellers defend $4,128–$4,132, with downside pressure targeting the $4,091–$4,088 zone.
📌 Trade Setup
Entry: $4,128–$4,135 (near resistance rejection)
Stop Loss: $4,135
Take Profit: $4,091 → $4,088
Risk/Reward (R:R): ~1 : 5.26
🌍 Macro Background
Gold remains under pressure as traders focus on U.S. CPI data (Sep) due later today, expected at 3.1% YoY. Renewed USD demand and seasonal demand slowdown after India’s Diwali festival are capping upside momentum. However, safe-haven flows could reemerge amid the prolonged U.S. government shutdown and US-China trade talks set during the APEC summit. The Fed is still expected to cut rates by 25bps in November and December, which provides medium-term support.
🔑 Key Technical Levels
Resistance Zone: $4,128 – $4,132
Support Zone: $4,091 – $4,088
Breakout Levels: Above $4,140 = bullish invalidation, Below $4,085 = continuation lower
📋 Trade Summary
The bias remains bearish intraday below $4,132 resistance. CPI data and trade headlines may cause volatility spikes. Short positions near resistance offer better R:R as long as $4,135 is not breached.
⚠️ Disclaimer
This analysis is for reference only and does not constitute trading advice. Trading involves significant risk, and proper risk management is essential.
