XAU/USD – Gold Completes Liquidity Sweep Phase🔍 Market Context
After a prolonged decline from the ATH GOLD 4,381 USD peak, gold has formed a Liquidity Sweep around the 4,010 USD area, where selling pressure was fully absorbed by strong buying forces from the demand zone below.
The price structure shows signs of a Change of Character (ChoCH) for the first time since the peak, along with the emergence of an Order Block (OB) 4,081 USD – the starting point for a new upward momentum.
This indicates a high probability that the market is entering a technical retracement phase , aiming to retest the upper FVG resistance zone, or even extend back to the ATH area if buying pressure continues.
💎 Key Technical Structure
Liquidity Sweep: 4,010 – 4,020 USD → liquidity sweep bottom area, increased volume, confirming sell order absorption.
Order Block (OB): 4,081 – 4,090 USD → recovery initiation zone; if price retests this area and holds firm → confirmation signal for the upward phase.
Fair Value Gaps (FVG):
• FVG1: 4,196 – 4,210 USD → first target for the recovery wave.
• FVG2: 4,234 – 4,250 USD → next target, confluence with medium-term resistance.
OB | ATH GOLD: 4,370 – 4,380 USD → major resistance zone, previous peak; if price breaks through → confirms a new upward trend.
Current market structure:
→ Short-term: bullish recovery (recovering from the bottom zone).
→ Medium-term: waiting for a break of 4,234 to shift to a complete bullish structure.
📈 Trading Scenarios
1️⃣ BUY Setup #1 – Retest Order Block 4,081 USD
Entry: 4,081 – 4,085
SL: 4,060
TP1: 4,196
TP2: 4,234
TP3: 4,370
✅ Condition:
Wait for the price to retest the OB 4,081 area, showing a confirmation signal for an increase (rejection / engulfing bullish) or a small BoS on M15.
➡️ This is a classic buy-the-dip setup after a Liquidity Sweep – high probability due to OB + ChoCH confluence + strong demand zone.
2️⃣ BUY Setup #2 – Break & Retest FVG 4,196 USD
Entry: 4,196 – 4,200
SL: 4,180
TP: 4,234 → 4,370
✅ Condition:
Price breaks up the first FVG with good volume, then lightly retests without closing below 4,180.
➡️ Trend-following setup, riding the flow as price confirms a break of short-term resistance.
📉 Alternate Scenario – SELL Reaction at 4,234 USD (Short-term Scalp)
Entry: 4,234 – 4,240
SL: 4,255
TP: 4,196 → 4,100
✅ Condition:
If price reacts strongly and fails at the second FVG without follow-up volume increase → a short adjustment may occur.
➡️ Short-term sell, only execute if no continuation confirmation at FVG2.
⚠️ Risk Management
Prioritize BUY following the main recovery trend, only SELL with clear reaction.
Avoid FOMO buying in the middle range (4,130–4,180).
If price closes H1 below 4,060 → invalidates recovery trend, pause all buy orders.
💬 Conclusion
Gold has completed the Liquidity Sweep phase and is signaling a sustainable technical reversal .
Two key areas to watch:
4,081 USD (OB Zone): first bounce support area.
4,234 USD (FVG Zone): area confirming new upward structure.
If price holds OB and breaks through FVG, high chance gold will resume upward momentum towards the 4,370 USD (ATH GOLD) area.
👉 Reasonable Strategy:
Buy 4,081 USD → TP 4,234 / 4,370 USD.
Sell reaction 4,234 USD only with clear reversal signal.
🔥 “Liquidity has been swept — now it’s time to ride the recovery wave.”
⏰ Timeframe: 1H
📅 Update: 23/10/2025
✍️ Analysis by: Captain Vincent
Xauusdupdates

ElDoradoFx PREMIUM – GOLD ANALYSIS (24/10/2025, ASIA)Gold (XAUUSD) closed NY around 4,120–4,126 after rebounding from the 4,070–4,090 intraday liquidity shelf, showing a clear recovery structure from the prior US session dip. Into Asia, price is now trading near 4,123–4,126, just under the descending H1 resistance / MA confluence. Momentum has turned positive intraday, but price remains in a potential lower high region unless bulls can reclaim 4,143–4,154. Asia will determine whether this is a corrective pullback inside a broader down-leg or the start of a higher-low recovery leg.
⸻
🔍 1. Market Overview
• Price rebounded strongly during late US, suggesting buyers defended sub-4,090 levels.
• Current positioning is mid-structure, below major H1/H4 EMAs, suggesting recovery but not confirmed bullish reversal.
• Asia likely to range or extend recovery toward key resistance zones before directional decision into London.
⸻
🧭 2. Technical Breakdown
📅 Daily Chart (D1)
• Strong bearish correction from 4,38x, followed by stabilization above 4,100.
• Price currently rejecting lower and forming potential daily wick.
• RSI ~59, showing room higher if momentum sustains.
• MACD still above zero but tightening → awaiting confirmation candle.
✅ Bias: Neutral-to-mild recovery within macro bullish context.
⸻
⏳ 1H Chart (H1)
• Price rebounded from strong demand at ~4,070, set higher low, rallied toward 4,126 (current) but still below 4,150+ EMA confluence (yellow/white bands).
• Descending resistance line still active.
• RSI ~52, turning up.
• MACD turning positive but recovery unconfirmed until above 4,143+.
✅ Bias: Recovery phase but facing resistance – bulls need break above 4,143–4,154 to confirm higher low structure.
⸻
📉 30M Chart (M30)
• Clear BOS to upside after breakout from consolidation.
• Mid-term EMA support now rising from ~4,107–4,110.
• However, recent rejection candle printed near resistance area.
✅ Bias: Pullback possible unless 4,110 holds.
⸻
⏱️ 15M Chart (M15)
• Price has tapped resistance zone ~4,126–4,130 multiple times.
• Micro structure remains bullish from 4,070, but consolidation forming.
• MACD shows deceleration; RSI flattening near 60.
✅ Bias: Short-term accumulation/consolidation, waiting for breakout or rejection.
⸻
📍 5M Chart (M5)
• Micro rejection from white MA cluster around 4,126.
• Short-term support near 4,114–4,110.
• If 4,110 fails, fast liquidity drop to 4,098–4,090 likely.
✅ Bias: Micro bullish but losing momentum at resistance.
⸻
✨ 3. Fibonacci Golden Zone (H1 Impulse)
Last confirmed impulse: Low 4,070 → High 4,126
• 38.2% = 4,105
• 50% = 4,098
• 61.8% = 4,091
✅ Golden Zone = 4,105 – 4,091 (Ideal long area if pullback occurs and bullish confirmation appears).
⸻
🎯 4. High-Probability Scenarios
✅ Bullish Continuation Setup (Preferred if pullback occurs)
🔹 Buy Zone: 4,105–4,098 (core entry) or deeper 4,091
🎯 Targets: 4,126 → 4,143 → 4,154 → 4,168
🛑 SL: Below 4,083 or safer below 4,070.
✅ Bullish Breakout Setup (Momentum)
🔹 Buy on breakout + retest above: 4,126–4,130
🎯 Targets: 4,143 → 4,154 → 4,168
🛑 SL: Back inside 4,115.
⸻
⚠️ Bearish Reaction Setup (Sell at resistance)
🔹 Sell Zone: 4,143–4,154 (EMA confluence + descending trendline)
🎯 Targets: 4,126 → 4,110 → 4,098 → 4,091
🛑 SL: Above 4,160–4,165.
⛔ Bearish Breakdown Setup (Trend continuation lower)
🔹 Sell below retest of: 4,091
🎯 Targets: 4,070 → 4,058 → 4,046 → 4,024
🛑 SL: Above 4,105.
⸻
📅 5. Fundamental Watch – Asia Session
• No high-impact Asian data – flow & positioning-driven.
• DXY mildly neutral – may allow gold extension.
• Markets may stay cautious ahead of London session and FOMC sentiment later.
• A quiet Asia session often respects fib zones & micro structure.
⸻
📍 6. Key Technical Levels
Type Levels
🔼 Resistance 4,126 / 4,130 / 4,143 / 4,154–4,168
🔽 Support 4,114–4,110 / 4,105 / 4,098 / 4,091 (Golden Zone)
⚠ Reversal Zone 4,143–4,154
📉 Breakdown Level 4,091
🎯 Golden Zone 4,105 – 4,091
⸻
📌 7. Analyst Summary
Gold is currently in an intraday recovery phase, but still trading below significant H1 resistance & EMAs. The structure favors bullish continuation only if pullbacks into 4,105–4,098 hold or if price breaks and sustains above 4,130–4,143. A failure to break resistance and a drop below 4,091 would expose deeper retracement into 4,070 / 4,058.
⸻
✅ 8. Final Bias Summary
Condition Strategy
✅ Above 4,130 (confirmed) Bullish → aim for 4,143 / 4,154
✅ Bounce from 4,105–4,098 Buy pullback → target 4,126+
⚠ Rejection 4,143–4,154 Sell reaction → target 4,110 / 4,098
⛔ Below 4,091 (retest) Bearish → target 4,070 / 4,058
📍Golden Zone (Buy Opportunity): 4,105 – 4,091
📍Breakout Confirmation: Above 4,130
📍Breakdown Confirmation: Below 4,091
⸻
🥇 ElDoradoFx PREMIUM 2.0 – PERFORMANCE 23/10/2025 🥇
📊 GOLD TRADE RESULTS:
❌ BUY –40 pips (SL)
🔻 SELL +210 pips
⚖️ BUY LIMIT – BE
🔻 SELL +210 pips
🟢 BUY +210 pips
❌ BUY –60 pips (SL)
🟢 BUY +30 pips
🟢 BUY +100 pips
🟢 BUY +520 pips
🟢 BUY +210 pips
---
💰 TOTAL GOLD PIPS WON: ✅ +1,390 pips
📈 RESULT: 10 Signals → 7 Wins | 2 SL | 1 BE
🎯 WIN RATE (on executed trades): 78%
---
🔥 Strong momentum continuation with powerful upside breakouts delivering big gains 📈💎
👏 Congratulations if you profited! ✅✅✅🚀🚀🚀

Weekly Technical Analysis of the XAU/USD (Gold vs. Dollar)Weekly Technical Analysis of the XAU/USD (Gold vs. Dollar)
Weekly Scenarios
Bullish scenario: Gold holds the ~$4,000 zone and breaks through ~$4,200 → next target in the range of ~$4,500–4,700.
Consolidation: Price moves between ~$4,000 and ~$4,200, forming a base for the next impulse.
Bearish scenario: Break below ~$4,000 with volume and a change in structure → possible decline to ~$3,900 or lower.
✅ Conclusion
For the coming week, the technical picture for XAU/USD remains moderately bullish, but with a high degree of risk:
Holding support at ~$4,000 and breaking resistance at ~$4,200 could trigger a significant rally.
A break below ~$4,000 is a signal for caution and a potential correction. It's important for traders to react to volumes, breakout confirmations, and price behavior at designated levels.

Gold:Perfectly confirms the prediction🎉Today's gold trend is in perfect alignment with the key levels we preset, and the upper resistance range has exerted a significant suppressing effect.
✔We clearly indicated in the morning that "attention should be paid to the upper resistance around 4,135–4,150". In the actual market movement, spot London gold hit a daily high of 4,154.52, which just tested the upper edge of this resistance range before fluctuating under pressure. It finally traded around 4,130 and never broke through the 4,150 resistance ceiling throughout the day.
✔Meanwhile, although it dipped to an intraday low of 4,065.47, this level fell entirely within our preset support range of 4,060–4,070. The price then rebounded quickly, which confirms the supporting effect around this zone. The overall trading rhythm is completely consistent with the core logic of our prediction.

GOLD BREAK AND RETEST RECOVERY TOWARDS $4270 Overall Structure
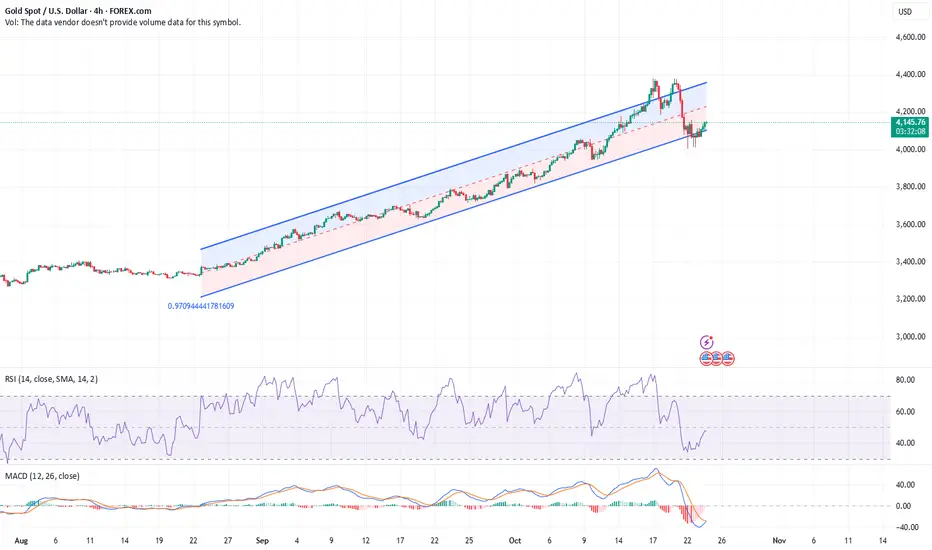
The chart shows a rising channel pattern (ascending parallel channel) that gold had been trading within for several days.
Recently, price broke below the channel, found support, and is now retracing upward toward potential resistance levels.
🧭 Key Observations
1. Trend Context
Previous trend: Bullish, as seen from the steady higher highs and higher lows inside the yellow channel.
Recent move: Sharp bearish breakout below the channel, followed by a strong recovery bounce.
Current structure: Gold is attempting to retest the lower boundary of the broken channel — a common “break and retest” setup.
2. Support Zone
The green arrow marks the support zone around $4,018–$4,040, where the last drop reversed sharply.
This area held as strong de…
📊 Trading Outlook
Bias: Short-term bullish recovery within a medium-term corrective structure.
Buy zone: Above $4,140–$4,150 with confirmation candle.
Targets: $4,206 / $4,253 / $4,271.
Stop-loss: Below $4,100 (for short-term trades).

XAU/USD – Gold Tests Final Structure Before Deciding New Wave“If the 3,950 USD zone is breached, the long-term uptrend may end.”
🔍 Market Context
After reaching the historical peak ATH GOLD 4,391 USD , gold has sharply corrected and formed a clear Change of Character (ChoCH) on the H1 frame.
Currently, the price is technically recovering to the Resistance – FVG – Fibonacci 4,216 USD zone, which was previously a distribution peak.
The sellers are regaining short-term advantage, while the Order Block zone (3,953–3,960 USD) — the starting point of the strongest growth on H4/Daily — is becoming the most critical defense line of the uptrend.
If this zone is decisively broken, the medium-term uptrend structure is likely to break and trigger a bearish expansion towards deeper liquidity zones like 3,689 USD.
💎 Technical Analysis
Resistance – FVG – Fib Zone: 4,216 – 4,228 → confluence resistance zone FVG + Fibo 0.618, suitable for sell reaction.
Liquidity Sweep Zone: 4,043 – 4,006 → intermediate liquidity sweep zone, temporary pause may occur.
Order Block | Structural Base: 3,953 – 3,960 → H4 momentum zone → ATH; if breached, long-term uptrend structure invalidated.
Liquidity Zone $$$: 3,689 – 3,685 → deep liquidity zone, potential target if OB is broken.
Overall Structure:
→ Short-term: bearish corrective phase.
→ Medium-term: bullish remains if 3,950 is not breached.
📉 Trading Scenarios
1️⃣ SELL Setup – Reaction at 4,216 – 4,228 USD zone
Entry: 4,216 – 4,228
SL: 4,240
TP1: 4,043
TP2: 3,956
TP3: 3,689
✅ Condition:
Wait for clear reversal signal (strong rejection or bearish engulfing) on H1/M15 at FVG resistance zone.
➡️ Classic “Sell the Rally” setup – follow the flow after ChoCH, target key OB zone 3,953 USD.
2️⃣ BUY Setup – Reaction at Order Block 3,953 – 3,960 USD
Entry: 3,956 – 3,953
SL: 3,940
TP: 4,043 → 4,216
✅ Condition:
Price holds OB and strong reversal signal appears (bullish engulfing / increased volume / small BoS structure turns bullish again).
➡️ This is the decision zone for medium-term trend: if it bounces strongly, buyers will regain control; if breached, gold enters a new deep decline cycle.
⚠️ Risk Management
Prioritize SELL when price retraces to 4,216 – 4,228 zone with reversal signal.
BUY at 3,953 only with clear reaction; if broken, stop all buy orders.
When price closes H4 candle below 3,950 → confirm bearish break, extend target to 3,689 USD.
💬 Conclusion
Gold is testing the Order Block foundation of the long-term uptrend (3,953–3,960 USD) .
If this zone holds, the market may rebound to 4,216 – 4,280;
but if breached, gold is likely to open a deep decline phase to 3,689 USD – where a massive amount of liquidity is concentrated at the bottom.
👉 Reasonable Strategy:
Sell 4,216 – 4,228 USD if there is a clear reversal signal.
Buy 3,953 – 3,960 USD if there is a strong reaction;
If 3,950 is breached → confirm extended downtrend, prioritize SELL continuation.
🔥 “This Order Block built the last gold rally — if it breaks, the next leg down will be brutal.”
⏰ Time Frame: 1H – reference H4/Daily
📅 Update: 22/10/2025
✍️ Analysis by: Captain Vincent

XAUUSD:Keep an eye on the 4,000 support mark📈The current price of London gold is 4,116.87 per ounce, up 28.36 from the previous trading day, with a percentage increase of 0.64%. So far today, the highest price has reached 4,137.35 per ounce, and the lowest is 4,065.47 per ounce. Currently, the price is in a state of fluctuating increase.
📝Market sentiment and fund flow:
Judging from the recent market performance, the price of London gold has fluctuated violently. On October 21st, the price of London gold once dropped by more than 6%, and the decline continued on the 22nd, with the lowest reaching 4,002.89 per ounce during the Asian session.
The significant decline in these two days was mainly due to the weakening of risk - off sentiment. The joint statement by the relevant parties in the Russia - Ukraine conflict in support of a cease - fire and the easing signals in Sino - US relations have weakened the safe - haven demand for gold.
At the same time, the previous large increase in the price of gold had accumulated a large number of profit - taking positions, and the pressure on investors to take profits was relatively high. However, the price rebounded on the 23rd, indicating that market sentiment has recovered to some extent, but overall it is still relatively cautious.
📝Technical analysis:
From the perspective of the 4 - hour cycle trend, the gold shows a trend of shifting from a bullish to a bearish rhythm in the short and medium term, forming a typical M - top pattern, which indicates that there may still be room for the price of gold to decline in the near future. However, the large - integer - level support of 4,000 per ounce is currently relatively clear, and in the short term, it may fluctuate within the range of 4,000 - 4,150. In terms of operation, it is mainly advisable to go short on rallies. The upper resistance level is in the range of 4,135 - 4,150, and the short-term support around the 4,065-4,070 range,then the key support level is in the range of 4,010 - 4,000.
💡In conclusion, the price has rebounded today, but due to the impact of the previous significant decline, it may fluctuate within the range of 4,000 - 4,150 per ounce in the short term, and the trend is uncertain. Investors need to closely pay attention to the changes in factors such as the geopolitical situation, Sino - US relations, and the Federal Reserve's policy.
💎Trading Strategy:
BUY 4010 - 4015
SL 4000
TP 4030 - 4020 - 4070
Sell 4120 - 4125
SL 4130
TP 4100 - 4080 - 4060
Daily-updated accurate signals are at your disposal. If you run into any problems while trading, these signals serve as a reliable reference—don’t hesitate to use them! I truly hope they bring you significant assistance

Price still in upwards channelAlright, here's the thing with gold. Recently, the price dropped sharply, almost 6%, which might sound alarming. But when we look at the bigger picture, gold is still in an upward channel or a rising trend. What does that mean? It shows that, despite this dip, gold still holds its value in the long run. Think of it like a staircase—sometimes you step down a bit, but you're still climbing higher overall. This is good news for investors because it means gold continues to act as a safe haven and a reliable hedge against things like inflation or economic uncertainty. The short-term drop could be due to temporary factors, but the long-term trend gives confidence that gold remains strong.
Price still in upwards channelAlright, here's the thing with gold. Recently, the price dropped sharply, which might look alarming. But when we look at the bigger picture, gold is still in an upward channel or a rising trend. What does that mean? It shows that, despite this dip, gold still holds its value in the long run. Think of it like a staircase—sometimes you step down a bit, but you're still climbing higher overall. This is good news for investors because it means gold continues to act as a safe haven and a reliable hedge against things like inflation or economic uncertainty. The short-term drop could be due to temporary factors, but the long-term trend gives confidence that gold remains strong.

23/10/68 : XAUUSD ( US Session )Using it from US Session until 11.00AM , I'll new analysis and update at 12.00PM
Resistance
4130-4135
4120-4125
4114
Support
4103
4093-4098
4082-4088

Gold Trade Set Up Oct 23 2025Gold is still overall in a bearish trend making LH/LL on the 4h so until we close above 4264 i will still be looking for sells under internal HL targeting SSL/PDL but if price breaks above HH price can possible make a run up for the 4h FVG and 15m supply

ElDoradoFx PREMIUM – GOLD ANALYSIS (23/10/2025, US SESSION)Gold is consolidating near 4,110–4,115 after attempting a bullish recovery from yesterday’s dip. Current PA is compressing within a minor intraday wedge under key dynamic resistance (H1 200EMA). The US session is likely to determine whether gold continues its bullish correction toward 4,150–4,162 or loses momentum and re-tests liquidity zones below 4,098–4,083.
⸻
📈 Market Overview
• Recent bullish recovery but still trading below major H1 protections.
• Buyers attempting to hold above 4,110, forming higher lows since early London.
• Sellers are defending resistance around 4,126–4,132, aligned with descending structure.
• Momentum mildly bullish but weakening — breakout decision likely in US volatility.
⸻
🧠 Technical Breakdown
📅 Daily (D1)
• Still in macro bullish uptrend, recent rejection candle confirmed lower wick buying.
• Current candle showing attempt to recover after heavy retracement.
• RSI holding around 59 — neutral but leaning recovery.
• Failure to climb above 4,150 today risks another bearish D1 candle.
⏳ 1H (H1)
• CHoCH confirmed from previous bearish swing, but price is still under key EMAs.
• Trading just below H1 200EMA (approx. 4,150–4,153) — a critical supply zone.
• Multiple rejections around 4,125–4,132, signaling short-term resistance.
• RSI ~53, balanced but slightly bullish.
• MACD histogram showing steady green momentum but starting to flatten.
📍Conclusion: US session needs a breakout above 4,132 or a strong retest to confirm direction.
🕒 30M
• Price consolidating in a tightening wedge.
• 200EMA overhead at 4,150 acting as session ceiling.
• MACD still green but declining — buyers losing steam.
• A break below wedge support (~4,104–4,106) may trigger corrective wave.
📉 15M–5M
• M15: Sideways structure; BOS previously bullish but now stalling.
• M5: Shows liquidity sweeps & quick rejections near 4,126 zone.
• Buyers holding structure above 4,110, but momentum slowing.
📍Scalp buyers may wait for retracement or bullish engulfing confirmation.
⸻
📐 Fibonacci Golden Zone (Last Impulse: 4,088 → 4,137)
🔸 38.2% → 4,119
🔸 50% → 4,113
🔸 61.8% → 4,106
✅ Golden Buy Zone: 4,119–4,106
⚠ If 4,106 breaks decisively, deeper pullback to 4,098–4,083 liquidity pocket is likely.
⸻
🎯 High-Probability Trade Scenarios
✅ Bullish Continuation (Preferred if zone holds)
📍Buy Zone: 4,119–4,106 (Fib confluence + bullish PA confirmation)
🎯 TP1 4,126 | TP2 4,132 (local high) | TP3 4,148 | TP4 4,159 (H1 200EMA)
🛑 SL below 4,102
⚡ Aggressive Breakout Buy
📍Trigger: Break & close M15 above 4,132
🎯 TP1 4,148 | TP2 4,153 | TP3 4,162 | TP4 4,168
🛑 SL below 4,125
🔻 Bearish Reversal from Supply (Only if clear rejection at 4,132–4,148)
📍Entry: Bearish engulfing/confirmation at 4,132–4,148
🎯 TP1 4,119 | TP2 4,113 | TP3 4,106 | TP4 4,098–4,083
🛑 SL above 4,153
📉 Breakdown Sell (Stronger correction case)
📍Trigger: Clean break below 4,106
🎯 TP1 4,098 | TP2 4,087 | TP3 4,071–4,058
🛑 SL above 4,113
⸻
📅 Fundamental Watch – US Session
• US jobless claims & mid-tier USD data may fuel volatility.
• DXY strength could cap gold upside near 4,148.
• If US yields fall, gold may break 4,132 strongly.
⸻
📍 Key Technical Levels
Resistance: 4,126–4,132 / 4,148–4,153 / 4,162
Support: 4,119 / 4,113 / 4,106 / 4,098 / 4,083
Trendlines:
🔻 Descending resistance capping at 4,132
🔺 Ascending intraday support at 4,110
⸻
🧾 Analyst Summary
Gold is coiling for a directional move during US session. Buyers still maintain short-term structure as long as price holds above 4,106–4,110. A bullish breakout above 4,132 may fuel an impulsive move into H1 supply at 4,148–4,159. However, repeated rejections could cause a deeper correction to 4,098–4,083 before any further bullish attempt.
⸻
📌 Final Bias Summary
✅ Bias: Mildly bullish above 4,106
⚠️ Rejection at 4,132 = short-term sell wave
📍 Buy dips > 4,106 | Strong buy only above 4,132
📍 Sell only on confirmed rejection or breakdown below 4,106
— ElDoradoFx PREMIUM 2.0 Team 🚀
⸻

Gold (XAU/USD) Technical AnalysisAnalysis:
Gold is currently trading around 4,120, showing a minor bullish correction within a descending channel. The price has bounced from the support buy zone (4,040–4,060), indicating buyer activity at this level. However, the structure remains bearish in the short term as long as the price stays below the descending trade line.
A possible scenario is a short-term pullback toward the upper trade line before another retest of the support zone. If the support holds again, a bullish reversal could target the 4,383 level, aligning with the upper boundary of the previous high.
Key Levels:
Support Zone: 4,040 – 4,060
Resistance (Trade Line): 4,180 – 4,200
Target (Bullish): 4,383
Outlook:
Neutral-to-bullish in the medium term if the support zone remains intact. A break below 4,040 would invalidate the bullish setup and signal further downside continuation. QSE:MRDS QSE:NLCS QSE:ERES QSE:QNBK QSE:FALH QSE:BLDN QSE:DUBK QSE:IGRD QSE:QIBK QSE:IQCD QSE:MEZA QSE:AKHI QSE:WDAM

XAU/USD 23 October 2025 Intraday AnalysisH4 Analysis:
-> Swing: Bullish.
-> Internal: Bullish.
Analysis and bias remains the same as analysis dated 20 October 2025.
Price has printed as per previous intraday expectation by printing a bearish CHoCH which indicates, but not confirms, bullish pullback phase initiation.
Price is currently trading within an established internal range, however, I will continue to monitor price with regards to depth of pullback.
Intraday expectation:
Price to continue bearish, react at either discount of 50% internal EQ, or H4 supply zone before targeting weak internal high priced at 4,380. 990.
Note:
The Federal Reserve’s sustained dovish stance, coupled with ongoing geopolitical uncertainties, is likely to prolong heightened volatility in the gold market. Given this elevated risk environment, traders should exercise caution and recalibrate risk management strategies to navigate potential price fluctuations effectively.
Additionally, gold pricing remains sensitive to broader macroeconomic developments, including policy decisions under President Trump. Shifts in geopolitical strategy and economic directives could further amplify uncertainty, contributing to market repricing dynamics.
H4 Chart:
M15 Analysis:
-> Swing: Bullish.
-> Internal: Bearish.
Analysis and bias remains the same as yesterday's analysis dated 22 October 2025.
Price has printed according to my analysis dated 20 October 2025 where I mention that price is to continue bullish, react at either premium of 50% internal EQ, or M15 demand zone, before targeting weak internal low priced at 4,185.910.
Price has printed a bearish iBOS and subsequently a bullish CHoCH to indicate, but not confirm bullish pullback phase initiation.
Price is now trading within an established internal range.
Intraday expectation:
Price to react at either premium of 50% internal EQ, or M15 demand zone, before targeting weak internal low priced at 4,004.280.
Note:
Gold remains highly volatile amid the Federal Reserve's continued dovish stance, persistent and escalating geopolitical uncertainties. Traders should implement robust risk management strategies and remain vigilant, as price swings may become more pronounced in this elevated volatility environment.
Additionally, President Trump’s tariff announcements, particularly against China, are expected to further amplify market turbulence, potentially triggering sharp price fluctuations and whipsaws.
M15 Chart:

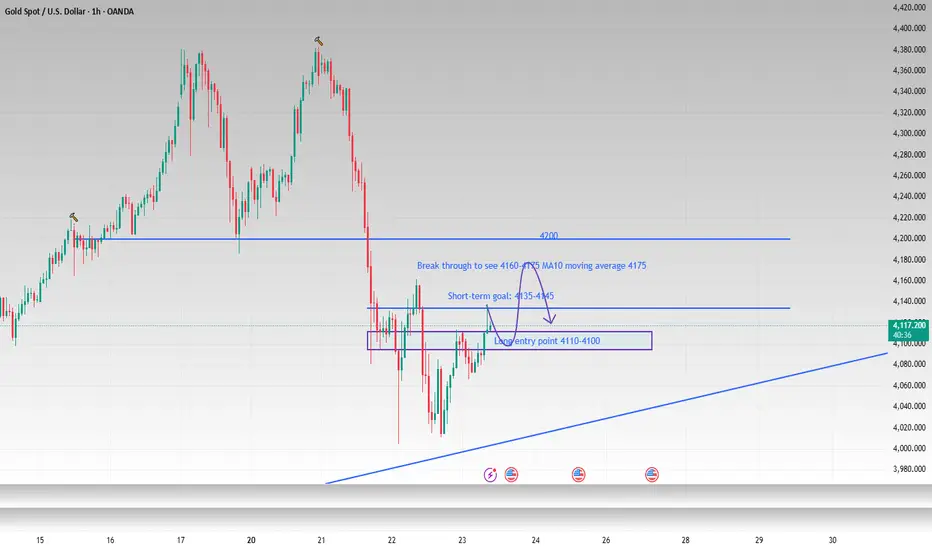
The trend line is not broken and the medium to long term is bull
Good morning, bros. Gold has fallen from its high of 4380, dropping nearly $380. This significant drop is relatively rare in the past six months. However, judging from the 4H cycle trend, the current gold price is still above the rising trend line. The 4000 mark is a defensive point for bulls. The decline will only continue after successfully breaking through 4000. Yesterday, the lowest point only retreated to around 4015-4005 before it began to rebound. Although it did not provide us with an ideal entry opportunity, it also confirmed the determination of the buyers below to hold on to the 4000 mark. Therefore, until a clear break below the trend line is achieved, our bullish outlook remains unchanged.
The gold price rebounded to around 4135 during the day and then fell back. As I told you yesterday, this position is a relatively dense trading area. I believe the current decline is the market accumulating strength to hit yesterday's rebound high, and it also provides us with a good opportunity to enter the long market. Pay attention to 4110-4100 below. If it retreats to this range, you can try to go long on gold in batches. The first target can continue to look at 4135-4145.
OANDA:XAUUSD
ElDoradoFx PREMIUM – GOLD ANALYSIS (23/10/2025, LONDON SESSION)Gold (XAUUSD) is trading around 4,125–4,132 after a sharp pre-London rally that broke the M30 descending trendline and printed a BOS on M15. Price tapped the M15 200-EMA / yellow band and the local swing high (4,132–4,138), then paused with RSI(15m) ≈ 70 → early overextension. H1 shows a constructive recovery, but the H1 200-EMA cluster sits higher at ~4,153–4,159, marking today’s first major supply.
⸻
🔍 Technical Outlook
Daily Chart (D1)
• Bullish response candle after the two-day liquidation; price defended the 4,00x shelf.
• Price remains above 20/50-DMA → macro uptrend intact, in corrective rebound.
• RSI ~59, turning up; MACD easing higher (momentum rebuilding).
Bias: Bullish rebound within broader uptrend.
⸻
1H Chart (H1)
• Clear intraday base at 4,004–4,024; successive higher lows into London.
• CHoCH printed; price now pressing the H1 50/100-EMA band and eyeing H1 200-EMA ~4,153–4,159.
• MACD rising from deep negative; RSI mid-50s → room higher before overbought.
Intraday Bias: Bullish while above 4,110–4,114; watch reaction at 4,148–4,159.
⸻
15M Chart (M15)
• Clean BOS through intra-range highs; impulsive leg 4,088.9 → 4,137.7 hit the M15 200-EMA and paused.
• RSI peaked ~70 (overbought); MACD strong but flattening → likely shallow pullback before next attempt.
Short-term View: Buy dips toward 4,119–4,106, or buy a clean breakout >4,138.
⸻
5M Chart (M5)
• Micro descending cap from the spike high; structure still higher-lows above 4,120–4,122.
• MACD easing; first support at the 5M MA stack 4,118–4,121, deeper pivot 4,112–4,114.
⸻
✨ Fibonacci Golden Zone
A) Intraday (M15 leg 4,088.9 → 4,137.7)
• 38.2% = 4,119
• 50.0% = 4,113
• 61.8% = 4,106
✅ Golden Zone (M15) = 4,119–4,106 → prime London dip-buy area.
B) H1 swing (4,004 → 4,137.7)
• 38.2% = 4,086–4,087
• 50.0% = 4,071
• 61.8% = 4,058
✅ Golden Zone (H1) = 4,071–4,058 (deeper discount if London retraces hard).
⸻
🎯 High Probability Scenarios
Bullish Continuation Setup (Preferred)
✅ Buy 1: 4,119–4,113–4,106 (M15 Golden Zone) on bullish rejection/engulfing.
🎯 TPs: 4,126 (fill) → 4,132–4,138 (weak high) → 4,148–4,153 (first supply) → 4,159
🛑 SL: below 4,102 (or structural low of entry leg)
✅ Buy 2 – Break & Retest: Above 4,138/4,140 (clean 5–15M close & retest).
🎯 TPs: 4,148–4,153 → 4,159 → stretch 4,168
🛑 SL: back inside 4,132
⸻
Bearish Correction / Fade Setup
⚠️ Sell 1 (Rejection): 4,148–4,159 (H1 200-EMA cluster / supply) with clear rejection wick or bearish engulfing.
🎯 TPs: 4,132 → 4,119 → 4,113/4,106
🛑 SL: above 4,162–4,166
📉 Sell 2 – Breakdown: Below 4,106 (loss of 61.8% of M15 leg) or aggressive below 4,096 (EMA stack).
🎯 TPs: 4,087 → 4,071–4,058 (H1 Golden Zone) → 4,046
🛑 SL: back above 4,113
⸻
📅 Fundamental Outlook – London Session
• Calendar light in EU morning; technicals lead.
• Watch DXY drift—soft dollar supports continuation higher; spike in DXY caps rallies near 4,148–4,159.
• US headlines later can inject volatility—don’t overstay at supply.
⸻
⚠️ Key Levels to Watch
Resistance: 4,132–4,138 (weak high) / 4,148–4,153–4,159 (H1 200-EMA supply) / 4,168
Support: 4,126/4,122 (intra) / 4,119–4,113–4,106 (M15 Fib zone) / 4,096 / 4,087 / 4,071–4,058 (H1 Fib zone)
⸻
✅ Summary
London opens with bullish momentum after a confirmed M15/M30 breakout. The highest-quality long is a dip buy into 4,119–4,106 (M15 Golden Zone) with confirmation, targeting a sweep of 4,132–4,138 and a test of the H1 200-EMA supply 4,148–4,159.
If price reclaims 4,138–4,140, momentum continuation is favored.
Failure at 4,148–4,159 or a break below 4,106 shifts bias to a corrective leg into 4,087 → 4,071–4,058.
Break Confirmation:
• Buy above 4,138–4,140 (retest)
• Sell below 4,106 (retest)
Golden Zones: 4,119–4,106 (M15) and 4,071–4,058 (H1).

Gold's Historic Crash! MSS $4195: Waiting for SELL at $4185📰 CONTEXT (FUNDAMENTAL)
Gold suffered its sharpest drop since 2013 after hitting a record $4,398. The decline was mainly due to technical profit-taking, not major macroeconomic events. Long-term fundamental factors (inflation, uncertainty) still support Gold, but a short-term correction is necessary.
📊 TECHNICAL ANALYSIS (1H Chart)
MSS Confirmed: Price made a strong break (Breakout) of the crucial support at $4,195 - $4,200. This zone has now flipped to become New Resistance (The ideal SELL zone).
The market is currently in a Technical Pullback phase.
🎯 DETAILED TRADING PLAN
The preference is to SELL at the Resistance re-test zone, aligned with the new market structure.
1. SELL Strategy (Pro-structure Trade)
SELL ZONE: $4183 - 4185
SL (Stop Loss): $4193
TP (Take Profit): $4175 - 4165 - 4155 - 4145
2. BUY Strategy (Counter-trend Scalp)
BUY ZONE: $4060 - 4055
SL (Stop Loss): $4030
TP (Take Profit): $4091 - 4114 - 4185
🔥 Expert Action: Wait for the price to pull back to the $4183 - 4185 zone to look for a SELL (Short) setup with a favorable R:R ratio.
Always remember to manage risk (SL 1-2% of capital).
Are you going to BUY or SELL? Leave your thoughts and Follow for the latest updates!
#XAUUSD #GOLD #Forex #TradingView #TechnicalAnalysis

23/10/68 : XAUUSD ( Europe / London Session )Using it from Europe Session until 7.00PM , I'll new analysis and update at 8.00PM
Resistance
4112-4117
4101-4107
4096
Support
4085
4075-4080
4064-4070

XAUUSD: 800 Pips Secured, but Is the Correction Really Over?Yesterday, after revisiting the 4,000 support zone as expected and explained in my previous analysis, Gold bounced strongly and tested the area above 4,100.
That rally delivered around 800 pips profit on my long trade, and now the market is showing a mild pullback, consolidating around 4,085.
The key question now:
👉 Is the overall correction over, or is there still more to unfold?
From a technical perspective, as long as 4,000 remains intact, Gold retains its bullish potential toward the 4,200 resistance zone.
However, I prefer to stay patient at the moment — being flat at the time of writing — and will wait for a potential dip toward 4,050 or slightly below.
If the price shows a positive reaction in that area, I’ll consider re-entering long positions.
🎯 Upside targets:
• First: 4,150
• Second: 4,200
Keeping a positive risk-reward balance remains the main priority.
🚀 Let’s see if the market confirms the plan.

XAUUSD – Waiting for a Breakout to Confirm the Next Bullish WaveGold remains under pressure, trading slightly below 4,100 USD/oz despite ongoing geopolitical tensions and weak global sentiment.
On the higher timeframe, the structure still respects its ascending channel, showing no signs of a deep breakdown yet.
During the early Asian session, renewed buying interest has started to emerge, supported by a stable inflow of safe-haven demand.
Technically, price is attempting to form a bullish continuation structure (Dow wave) around the 4,110 zone.
If a breakout above this key level occurs, gold could accelerate toward 4,155, and potentially extend into a corrective bullish wave targeting 4,220–4,260, aligning with the Fibonacci retracement confluence and the CP/OBS sell zone on the chart.
Technical Outlook (M30):
Price action suggests a potential wave recovery structure forming after last week’s steep decline.
The 4,155 level acts as a key inflection point — it will decide whether bulls regain control or bears push for another correction.
Key Levels:
CP Zone Up / Breakout Base: 4,053 – 4,055
Short-Term Key Level: 4,110 – 4,115
Mid-Level Resistance: 4,155 (structure pivot)
Fibo Sell Zone / Wave End Target: 4,220 – 4,263
Trading Plan:
🔹 BUY Setup #1
Entry: 4,020 – 4,018
Stop Loss: 4,010
Take Profit: 4,030 → 4,035 → 4,040 → 4,050 → 4,060 → 4,100
Bias: Reaccumulation Phase (structure support)
🔹 BUY Setup #2 (Scalp Play)
Entry: 4,053 – 4,051
Stop Loss: 4,043
Take Profit: 4,060 → 4,070 → 4,080 → 4,090 → 4,100 → 4,150
Note: Ideal for intraday traders watching the breakout base.
🔹 SELL Setup (Liquidity Reaction Zone)
Entry: 4,263 – 4,265
Stop Loss: 4,273
Take Profit: 4,255 → 4,250 → 4,240 → 4,230 → 4,220 → 4,210 → 4,200
Summary:
Gold continues to consolidate above 4,050, showing signs of early recovery after the recent 3,000-pip correction.
The 4,155 level remains the key pivot for short-term direction — a breakout here could confirm a Wave 3–5 recovery structure, while rejection could bring one more pullback.
Macro and geopolitical uncertainty still favour safe-haven flows, keeping the bullish scenario valid as long as 4,000–4,020 holds.
📊 What’s your take — will gold break above 4,155 to start a new bullish wave, or reject and extend the correction further?
👉 Follow MMFLOW TRADING for institutional-style updates and daily structure-based setups.

Today's trading strategy for gold is hoped to be helpful to you.Gold Short Trading Strategy Analysis (Current Gold Price: $4,080 per Ounce)
Based on the current market dynamics, gold is in a correction phase following a previous sharp rally. The $4,080 level still has short-term downside potential, presenting an opportunity to go short and capitalize on the short-term adjustment. However, strict risk control is essential. The specific strategy is as follows:
Core Logic for Short Selling
1.Strong Short-Term Correction Demand: Gold has surged from lower levels to a record high above $4,300. The excessively rapid uptrend has led to an "overbought" market, similar to a tightly stretched spring that needs to rebound. It has fallen for three consecutive days recently, with a cumulative drop of nearly 6% in two days, marking the largest single-day decline since April 2013. This correction is a natural "cooling-off" process for the market, and short-term selling pressure has not been fully released yet.
2.Bullish Factors on Hold, Bearish Factors Gaining Momentum: There have been signs of easing in the geopolitical tensions that previously drove up gold prices, as many European countries have expressed support for ceasefire and peace talks, leading to a rapid decline in safe-haven demand. Meanwhile, investors and institutions that profited from the earlier rally are taking the opportunity to sell and lock in profits, further amplifying the downward momentum of gold prices. Although long-term supporting factors remain intact, short-term market sentiment has shifted to cautious.
3.Technical Indicators Signaling a Downtrend: From the price movement perspective, gold has broken below key levels such as $4,100 and $4,200, and the current rebound momentum is very weak. The short-term resistance above is quite prominent; unless the price can rise above $4,160, the correction trend will be hard to reverse, and it is highly likely to continue falling further in the near future.
Today's Gold Trading Strategy
xauusd @sell :4110-4120
pt:4080-4060
sl:4140

Gold: Focus on the 4000 markAfter gold prices recorded a sharp decline on Tuesday, they continued their correction on Wednesday. However, the downward momentum weakened significantly when approaching the 4,000 mark, with no effective break below this level.
The price tested this mark multiple times during the day but stabilized and rebounded each time, indicating that the 4,000 mark has initially formed short-term support. Based on this, today’s focus should be on whether the 4,000 mark can hold: if it remains intact, short-term price action is expected to be a wide-ranging oscillation at higher levels for a correction; if broken, it may open up further downside space.
On Wednesday, gold prices repeatedly tested the 4,010-4,000 range, and candlesticks with long lower wicks were formed each time. This candlestick pattern directly confirms the strong support nature of this range. Today trading should take this range as the core reference: on the premise that the 4,000 mark is not broken and the 4,010-4,000 support range remains intact, it is not advisable to blindly chase short positions at low levels, and short-term rebound risks should be guarded against.
💎Trading Strategy:
@Buy 4010 - 4015
SL 4000
TP 4030 - 4020 - 4070
@Sell 4120 - 4125
SL 4130
TP 4100 - 4080 - 4060
Daily-updated accurate signals are at your disposal. If you run into any problems while trading, these signals serve as a reliable reference—don’t hesitate to use them! I truly hope they bring you significant assistance

Gold Price Outlook – Trade Setup (XAU/USD)📊 Technical Structure
OANDA:XAUUSD Gold extended losses, trading near $4,060–$4,070 after its biggest one-day drop in five years.
Immediate support zone is around $4,060–$4,070, while the resistance zone lies at $4,132–$4,141.
The current chart suggests a potential rebound scenario from support, with upside capped at resistance.
Failure to hold $4,060 could expose the next leg lower toward $4,020–$4,000.
📌 Trade Setup
Entry (Long): $4,070 (near support zone)
Stop Loss: $4,053 (below support)
Take Profit: $4,132 (resistance zone retest)
Risk-to-Reward (R:R): ≈ 1 : 4.26
🌍 Macro Background
Gold remains under heavy pressure after two days of sharp selloff, even as the US Dollar Index (DXY) weakened slightly near 98.80. The move reflects profit-taking following gold’s record rally, while traders are cautious ahead of Friday’s US CPI data (Core CPI expected at 3.1% YoY).
At the same time, Reuters reported that the White House is weighing new export curbs on China’s tech sector, intensifying trade uncertainty. Despite near-term weakness, gold is still up 54% YTD, supported by market bets that the Fed will cut rates by 50 bps at its final two policy meetings this year, with additional easing priced in for 2026.
Thus, while short-term volatility may persist, macro drivers still favor dip-buying strategies.
🔑 Key Technical Levels
Resistance: $4,132 / $4,141
Support: $4,060 / $4,070
Upside Target: $4,132
Downside Risk: $4,020 / $4,000
📋 Trade Summary
Gold is consolidating near $4,060–$4,070 support, with technicals hinting at a short-term rebound opportunity toward $4,132 resistance. However, the broader tone remains cautious ahead of the US CPI release and potential new US-China tech trade restrictions.
⚠️ Disclaimer
This analysis is for reference only and does not constitute trading advice. Trading involves significant risk, and proper risk management is essential.
