ElDoradoFx PREMIUM – GOLD ANALYSIS (23/10/2025, ASIA SESSION)Gold (XAUUSD) closed NY around 4,098–4,102 after a constructive rebound from the 4,004–4,024 liquidity shelf. Into Asia, price is coiling just under 4,110–4,113 (intraday high / weak high on 5–15M) with rising short-term MAs beneath (4,083–4,085 cluster), while higher-timeframe EMAs remain overhead on H1/H4. Expect Asia to decide between a continuation leg toward 4,140/4,148 or a controlled pullback into the intraday fib zones before any further move.
⸻
🔍 Technical Outlook
Daily Chart (D1)
• Strong two-day correction off 4,38x followed by attempt to print a rejection tail from 4,00x; macro uptrend still intact above 20/50-DMA.
• RSI cooled to the mid-50s; room either side.
• MACD histogram shrinking but still above baseline → corrective, not trend break.
Bias: Corrective rebound inside a broader bullish trend.
⸻
1H Chart (H1)
• Clear rebound structure: swing L 4,004 → H ~4,113 then consolidation.
• Price is testing a descending trendline and sits below H1 100/200 EMA band ~4,147–4,16x (yellow/white on your chart) → overhead supply remains.
• RSI ~50 with positive slope; MACD turning up from deep negative, confirming recovery but not yet a trend flip.
Intraday Bias: Mildly bullish while 4,083–4,085 holds; watch rejections near 4,113/4,140/4,148.
⸻
15M Chart (M15)
• BOS to the upside from the 4,024–4,030 base; pullbacks bought at 4,096–4,100.
• Current range: 4,096–4,113 with overhead liquidity beacons 4,130 → 4,140.
• MACD green, RSI ~60 → momentum positive but slowing under trendline.
Short-term View: Bullish bias to resistance; pullback likely if 4,113 fails.
⸻
5M Chart (M5)
• Micro down-sloping resistance from the 4,110 peak; price holding above MA cluster 4,083–4,085 and the 5M mid-band ~4,098.
• MACD recently crossed down on 5M (loss of pace), but not yet a structural break.
• A clean 5M close >4,112 typically runs stops to 4,130+.
⸻
✨ Fibonacci Golden Zone
Last confirmed H1 impulse: Low 4,004 → High 4,113
• 38.2% = 4,071
• 50% = 4,058
• 61.8% = 4,046
✅ Golden Zone = 4,058 – 4,046 (prime buy zone)
Confluence: prior NY mid-range, lower channel support, and below the 5M/15M MA cluster (first catch at 4,083–4,071, core at 4,058–4,046).
⸻
🎯 High Probability Scenarios
Bullish Continuation Setup (Preferred if pullback forms)
✅ Buy 4,071–4,058 (scale to 4,046 if swept) on bullish rejection/engulfing.
🎯 Targets → 4,098 (fill) → 4,113 (weak high) → 4,130 → 4,140/4,148
🛑 SL: below 4,040–4,045 (outside 61.8%/structure)
Bullish Breakout Setup (Momentum)
✅ Buy on break & 5–15M retest above 4,113.
🎯 Targets → 4,130 → 4,140 → 4,148 (H1 supply/EMA band)
🛑 SL: back inside 4,103–4,105
⸻
Bearish Correction Setup (Fade resistance)
⚠️ Sell 4,140–4,148 if clear rejection (upper channel / H1 EMA band).
🎯 Targets → 4,113 → 4,098 → 4,083 → 4,071
🛑 SL: above 4,152/4,156
Bearish Breakdown (Continuation lower)
⚠️ Sell below 4,046 (clean break of 61.8% + retest).
🎯 Targets → 4,030 → 4,024 → 4,011 → 4,004
🛑 SL: back above 4,058
⸻
📅 Fundamental Outlook – Asia Session
• No major Asia data on deck; flow-driven session likely.
• Watch DXY drift after NY close; soft DXY favors the pullback-then-buy path.
• Headline risk (Fed speakers later) could cap rallies near 4,14x–4,15x ahead of EU/US hours.
⸻
⚠️ Key Levels to Watch
Resistance: 4,113 (breakout line) / 4,130 / 4,140–4,148 (H1 EMA/supply)
Support: 4,098–4,096 (intraday) / 4,085–4,083 (MA cluster) / 4,071 / 4,058–4,046 (Fib Golden Zone) / 4,024–4,011 / 4,004
⸻
✅ Summary
Asia opens with constructive bullish structure on the intraday, but capped by the H1 EMA/supply overhead. Best-quality long is buying the pullback into 4,071 → 4,058 (core 4,058–4,046 Golden Zone) with confirmation, aiming for 4,113 → 4,130 → 4,140/4,148. If price breaks and holds above 4,113, momentum longs are valid. A hard rejection at 4,140–4,148 or a break below 4,046 shifts bias to corrective sells back into 4,030 → 4,011/4,004.
Break Confirmation:
• Buy above 4,113 (retest)
• Sell below 4,046 (retest)
Golden Zone: 4,058 – 4,046 (with first support catch 4,071)
⸻
🥇 ElDoradoFx PREMIUM 2.0 – PERFORMANCE 22/10/2025 🥇
📊 GOLD TRADE RESULTS:
⚖️ BUY – BE
🟢 BUY +130 pips
🟢 BUY +70 pips
🔻 SELL +220 pips
🔻 SELL +40 pips
🟢 BUY LIMIT +60 pips
⚪️ SELL LIMIT – Deleted (No Entry)
❌ SELL LIMIT –60 pips (SL)
🔻 SELL +40 pips
---
💰 TOTAL GOLD PIPS WON: ✅ +500 pips
📈 RESULT (Executed trades):
8 Active Trades → 6 Wins | 1 SL | 1 BE
🎯 WIN RATE (on active trades): 75%
---
🔥 Consistent upside momentum caught — clean intraday reversals & disciplined exits kept us in control 💎
👏 Congratulations if you profited! ✅✅✅🚀🚀🚀
Xauusdupdates

When Everyone Was Hyped, We Warned We called the bearish turn on gold right on time:
After we posted the analysis, gold printed one of its sharpest daily drops in years—momentum the market hadn’t seen in a long time. The core view stands: after brief, counter-trend bounces, the primary path remains down. Revisit the previous analysis; the expectation is continued downside after in-trend corrections.
---------------------------------------------------------------------------------------------
🚀 Who am I?
I'm Mahdi, a prop firm trader with 7+ years of experience in technical analysis, mainly focusing on Smart Money Concepts and Elliott Wave theory.
I specialize in delivering high-quality trading signals, market insights, and educational content tailored for serious traders and investors.
📊 My Tools: SMC, Elliott Wave, Fibonacci, Liquidity Grabs, Order Blocks
💼 Prop Challenge Passed: Yes | Funded Account: In Progress
🔗 Follow for consistent updates and trading insights.

ElDoradoFx PREMIUM – GOLD ANALYSIS (22/10/2025, US SESSION)Gold (XAUUSD) is currently trading around 4,025, showing bearish continuation after failing to hold earlier London recovery attempts. Price was rejected strongly near the 4,114–4,125 supply zone, leading to a fresh break lower. The pair is now sitting above the 4,004–4,011 liquidity zone, which is a critical decision area for US volume—either to fuel another push lower or trigger a corrective bounce before continuation.
⸻
🔍 Technical Outlook
Daily Chart (D1)
• Gold continues its bearish corrective phase after multiple failed attempts to reclaim 4,381.
• Today’s candle is currently bearish, pressing toward yesterday’s lower wick region around 4,004.
• RSI has shifted downward from prior strength, signaling momentum loss from buyers.
• MACD histogram fading, indicating continued corrective pressure within macro uptrend.
Bias: Bearish corrective continuation unless 4,125 is reclaimed.
⸻
1H Chart (H1)
• Structure is clearly bearish with repeated lower highs from 4,254 → 4,170 → 4,125.
• Current price consolidating near lower support, testing the 4,004–4,011 reaction zone.
• RSI around 35 → bearish with potential for short-term relief bounce.
• EMA stack remains bearish, with 20 EMA and 50 EMA acting as resistance zones near 4,060.
Intraday Bias: Bearish; expecting either rejection on pullback or continuation through 4,004.
⸻
15M Chart (M15)
• Minor bounce attempts observed at 4,011, but structure remains lower high/lower low.
• MACD flattening, indicating possible pullback into premium areas for better sell entries.
• Price currently trapped between intraday minor support (4,011) and resistance (4,037–4,051).
Short-term View: Bearish with potential for short retracement toward resistance before next move.
⸻
5M Chart (M5)
• A small CHoCH occurred after liquidity tap at 4,011, but not enough to shift higher timeframe bias.
• RSI and MACD turning mildly bullish —early recovery anticipation, but only corrective unless key levels flip.
⸻
✨ Fibonacci Golden Zone
Recent impulse leg: High 4,125 → Low 4,011
🔹 38.2% Fib = 4,037
🔹 50% Fib = 4,048
🔹 61.8% Fib = 4,060
✅ Golden Zone = 4,037–4,060, aligning with EMA resistance and prior sell rejection zone.
➡ This is the preferred sell zone if price retraces during the US session.
⸻
🎯 High Probability Scenarios
✅ Bearish Continuation Setup (Preferred)
📍 Sell Zone: 4,037–4,060 (Golden Zone / EMA rejection)
✅ Trigger: Bearish engulfing / rejection wick from zone
🎯 Targets → 4,020 → 4,011 → 4,004 → 3,980
🛑 SL above 4,070
📉 Breakout Sell (Momentum play)
📍 Sell below 4,004 (Break & Retest)
🎯 Targets → 3,980 → 3,960 → 3,940
🛑 SL above 4,020
🟢 Bullish Countertrend Setup (Low probability unless reversal pattern appears)
📍 Buy at 4,004–4,011 (only with strong bullish engulfing + MACD shift)
🎯 Targets → 4,037 → 4,060
🛑 SL below 3,995
⚠ Bullish Breakout Buy (Only if structure flips)
📍 Buy above 4,070 (Break & Retest + H1 structure shift)
🎯 Targets → 4,095 → 4,114
🛑 SL below 4,060
⸻
📅 Fundamental Outlook – US Session
• US session may bring increased volatility, especially around labor market sentiment or Fed expectations.
• DXY remains firm, maintaining pressure on gold.
• If yields climb further, downside continuation is favored.
• If DXY retraces, a relief bounce into Golden Zone may occur before next sell wave.
⸻
⚠ Key Levels to Watch
Type Level Description
Resistance 4,037 / 4,048 Fib 38.2%–50%
Resistance 4,060 Fib 61.8% / EMA confluence
Resistance 4,070 / 4,114 Full structure invalidation
Support 4,011 Minor liquidity bounce
Support 4,004 Key psychological support
Support 3,980 Breakdown target
⸻
✅ Summary
Gold is in a bearish continuation phase, with price consolidating near support before the next move. The Golden Zone at 4,037–4,060 is crucial — rejection here favors selling back into lows. A clean break below 4,004 triggers further downside. Only a strong reclaim above 4,070 would shift sentiment toward bullish recovery.
Session Bias: Bearish – favor selling rallies.
Break Confirmation:
• ✅ Sell below 4,004
• ⚠ Buy only above 4,070
Golden Zone: 4,037 – 4,060

XAUUSD is going downGold (XAUUSD) is showing signs of potential downside continuation after a sharp rejection from recent highs. The daily candle formed a long upper wick and closed below the midline of the green band — indicating profit-taking and emerging selling pressure.
Bearish Influences
Rejection Candle: Strong upper wick signals sellers defending resistance near the 4,180–4,200 zone.
Loss of Momentum: Price slipped below the short-term support band, suggesting weakening bullish control.
EMA / Structure Confluence: The current pullback aligns with the lower trendline slope and prior breakout structure — a likely retracement phase forming.
🎯 Fibonacci Bearish Targets
If price fails to reclaim the 4,180 level and bearish momentum persists, look for these downside targets:
Target 1 (0.382 Fib) → $4,047 – $4,050
Minor support and initial retracement level.
Target 2 (0.618 Fib) → $3,943 – $3,950
Key Fibonacci confluence and previous structure support zone.
Target 3 (1.000 Fib) → $3,814 – $3,820
Full retracement target aligning with the lower green volatility band — potential swing low zone.

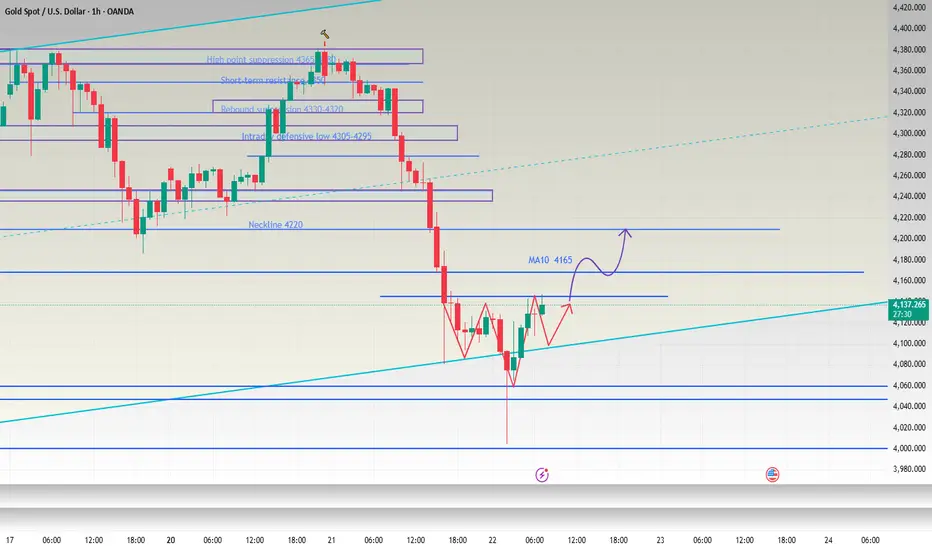
Look for a volatile upward correction of 4200-4220Good morning, bros. Although the market did not provide us with suitable trading opportunities last night, this did not prevent the market from confirming Allen's advanced trading vision. Even if the long orders at 4060-4050 were stopped out, the gold price still fell back to around 4000 as expected. Continuing to go long can not only turn losses into profits in one fell swoop, but also ensure substantial profits. how is it? Although we were unable to participate in this transaction, the final trend and results always prove the high accuracy of Allen's advanced trading vision and strategic analysis.
As the candle chart closed with a long lower shadow that was nearly twice the length of the body, the short-term bottom was found near 4000. Therefore, I believe that gold may be in a state of volatile upward repair today. After a rapid decline and rebound this morning, the current price is once again around 4120-4130. Judging from the hourly chart, there is a rudimentary form of a head and shoulders bottom pattern in the short term. If the gold price retreats again, thus prompting the formation of a head and shoulders bottom pattern, then when the gold price falls back to around 4105-4095, we can also try to go long on gold with a light position. If gold continues to rise, we will pay attention to the performance of 4160-4170 above, which is both a short-term resistance and the daily MA10 moving average. If the bulls want to return to the market, they must first stand firm on the MA10 moving average to have greater hope. Therefore, this resistance range is also the focus of our short-term attention. Once it stabilizes above the MA10 moving average, gold will be expected to rebound to 4200-4220.
OANDA:XAUUSD
Gold 1979 vs 2025 — When History Whispers and Markets Listen
🌕 1. The Echo of 1979
In 1979, the world watched Gold do the impossible. The metal surged from $226 to over $850 per ounce in less than a year, a 275% explosion that turned fear into fortune.
The triggers were seismic.
🇮🇷 The Iranian Revolution disrupted global oil flows.
🏛️ The U.S. Embassy hostage crisis fueled geopolitical panic.
⚔️ The Soviet invasion of Afghanistan reignited Cold War fears.
💸 And double-digit inflation in the U.S. shredded faith in the dollar.
By early 1980, panic replaced logic. Every newspaper screamed, “Buy Gold before it’s too late!” Then came Paul Volcker’s shock therapy as interest rates jumped above 15% and COMEX doubled margin requirements. Within eight weeks, Gold fell more than 40%, marking the end of one of the most dramatic speculative manias in modern history.
🔁 2. Fast-Forward to 2025: The Parallels Are Uncanny
The world of 2025 looks hauntingly similar.
🕰️ 1979 🔮 2025
Iranian Revolution and Cold War tensions Gaza war, U.S.–China decoupling, and regional instability
Oil shock and inflation Energy disruptions and persistent post-pandemic inflation
Dollar under pressure Record U.S. debt and fiscal erosion
Panic buying of Gold Central bank accumulation and retail FOMO
Fed under Volcker turns hawkish Fed under Powell trapped between cuts and control
By late August 2025, gold sat quietly near $3,415, then erupted into a seven-week vertical rally above $4,300, a mirror image of 1979’s euphoric climb. But just like back then, euphoria was the prelude to exhaustion.
⚠️ 3. The Anatomy of the Current Crash
On October 17, 2025, Gold plunged $250 in one day, a shocking 5–6% drop that broke its parabolic structure and sent fear rippling across markets.
What triggered it?
🏦 A hawkish shift in the Federal Reserve’s language as officials hinted rate cuts might be delayed.
💰 Real yields surged, breaking the inverse correlation that had fueled gold’s climb.
🏛️ Institutional profit-taking hit record levels, confirmed by rising COMEX open interest and volume.
🗞️ Sentiment flipped overnight as headlines shifted from “Gold to $5000” to “Gold crashes $250.”
The move marked the first true break of structure (CHoCH) since the rally began, historically the signal that smart money is quietly exiting.
🔍 4. Lessons from 1980 — The Signs of a Top
Before gold crashed in 1980, five clear warning signs appeared.
⚙️ 1979–1980 Signal 💡 2025 Equivalent 🧭 Status
Fed turns hawkish Powell signals “pause / higher for longer” ⚠️ Emerging
Rising bond yields vs. flat Gold Real yield divergence ✅ Confirmed
Parabolic candles Daily range above $100 ✅ Seen
Media frenzy “Gold to $5000” hype ✅ Seen
Margin hikes and record OI Record COMEX participation ⚠️ Rising
Four out of five signals are already flashing. History teaches that when everyone believes Gold can only rise, it’s often about to fall.
🧭 5. What Smart Traders Should Do Now
🟡 Phase 1 – Immediate Protection (Next 24 Hours)
If you’re long, secure 50–75% of gains and protect above $3,950.
If you’re short, trail stops to $4,200 and look for targets at $3,950 → $3,800 → $3,600.
If you’re flat, stay patient and wait for at least two daily candles of stabilization before acting.
🟠 Phase 2 – Stabilization (Next 3–5 Days)
Watch for:
🕯️ Long lower wicks on daily candles show buyer absorption.
📉 Shrinking COMEX volume indicates exhaustion of sellers.
📊 Flat or falling real yields confirming support.
🔵 Phase 3 – Re-evaluation (Next 1–2 Weeks)
If gold reclaims $4,000+ with strength and Fed tone softens, a controlled re-rally may begin. If Gold stays below $3,800, the correction likely extends toward $3,500, the same 30–40% retracement seen in 1980.
🧘♀️ 6. Beyond the Chart — Discipline Over Drama
When a $250 candle appears, instincts scream, “Do something!” But professionals know the truth: reaction destroys capital, observation preserves it. The coming days are not about prediction but about posture. Stay liquid, track sentiment, watch real yields, and remember that even in 1980, Gold’s crash didn’t end its story — it simply reset the cycle for the next era of accumulation.
✨ History doesn’t repeat, but it rhymes. In 1979, Gold taught us that fear creates bubbles. In 2025, it’s reminding us that even truth needs a pullback before it shines again.
If this article helped you today and brought you more clarity:
Drop a 🚀 and follow us✅ for more trading ideas and trading psychology. Thank you.

Gold Trade Set Up Oct 22 2025Gold is coming off a huge down move and is currently ranging on the 15m, so i want to see either a close above 15m high followed by a 5m SSL sweep to target BSL and supply areas or if price fails to close higher and pushes down creating a new 15m low, i will look for sells to lower SSL levels

Gold: The M-top pattern indicates a downward risk📈Gold’s situation today is quite complex, marked by sharp volatility. Looking at the price trend, after a rare steep drop the previous night, the Gold continued to slide following today’s opening, touching a low of 4004.5. It then staged a short-term rebound of over $100, fluctuating around 4100 and peaking at 4161.It then continued to decline.
📝In terms of influencing factors:
The cooling of safe-haven sentiment is one of the key reasons for Gold’s decline. Europe’s support for Russia-Ukraine ceasefire negotiations, the expected resolution of the U.S. government shutdown crisis, and the easing of Sino-U.S. trade tensions have all led to a significant drop in market demand for safe-haven assets.
📈Gold had risen too sharply in the earlier stage, fueling strong sentiment among investors to take profits at high levels. A large number of sell orders pushed its price down sharply.
Additionally, the strengthening of the U.S. dollar during the day has also exerted certain pressure on gold prices.
📝From a technical perspective:
The Gold closed with a long bearish candlestick on the daily chart, accompanied by a simple M-top formation. This indicates the risk of the market continuing to move downward. The upper resistance zone is between 4150 and 4180, the key lower support level is at the 4000 integer mark, and further downside support lies between 3900 and 3904.
💎Trading Strategy:
Buy 4075 - 4085
SL 4060
TP 4115 - 4125 - 4135
Sell 4150 - 4160
SL 4175
TP 4085 - 4100 - 4115
Daily-updated accurate signals are at your disposal. If you run into any problems while trading, these signals serve as a reliable reference—don’t hesitate to use them! I truly hope they bring you significant assistance

$4,381 WAS THE FAKE TOP? Gold -5.5%: MSS Confirms SELL!XAU/USD In-Depth Analysis: Historic Shock and Structure-Based Selling Opportunity!
1. Fundamental Shock Analysis
Gold's massive 5.5% plunge from its record high of $4,381 was a large-scale profit-taking action following a blistering 60% year-to-date rally. This move was fueled by:
USD Strength: The strengthening US Dollar reduced Gold's appeal.
Market Sentiment: A shift into Risk-On mode, diminishing safe-haven demand.
The Essence: This was a huge Liquidity Sweep, designed to wash out weaker hands before Gold decides its next major trend.
2. Technical Analysis (MSS & Execution)
The price structure has delivered a decisive message: The trend has changed!
MSS Confirmed (Market Structure Shift): The break of the bullish structure occurred at $4,254.549. This level is now a highly critical Supply Zone, acting as the "boundary" for the bears.
Demand Reaction: Gold is currently attempting to hold the Order Block (OB) at $4,077.
Preferred Strategy: SELL based on the confirmed MSS.
Optimal SELL Zone: Wait for a retracement back to the Supply Zone $4,254.549 (Ideal limit entry).
Target (TP): Successive targets are $4,008 (The psychological $4k mark) and the strong support area at $3,944 - $3,904.
Stop Loss (SL): Place above the high at $4,260 (Protecting the MSS point).
Conclusion: Don't be fooled by the bounce. $4,254.549 is the golden entry point for a short trade following the new market structure.
#GOLD #XAUUSD #MSS #Liquidity #SELLSignal #SmartMoneyConcept

XAU/USD 22 October 2025 Intraday AnalysisH4 Analysis:
-> Swing: Bullish.
-> Internal: Bullish.
Analysis and bias remains the same as analysis dated 20 October 2025.
Price has printed as per previous intraday expectation by printing a bearish CHoCH which indicates, but not confirms, bullish pullback phase initiation.
Price is currently trading within an established internal range, however, I will continue to monitor price with regards to depth of pullback.
Intraday expectation:
Price to continue bearish, react at either discount of 50% internal EQ, or H4 supply zone before targeting weak internal high priced at 4,380. 990.
Note:
The Federal Reserve’s sustained dovish stance, coupled with ongoing geopolitical uncertainties, is likely to prolong heightened volatility in the gold market. Given this elevated risk environment, traders should exercise caution and recalibrate risk management strategies to navigate potential price fluctuations effectively.
Additionally, gold pricing remains sensitive to broader macroeconomic developments, including policy decisions under President Trump. Shifts in geopolitical strategy and economic directives could further amplify uncertainty, contributing to market repricing dynamics.
H4 Chart:
M15 Analysis:
-> Swing: Bullish.
-> Internal: Bearish.
Price has printed according to my analysis dated 20 October 2025 where I mention that price is to continue bullish, react at either premium of 50% internal EQ, or M15 demand zone, before targeting weak internal low priced at 4,185.910.
Price has printed a bearish iBOS and subsequently a bullish CHoCH to indicate, but not confirm bullish pullback phase initiation.
Price is now trading within an established internal range.
Intraday expectation:
Price to react at either premium of 50% internal EQ, or M15 demand zone, before targeting weak internal low priced at 4,004.280.
Note:
Gold remains highly volatile amid the Federal Reserve's continued dovish stance, persistent and escalating geopolitical uncertainties. Traders should implement robust risk management strategies and remain vigilant, as price swings may become more pronounced in this elevated volatility environment.
Additionally, President Trump’s tariff announcements, particularly against China, are expected to further amplify market turbulence, potentially triggering sharp price fluctuations and whipsaws.
M15 Chart:

ElDoradoFx PREMIUM – GOLD ANALYSIS (22/10/2025, LONDON SESSION)Gold (XAUUSD) is trading around 4,157, rebounding aggressively from the previous sell-off low near 4,004. Buyers have stepped in with conviction, reclaiming short-term structure and driving price back above key intraday levels. London opens with bullish momentum in play, but price is now approaching early resistance zones, where the next directional decision is likely to form.
⸻
🔍 Technical Outlook
Daily Chart (D1)
• Previous daily candle shows a strong lower wick recovery after heavy bearish liquidation.
• Price remains above both 20EMA and 50EMA, suggesting the broader bullish structure is still intact.
• RSI has cooled from overbought but now points upward, indicating renewed bullish pressure.
• MACD remains in positive territory, confirming long-term buyers are still active.
Bias: Bullish corrective rebound, awaiting confirmation for continuation.
⸻
1H Chart (H1)
• Clean bullish CHoCH formed after rejection from 4,004.
• Price is approaching dynamic resistance from 200 EMA (around 4,170).
• RSI at ~46–50, suggesting room for continuation before overbought conditions.
• If price breaks and holds above 4,170, next bullish leg may target 4,200–4,225 liquidity.
Intraday Bias: Bullish toward premium zones unless rejected at 4,170.
⸻
15M Chart (M15)
• Multiple higher lows after bounce confirm controlled bullish momentum.
• RSI around 60, reflecting moderate bullish strength.
• MACD expanding upward → intraday momentum supports continuation into resistance.
• Key minor resistance near 4,160–4,170 may trigger a pullback or consolidation.
Short-term View: In bullish leg, approaching decision zone.
⸻
5M Chart (M5)
• Structure is trending upward, with each dip being bought.
• MACD strongly bullish; histogram rising.
• Any pullback into 4,140–4,135 area may provide minor intraday buy reaction before a deeper decision.
⸻
✨ Fibonacci Golden Zone
Recent impulse leg: Low 4,004 → High 4,160 (current swing)
🔹 38.2% Fib = 4,115
🔹 50% Fib = 4,082
🔹 61.8% Fib = 4,050
✅ Golden Zone = 4,115–4,050, aligning with previous breakout structure and short-term EMA confluence.
➡ If price retraces to this zone and holds, bullish continuation setups may activate.
⸻
🎯 High Probability Scenarios
✅ Bullish Continuation Setup (Preferred if pullback holds)
📍 Buy Zone: 4,115–4,082 (Golden Zone reaction)
✅ Trigger: Bullish engulfing or strong rejection wick
🎯 Targets → 4,150 → 4,170 → 4,200 → 4,225
🛑 SL below 4,050
✅ Break & Retest Buy Setup (Aggressive Momentum Entry)
📍 Buy above 4,170 (Break of EMA confluence)
🎯 Targets → 4,200 → 4,225 → 4,254
🛑 SL below 4,150
⚠️ Bearish Correction Setup (If rejection occurs at premium zone)
📍 Sell if strong rejection at 4,170–4,200
🎯 Targets → 4,140 → 4,115 → 4,082
🛑 SL above 4,209
🔻 Sell Breakout (If bearish momentum resumes)
📍 Sell below 4,050 (Break & Retest)
🎯 Targets → 4,030 → 4,004 → 3,980
🛑 SL above 4,082
⸻
📅 Fundamental Outlook – London Session
• No major European data early session; price action driven by technical flows.
• Focus remains on US data later (unemployment, Fed sentiment).
• DXY cooling slightly after yesterday’s strength, offering support to gold pullback recovery.
• US yields remain elevated — could cap upside unless risk-off intensifies.
⸻
⚠️ Key Levels to Watch
Type Level Description
Resistance 4,170 H1 200 EMA / decision point
Resistance 4,200–4,225 Liquidity target zone
Resistance 4,254 Previous key supply
Support 4,140 Minor intraday support
Support 4,115–4,082 Fibonacci Golden Zone
Support 4,050 Final retracement line
⸻
✅ Summary
Gold is staging a strong recovery rally and remains bullish in early London momentum. A controlled retracement into the Golden Zone (4,115–4,082) would provide an ideal continuation buy opportunity toward 4,170–4,200–4,225. A confirmed break above 4,170 validates continued upside. A strong rejection at 4,170–4,200 may trigger a corrective dip back into the Fib zone.
Session Bias: Bullish, with continuation favored on dips.
Break Confirmation:
• ✅ Buy above 4,170
• ⚠️ Sell below 4,050
Golden Zone: 4,115 – 4,082 – 4,050
⸻
🥇 ElDoradoFx PREMIUM 2.0 – PERFORMANCE 21/10/2025 🥇
📊 GOLD TRADE RESULTS:
🔻 SELL +210 pips
🟢 BUY LIMIT +20 pips
❌ BUY –40 pips (SL)
🟢 BUY +70 pips
🟢 BUY +100 pips
🔻 SELL +210 pips
🟢 BUY +270 pips
---
💰 TOTAL GOLD PIPS WON: ✅ +840 pips
📈 RESULT: 7 Signals → 6 Wins | 1 SL
🎯 ACCURACY: 86%
---
🔥 Solid upward momentum and precision in reversals — swing continuation played out beautifully 📈💎
👏 Congratulations if you profited! ✅✅✅🚀🚀🚀

XAUUSD – Sharp 5% Drop as Traders Take Profit Ahead of US CPIMarket Context:
Gold (XAU/USD) slumped over 5.5% on Tuesday, marking its largest daily decline in months as traders took profits ahead of the upcoming US CPI data (October 24).
The US Dollar Index (DXY) rebounded 0.36% to 98.94, making gold more expensive for foreign buyers.
This correction also coincides with renewed optimism over potential easing of US–China trade tensions, after President Trump confirmed plans to meet Chinese leader Xi Jinping next week.
While this sharp move caught many traders off guard, it appears to be a healthy correction within a broader bullish structure, as investors remain cautious before major data and the upcoming Fed policy meeting next week.
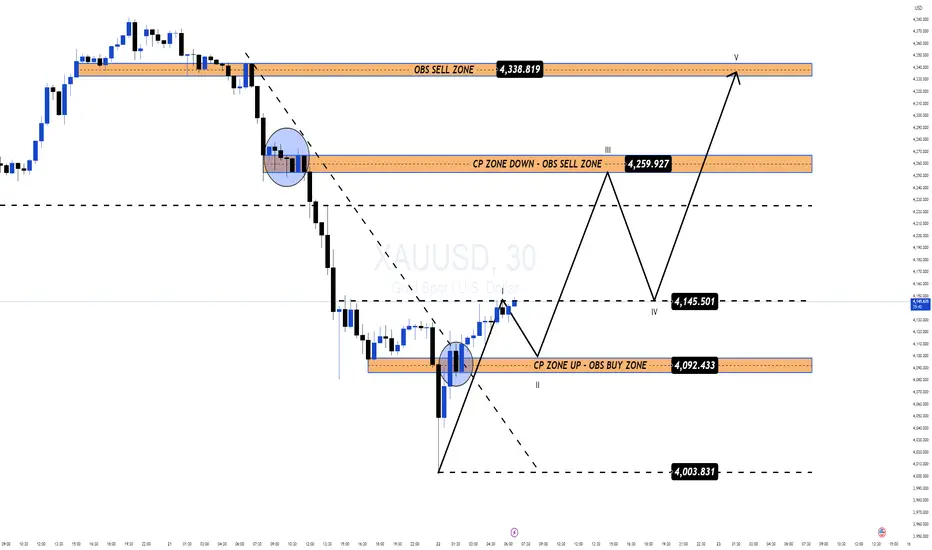
Technical Outlook (M30):
After the heavy selloff from the 4,375 high, gold found near-term support around 4,003 – 4,010, forming a potential accumulation base.
The pair now trades near 4,150, showing early signs of recovery toward key confluence zones.
Key Technical Levels:
OBS Sell Zone: 4,338 – 4,340
CP Zone Down / OBS Sell Zone: 4,259 – 4,260
CP Zone Up / OBS Buy Zone: 4,092 – 4,094
Deep Buy Zone: 4,003 – 4,008
The current structure outlines a 5-wave projection, where price may complete Wave II near 4,092, then advance toward Wave III at 4,259, followed by a correction (Wave IV) and another push toward Wave V near 4,338.
Trading Plan:
🔹 BUY ZONE#1 (Short-Term Recovery)
Entry: 4,092 – 4,094
Stop Loss: 4,080
Take Profit: 4,145 → 4,259 → 4,338
🔹 BUY ZONE #2 (Liquidity Sweep Scenario)
Entry: 4,003 – 4,008
Stop Loss: 3,990
Take Profit: 4,090 → 4,259
🔹 SELL ZONE (Countertrend Reaction)
Entry: 4,259 – 4,260
Stop Loss: 4,272
Take Profit: 4,145 → 4,092
Summary:
The recent 5% correction is viewed as a profit-taking phase ahead of CPI data, not a structural breakdown.
Gold is expected to stabilise above 4,092, with buyers likely stepping in near the OBS Buy Zone.
Focus remains on 4,259 for a short-term reaction and 4,338 as the next potential liquidity target if momentum continues.
📊 What’s your view — is this just a healthy retracement before CPI, or the start of a deeper shift?
👉 Follow MMFLOW TRADING for daily institutional-grade setups and smart money structure updates.

Today's trading strategy for gold is hoped to be helpful to you.Core Bullish Logic for Gold: Why It Deserves Long-Term Attention
1.Support from Policy and Monetary Environment: The market generally expects the Federal Reserve to continue cutting interest rates in the future. This will reduce the cost of holding gold, and at the same time, the attractiveness of the U.S. dollar is declining—both of which are favorable for gold. In addition, the U.S. government "shutdown" is still ongoing, and key economic data cannot be released on time. People are more uncertain about the economic trend, so they will be more willing to buy gold as a safe - haven asset.
1.Long-Term Demand Is Secured: Central banks around the world are continuing to buy gold. The People's Bank of China has increased its gold holdings for 11 consecutive months. Such large - scale long - term purchases can provide a floor for gold prices. Meanwhile, ordinary investors are also increasing their positions through methods such as ETFs. The inflow volume of global gold ETFs in September is almost close to the level during the Russia - Ukraine conflict, which shows that the market has a high recognition of gold.
Today's Gold Trading Strategy
xauusd @ buy:4120-4130
pt:4150-4160
sl:4100

XAUUSD Retracement bullish moveAfter a strong bearish impulse, XAUUSD found support around the lower boundary of the green Fibonacci-based volatility band (approx. $4,093–$4,100). Price shows a potential reversal candle forming just below the midline of the band, suggesting buying pressure.
🎯 Fibonacci Bullish Targets
Target 1 (0.382 Fib) → $4,158 – $4,160
First reaction zone, where price may test the underside of the blue band.
Target 2 (0.618 Fib) → $4,202 – $4,210
Key resistance area and equilibrium zone of the previous structure.
Target 3 (1.000 Fib / Full retracement) → $4,245 – $4,255
Strong supply zone near the upper red band; ideal swing target if momentum continues.

technical analysis for XAU/USD (Gold) based on your chart:Pair: Gold (XAU/USD)
Chart Summary
Current Price: Around $4,140
Trend Lines: A descending trade line shows the overall short-term bearish trend.
Support Zone: Clearly marked between $4,080 – $4,120 (“SUPPORT BUY ZONE”).
Target: The upside target is labeled near $4,383.
Technical Outlook
🔹 Support Zone Reaction
Price recently dipped into the support buy zone, forming a potential bullish reversal wick.
This area is acting as a strong demand zone, attracting buyers around $4,100.
🔹 Downtrend Channel
The pair remains under a downward-sloping trade line, suggesting the short-term market bias is still bearish.
However, a breakout above this trendline could trigger bullish continuation toward the $4,383 target.
🔹 Short-Term Scenario
Bullish Case (Primary Plan):
If gold holds above the support zone ($4,080–$4,120) and breaks the trendline resistance (~$4,200),
→ next target area: $4,300–$4,383.
Confirmation comes with a clear candle close above $4,200.
Bearish Case (Alternative Plan):
If price fails to break the descending trade line and drops below $4,080,
→ possible continuation toward $4,040 – $4,000.
Key Levels
Type Level (USD) Description
🎯 Target 4,383 Major resistance / profit zone
⚔️ Resistance 4,200 Descending trendline zone
🛒 Support Zone 4,080–4,120 Demand / Buy zone
❌ Invalid Below 4,080 Break below = bearish continuation
Summary
📈 Gold (XAU/USD) is currently retesting its support zone, showing early signs of a bullish rebound.
A confirmed breakout above the trendline could lead to a rally toward $4,380.
However, losing support below $4,080 would invalidate the bullish setup and reintroduce downside risk. EURONEXT:IE6X2025 EURONEXT:BE8Z2025 EURONEXT:BXF1! EURONEXT:CU6X2025 EURONEXT:KB6X2025 EURONEXT:PJ6X2025 EURONEXT:PJ8Z2025 EURONEXT:UM6X2025 EURONEXT:UM8Z2025 EURONEXT:AB6X2025 EURONEXT:AB7X2025

XAUUSD – Sharp 5% Drop as Traders Take Profit Ahead of US CPIMarket Context:
Gold (XAU/USD) slumped over 5.5% on Tuesday, marking its largest daily decline in months as traders took profits ahead of the upcoming US CPI data (October 24).
The US Dollar Index (DXY) rebounded 0.36% to 98.94, making gold more expensive for foreign buyers.
This correction also coincides with renewed optimism over potential easing of US–China trade tensions, after President Trump confirmed plans to meet Chinese leader Xi Jinping next week.
While this sharp move caught many traders off guard, it appears to be a healthy correction within a broader bullish structure, as investors remain cautious before major data and the upcoming Fed policy meeting next week.
Technical Outlook (M30):
After the heavy selloff from the 4,375 high, gold found near-term support around 4,003 – 4,010, forming a potential accumulation base.
The pair now trades near 4,150, showing early signs of recovery toward key confluence zones.
Key Technical Levels:
OBS Sell Zone: 4,338 – 4,340
CP Zone Down / OBS Sell Zone: 4,259 – 4,260
CP Zone Up / OBS Buy Zone: 4,092 – 4,094
Deep Buy Zone: 4,003 – 4,008
The current structure outlines a 5-wave projection, where price may complete Wave II near 4,092, then advance toward Wave III at 4,259, followed by a correction (Wave IV) and another push toward Wave V near 4,338.
Trading Plan:
🔹 BUY ZONE#1 (Short-Term Recovery)
Entry: 4,092 – 4,094
Stop Loss: 4,080
Take Profit: 4,145 → 4,259 → 4,338
🔹 BUY ZONE #2 (Liquidity Sweep Scenario)
Entry: 4,003 – 4,008
Stop Loss: 3,990
Take Profit: 4,090 → 4,259
🔹 SELL ZONE (Countertrend Reaction)
Entry: 4,259 – 4,260
Stop Loss: 4,272
Take Profit: 4,145 → 4,092
Summary:
The recent 5% correction is viewed as a profit-taking phase ahead of CPI data, not a structural breakdown.
Gold is expected to stabilise above 4,092, with buyers likely stepping in near the OBS Buy Zone.
Focus remains on 4,259 for a short-term reaction and 4,338 as the next potential liquidity target if momentum continues.
📊 What’s your view — is this just a healthy retracement before CPI, or the start of a deeper shift?
👉 Follow MMFLOW TRADING for daily institutional-grade setups and smart money structure updates.
Gold Buy Long PostionA Gold (XAU/USD) Buy Long Position involves purchasing the XAU/USD pair with the expectation that the price of Gold (XAU) will rise relative to the US Dollar (USD) over time.1 This is a common strategy for position traders and swing traders.Gold Buy Long Position (XAU/USD) Short NoteCurrent XAU/USD Price ContextApproximate XAU/USD Price: The Gold price is highly dynamic, but recent market data shows it trading around the $4,150 - $4,250 per ounce range (as of the recent search results from October 2025). This price point is near historical highs, indicating a strong long-term bullish trend that is currently undergoing some short-term correction/consolidation.Strategy Summary for Long EntryFundamental Driver (Why Buy): Gold is typically bought as a safe-haven asset during times of economic or geopolitical uncertainty (e.g., wars, high inflation, recession fears).2 A sustained weakening of the US Dollar (USD) or a dovish outlook from the US Federal Reserve (Fed) (e.g., expected interest rate cuts) is also a strong bullish signal for XAU/USD.Technical Trigger (When to Buy):Support/Retracement: Look for the price to pull back to a key historical Support level or a major Fibonacci Retracement level (like 3$50\%$ or 4$61.8\%$) within an existing uptrend.5Confirmation: Enter the trade when a strong bullish candle (e.g., a Pin Bar or Bullish Engulfing) forms at that key support level, confirming buyer defense.Trend Following: Wait for a breakout above a recent minor resistance level (or consolidation range) to confirm the continuation of the main uptrend.6Risk Management:Stop-Loss (SL): Place the Stop-Loss below the confirmation support level or the most recent swing low to protect against an invalidation of the bullish structure.7Take-Profit (TP): Target the most recent swing high or use Fibonacci Extension levels to project higher targets.

Gold – 24 Hours of Chaos: From 4400 to 4000The last 24 hours in Gold trading were absolutely insane. After retesting the 4400 zone all-time high last night, XAUUSD literally collapsed, dropping straight to the 4000 zone in just one day — a 10% move that’s unheard of for gold (at least I haven't seen).
1️⃣ Technical Picture
Once the price broke back below 4200, it confirmed a double top formation, and the selloff accelerated dramatically toward its measured target around 4000 — a level also supported by the ascending trendline that started in late August.
2️⃣ Current Context
At the time of writing, gold already rebounded nearly 1300 pips from the low, which means there’s no attractive level to enter long right now, even though the recovery might continue in the short term.
3️⃣ Key Levels to Watch
• Resistance: 4200 zone – now turned into a major resistance. If the price revisits this level, I’ll be looking for short setups, ideally on intraday spikes.
• Support: 4000 zone – if the price dips again before testing resistance, it could offer long opportunities from this confluence area.
4️⃣ Trading Plan
In short, we’re in a wide range between 4000 and 4200, both levels offering potential trades but in opposite directions. For now, I’ll stay patient and wait for price to get closer to one of these extremes before taking action.
⚠️ Final Note
Volatility is off the charts, so if you decide to trade XAUUSD these days, adjust your stop losses and targets accordingly. This is not the time for tight stops, is time for patience, and flexibility. 🚀

Gold Price Outlook – Trade Setup (XAU/USD)📊 Technical Structure
Gold tumbled below $4,100, finding temporary support around $4,085–$4,093.
The chart shows a descending trendline, keeping short-term momentum bearish.
Immediate resistance lies at $4,142–$4,151, while the support zone is at $4,085–$4,093.
A break above the trendline could trigger a rebound toward resistance, but failure may open the door to deeper losses.
📌 Trade Setup
Entry: $4,093
Stop Loss: $4,080 (below support zone)
Take Profit: $4,150 (resistance retest)
Risk-to-Reward (R:R): ≈ 1 : 4.45
🌍 Macro Background
Gold is pressured by easing US-China trade tensions as both sides prepare for potential tariff negotiations ahead of November 1. This weakens safe-haven flows. At the same time, the steep profit-taking after a nine-week rally adds to selling pressure.
However, risks from the prolonged US government shutdown, concerns over global debt sustainability, and expectations of further Fed rate cuts (October and December) continue to support the medium-term bullish case for gold.
Markets now await US CPI data on Friday (YoY expected at 3.1%), which will be a crucial trigger for USD and gold direction.
🔑 Key Technical Levels
Resistance: $4,142 / $4,151
Support: $4,093 / $4,085
Upside Target (breakout): $4,150–$4,160
Downside Target (failure): $4,070 / $4,050
📋 Trade Summary
Gold faces strong downside momentum but holds above the $4,085 support zone. Short-term strategy favours a rebound trade on a breakout above the descending trendline, targeting $4,150. However, if support fails, the decline could accelerate toward $4,070–$4,050.
⚠️ Disclaimer
This analysis is for reference only and does not constitute trading advice. Trading involves significant risk, and proper risk management is essential.

Today's trading strategy for gold is hoped to be helpful to you.The core logic: The key reasons behind the price changes
1.Long - term support remains: This year, the price of gold has risen from $3000 all the way to an all - time high of over $4380. Several major factors are at play. On the one hand, the Federal Reserve began to cut interest rates in September and may continue to do so in the future. The cost of holding gold has become lower, making everyone more willing to buy. On the other hand, the continuous government shutdown in the United States, coupled with the unresolved tense situations in the Middle East, Eurasia and other places, has made the market's concerns about the economy more prominent, thus highlighting the safe - haven value of gold. Another important support is that central banks around the world have been buying gold. Many countries, such as China and Poland, have been increasing their holdings. These long - term purchases can underpin the price of gold and reduce the possibility of a sharp decline.
2.Reasons for short - term fluctuations: Recently, the price of gold has dropped from around $4380 to $4090. Mainly, it is because the previous increase was too fast, and some investors sold to take profits, bringing selling pressure. In addition, there is news that the U.S. government shutdown may end this week, which has temporarily reduced part of the safe - haven demand and also led to a price decline. However, from the perspective of the trend, this correction is more like a short - term rest rather than a trend reversal.
Today's Gold Trading Strategy
xauusd@buy:4080-4100
pt:4130-4150
sl:4030

GOLD (XAU/USD) Game Plan GOLD (XAU/USD) Game Plan
📊 Market Sentiment
Market sentiment for GOLD remains extremely bullish, driven primarily by central bank accumulation.
Since 2023, global central banks — led by China — have been buying gold aggressively, creating a long-term demand base.
With the FED preparing to initiate QE while inflation remains elevated, risk assets like GOLD are expected to outperform as USD (DXY) weakens.
This macro setup builds a powerful bullish narrative that continues to favor long exposure on gold.
📈 Technical Analysis
GOLD has rallied for nine consecutive weeks since mid-August, reaching overbought RSI levels.
Currently, price is showing signs of retracement and consolidation, suggesting an accumulation phase may form before the next impulsive move.
The Weekly Fair Value Gap (FVG) around $4010, just below the HTF bullish trendline, acts as a critical support area where a potential deviation and bounce may occur.
📌 Game Plan
I expect GOLD to retrace toward the HTF trendline and Weekly FVG ($4017).
A deviation and bounce from this zone could trigger a new bullish leg.
However, I anticipate 1–2 weeks of accumulation before continuation.
💬 Like, follow, and comment if this breakdown supports your trading! More setups and market insights coming soon — stay connected!
⚠️ Disclaimer: This content is for informational and educational purposes only and does not constitute financial, investment, or trading advice. Always DYOR before making any financial decisions.

ElDoradoFx PREMIUM – GOLD ANALYSIS (22/10/2025, ASIA SESSION)Gold (XAUUSD) is currently trading around 4,125, attempting a minor recovery after a strong bearish breakdown during the US session. Price found near-term liquidity around 4,106–4,100, where a short-term bounce is unfolding. Despite this pullback attempt, the overall structure remains bearish unless key resistance levels are reclaimed.
⸻
🔍 Technical Outlook
Daily Chart (D1)
• Strong bearish candle formed after rejection from 4,381.
• Price still above 20EMA and well above 50EMA, confirming a corrective move within a broader bullish trend.
• RSI cooling from overbought; now around mid-level, room for either further correction or bounce.
• MACD still positive but histogram weakening, suggesting potential retracement or pause.
Bias: Corrective bearish inside macro bullish trend.
⸻
1H Chart (H1)
• Clear bearish shift with BOS confirmed below 4,254 and 4,229.
• Rejection from 20EMA and 50EMA above (4,170–4,249) confirms intraday bearish bias.
• RSI recovering from oversold (26→38) indicating a potential pullback leg.
• If gold climbs into 4,160–4,198 zone and rejects, bearish continuation likely.
Intraday Bias: Bearish until H1 closes above 4,200–4,210.
⸻
15M Chart (M15)
• Minor CHoCH formed after bounce at 4,106, with price entering a corrective channel.
• RSI around 55 → short-term recovery phase.
• MACD histogram green but still shallow → possible retracement only.
• Price approaching first resistance around 4,140–4,150.
Short-term View: Pullback phase inside bearish structure.
⸻
5M Chart (M5)
• Series of higher lows forming → bullish momentum attempt.
• MACD positive with expanding green bars.
• RSI above 55 suggests buyers in short control, but nearing resistance.
⸻
✨ Fibonacci Golden Zone
Recent impulse: High 4,254 → Low 4,106
🔹 38.2% Fib = 4,160
🔹 50% Fib = 4,180
🔹 61.8% Fib = 4,198
✅ Golden Zone: 4,160 – 4,198
This zone aligns with intraday EMA resistance and H1 supply, making it a key sell area if rejection occurs.
⸻
🎯 High Probability Scenarios
✅ Bearish Continuation Setup (Preferred)
⚠️ Sell in the 4,160–4,198 Golden Zone upon bearish rejection.
🎯 Targets → 4,140 → 4,120 → 4,106 → 4,080
🛑 SL above 4,210
✅ Breakout Sell (Momentum Play)
⚠️ Sell below 4,106 (Break & Retest)
🎯 Targets → 4,080 → 4,060 → 4,040
🛑 SL above 4,120
⸻
🟢 Bullish Countertrend Setup (Lower Probability)
✅ Buy from 4,106–4,100 only if strong bullish engulfing + MACD flip appear.
🎯 Targets → 4,140 → 4,160 → 4,180
🛑 SL below 4,090
🟢 Bullish Breakout Setup (Structure Shift Only)
✅ Buy above 4,200 (Break & Retest)
🎯 Targets → 4,229 → 4,254
🛑 SL below 4,180
⸻
📅 Fundamental Outlook – Asia Session
• No major Asian economic catalysts early session → market may retrace or range.
• Traders likely positioning for NY session after heavy US selling.
• USD Index holding firm; any DXY weakness could extend pullback.
• Focus shifts to US jobless data and Fed sentiment later today.
⸻
⚠ Key Levels to Watch
Type Level Description
Resistance 4,140 / 4,160 First intraday rejection zones
Resistance 4,180 / 4,198 Fibonacci Golden Zone
Support 4,120 Minor intraday support
Support 4,106–4,100 Liquidity shelf
Support 4,080 Deep corrective target
⸻
✅ Summary
Gold is undergoing a corrective bounce within a bearish intraday trend. The Golden Zone (4,160–4,198) is the critical area for potential continuation sells if rejection is confirmed. A failure to clear 4,200 keeps sellers in control. Buyers only gain momentum above 4,200, or at deep retests near 4,106 with bullish confirmation.
🟢 Reversal Buy only if 4,106 holds with strength.
🔻 Main Scenario: Sell rallies from 4,160–4,198 zone.
📉 Break Confirmation: Sell below 4,106.
✨ Golden Zone: 4,160 – 4,198.
⸻
🥇 ElDoradoFx PREMIUM 2.0 – PERFORMANCE 21/10/2025 🥇
📊 GOLD TRADE RESULTS:
🔻 SELL +210 pips
🟢 BUY LIMIT +20 pips
❌ BUY –40 pips (SL)
🟢 BUY +70 pips
🟢 BUY +100 pips
🔻 SELL +210 pips
🟢 BUY +270 pips
---
💰 TOTAL GOLD PIPS WON: ✅ +840 pips
📈 RESULT: 7 Signals → 6 Wins | 1 SL
🎯 ACCURACY: 86%
---
🔥 Solid upward momentum and precision in reversals — swing continuation played out beautifully 📈💎
👏 Congratulations if you profited! ✅✅✅🚀🚀🚀

Accurately grasp every trading opportunity,do you dare to followGold prices fell sharply in the evening due to the news, with a daily drop of nearly $300. Judging from the daily chart, the large real negative line almost swallowed up all the gains last week, and the bears have absolute control over the market.
Since this morning, Allen has been reminding everyone to pay attention to the M-shaped double-top structure and be alert to the possible sharp market correction. Even if you fail to keep up with our trading rhythm, as long as you refer to my ideas and read them carefully, you can at least effectively avoid being washed out by the market.
As gold continues to fall, various voices have appeared in the market. Bros must keep their eyes open when referring to them. After all, not everyone is as brave as Allen in facing mistakes and losses.
As I said, the bears are currently dominating the market. Although the decline has stagnated slightly in the short term, the downward trend has not completely stopped. It will be difficult for the bulls to recover all their lost ground tonight. The current gold price is hovering around 4110. If it continues to fall, you can pay attention to the short-term support of 4060-4050 below. Try to go long with a light position, set a stop loss, and look for support at the 4000 integer mark if it breaks.
OANDA:XAUUSD
