Gold Update – Key Level Respected, Here’s What’s NextGOLD (XAUUSD) Update – Reaction + Next Steps
Price played out exactly as expected from the previous idea. Gold tapped into the key demand zone, grabbed liquidity, and reacted strongly.
🟡 What Happened:
Price tested the
Liquidity lows was taken
Clear rejection with momentum showing (bullish) strength
📌 What I’m Watching Next:
If price holds above , I’ll be looking for continuation into the next psych level 4500..
If price fails to hold, a pullback retest towards is likely before another move
Waiting for a clean break + retest structure before taking a position
🎯 Trading Plan:
No rush entries – waiting for confirmation
Targeting the next PSYCHOLOGICAL LEVEL 4500 once structure is clear
Not financial advice – just how I’m reading gold right now.
Like or comment if you want updates when price taps entry levels ✅
Xauusdupdates

ElDoradoFx PREMIUM – GOLD ANALYSIS (21/10/2025, ASIA SESSION)Gold saw a strong rebound during the US session, rallying from the previous session’s corrective low near 4318 and pushing back toward the key resistance area around 4380–4385. This confirms buyers are still active, but price is currently testing a rejection zone, indicating potential exhaustion near recent highs. The Asia session opens with consolidation after a strong bullish impulse, suggesting either a continuation move if momentum sustains or a healthy pullback opportunity.
⸻
📊 2️⃣ Technical Breakdown
📅 D1 (Daily)
• Structure remains strongly bullish, printing higher highs and higher lows.
• Candle closed bullish but with upper wick rejection near 4381 (previous weak high).
• RSI remains in overbought territory near 80, signalling risk of short-term corrective moves.
⏳ H1
• Price broke above the bearish intraday channel structure and retested 4320–4318 demand zone before impulsing upward.
• Current consolidation sits below 4380–4385 resistance, awaiting liquidity.
• 50 EMA and 200 EMA remain below price, preserving bullish structure, but momentum is slowing.
📉 15M–5M
• Micro consolidation forming below 4380, indicating indecision.
• MACD histogram showing fading buying strength; possible retracement early Asia before continuation.
• Short-term liquidity resting under 4345–4335, aligning with potential retracement area.
⸻
📐3️⃣ Fibonacci Analysis (Last confirmed swing)
🔹 Swing Low: 4318
🔹 Swing High: 4381
📍Golden Zone (61.8%–50%): 4345 – 4358
✅ This aligns with prior structure + EMA support → high confluence reload zone for bulls if retested.
⸻
🎯4️⃣ High-Probability Trade Scenarios
✅ Scenario A: Buy (Continuation – Preferred if pullback holds)
👉 Entry Zone: 4358–4345 (Golden Zone / EMA confluence)
🎯 TP1: 4381 TP2: 4395 TP3: 4410
🛑 SL: Below 4335
⚠️ Scenario B: Aggressive Breakout Buy
👉 Break Above: 4385 (clear candle close + retest)
🎯 TP1: 4395 TP2: 4410 TP3: 4425
🛑 SL: Below 4370
📉 Scenario C: Sell (Countertrend – Only if rejection confirmed)
👉 Break Below: 4335 (structure failure + retest)
🎯 TP1: 4318 TP2: 4305 TP3: 4285
🛑 SL: Above 4355
⸻
📰5️⃣ Fundamental Watch (Asia)
✅ No major Asian macro catalysts.
📉 DXY stabilizing near 106.00 after mild drop → neutral to slightly bullish for gold.
👀 US PMI data later may create pre-Asia caution.
⸻
📍6️⃣ Key Technical Levels
Type Levels
Major Resistance 4381 / 4395 / 4410
Intraday Resistance 4370 / 4385
Golden Zone 4358 – 4345
Major Support 4335 / 4318
Deeper Support 4305 / 4285
Trendline Support Still intact from 4318
⸻
📈7️⃣ Analyst Summary
Gold regained bullish momentum but is now stalling under a key rejection zone. Overbought conditions suggest a retracement is likely before continuation. The safest high-probability setup is a pullback into the Fibonacci Golden Zone for continuation buys. A confirmed break above 4385 opens clean bullish continuation; however, a failure and breakdown below 4335 signals bearish control.
⸻
✅8️⃣ Final Bias Summary
Condition Bias
Above 4358 ✅ Bullish (Continuation Zone)
Above 4385 🚀 Strong Bullish Breakout
Between 4358–4335 ⚖️ Neutral / Waiting for direction
Below 4335 🔻 Bearish corrective wave expected
⸻
🥇 ElDoradoFx PREMIUM 2.0 – PERFORMANCE 20/10/2025 🥇
📊 GOLD TRADE RESULTS:
🟢 BUY +20 pips
🟢 BUY +210 pips
⚪️ SELL LIMIT – Deleted (No Entry)
⚪️ BUY LIMIT – Not Triggered
🔻 SELL +110 pips
🟢 BUY +150 pips
🟢 BUY +90 pips
---
💰 TOTAL GOLD PIPS WON: ✅ +580 pips
📈 RESULT: 7 Signals → 5 Wins | 0 SL | 2 No-Entry
🎯 ACCURACY (on active trades): 100% Wins on executed signals
---
🔥 Clean momentum day with strong BUY-side follow-through and precise executions.
If you followed along — your account should be smiling 📈💎
👏 Congratulations if you profited! ✅✅✅🚀🚀🚀

XAU/USD Bullish Reversal from Buy Zone – Targeting $4,392t: Gold Spot / USD (XAU/USD)
Timeframe: 30-minute
Current Price: $4,253.975
Trend: Recently broke below an ascending channel but bounced from a support zone.
🔍 Key Features on the Chart:
Ascending Channel (Yellow lines)
Price was previously moving inside a well-defined ascending channel.
It broke below the channel, suggesting a possible trend shift or correction.
Buy Zone (Purple Box ~ $4,200 - $4,220)
A demand zone where buyers stepped in.
Price bounced strongly from this zone, indicating support is respected.
Projected Price Path (Blue Zigzag Arrow)
Indicates a possible bullish wave structure (higher highs and higher lows).
Suggests a continuation of the uptrend after the correction.
Target Level: $4,392.539 (Blue Line)
A projected resistance or take-profit zone.
Price is expected to reach this level based on the bullish scenario.
🧠 Interpretation:
Bullish Bias: The chart suggests that the correction might be over after finding support in the "Buy Zone".
Entry Zone: Around $4,200–$4,220 appears to be a strong buy area.
Target: $4,392.539 (approx. +140 points from current level).
Risk Consideration: If price drops below the buy zone significantly, the bullish bias may be invalidated.
✅ Summary of Strategy:
Potential Buy: From current levels or on pullback toward the $4,220–$4,200 zone.
Stop-Loss: Below the buy zone (e.g., under $4,180 or based on your risk tolerance).
Target: Around $4,392.
If you'd like, I can help you:
Calculate potential risk/reward.
Convert this into a trading plan.
Monitor updates (with live data).

Gold has now broken through the resistance level at 4280As our mentioned before, Gold has now broken through the resistance level at 4280 and continues to rise,It may form a short-term bottom structure and further test the 4362 level. A break above the previous high of 4379 would open the door to further upside.
Buy 4280 - 4285
TP 4300 - 4310 - 4320
SL 4270
Daily-updated accurate signals are at your disposal. If you run into any problems while trading, these signals serve as a reliable reference—don’t hesitate to use them! I truly hope they bring you significant assistance

XAU/USD – Bearish Setup at Key Resistance (4,360–4,380 Zone)Current Price: 4,347.85
Market Structure:
Price is currently testing a strong resistance zone around 4,360 – 4,380.
Previous attempts to break this area resulted in sharp rejections to the downside.
The chart suggests a potential double-top formation developing near the resistance level.
📉 Bearish Scenario (Sell Setup)
Sell Zone: 4,360 – 4,380
Direction: 🔴 SELL
Target: 🎯 4,221.50
Stop Loss: 🔻 Above 4,390
📊 Technical Rationale:
The resistance zone has been tested multiple times, showing strong selling pressure.
A rejection from this level could trigger a short-term correction toward the 4,221 target.
Confirmation of the move will occur if price breaks below the recent local low near 4,300, validating the double-top structure.
⚠️ Invalidation:
A 1H candle close above 4,390 would invalidate the bearish setup and may open the way toward 4,420+.
✅ Summary:
Watch for a rejection pattern (such as a bearish engulfing or pin bar) in the 4,360–4,380 zone.
A confirmed rejection provides a short opportunity toward 4,221 with a favorable risk–reward ratio. CME_MINI:NQ1! CME_MINI:ES1! CME_MINI:MNQ1! COMEX:GC1! CBOT_MINI:YM1! COMEX_MINI:MGC1! NYMEX:CL1! COMEX:SI1! CME:BTC1! CBOT_MINI:MYM1!

The 4400 era is coming, and the 4500 era is just beginning.Judging from the current trend, the middle track of the hourly line and the 4H line are already around 4280. As time goes by, the lower low point is constantly rising. We can appropriately increase the expected retracement target and participate in long trading when it retraces to around 4390-4380. But at the same time, we also need to pay attention to the short-term support formed by 4330-4320. If it falls back to this level in the evening and shows a clear stop in the decline, we can also consider entering the market in advance and going long on gold in this range. The upper pressure continues to focus on 4365-4380. If gold rebounds first, you can also consider shorting gold appropriately.
OANDA:XAUUSD

XAU/USD – Key Resistance Zone Test Ahead of Breakout DecisionCME_MINI:NQ1! GPW:FW201! GPW:FCDR1! GPW:FDNP1! GPW:FW401! GPW:FPEO1! GPW:FCDR1! GPW:FALE1! GPW:FMBK1! Gold Spot (XAU/USD)
Timeframe: 15-minute chart
🔍 Technical Analysis Summary
1. Trend Context
The chart shows a recent downtrend after a strong bullish rally.
A descending channel is drawn with two “TRADE LINE” boundaries — upper and lower.
Price is currently trading near the upper boundary of this bearish channel.
2. Resistance Zone
The highlighted resistance area around $4,270–$4,280 aligns with:
The upper trade line of the channel.
A previous support-turned-resistance level.
This makes it a key decision zone for potential reversals or breakouts.
3. Scenario 1 – Bullish Breakout (Blue Path)
If price breaks and closes above the resistance zone and upper channel:
A bullish move could target around $4,382 (the marked upper target).
Confirmation would come with a retest of the broken resistance that holds as new support.
This move aligns with a trend reversal structure (break of market structure).
4. Scenario 2 – Bearish Rejection (Purple Path)
If price fails to break above the resistance and gets rejected:
Expect a pullback continuation within the descending channel.
The next downside target is around $4,185, as labeled on the chart.
This would maintain the short-term bearish momentum.
🧭 Summary Outlook
Scenario Condition Target Bias
Bullish breakout Break & close above $4,280 $4,382 Reversal potential
Bearish rejection Rejection from resistance zone $4,185 Continuation of downtrend
⚠️ Key Watchpoints
Watch for price action confirmation (strong candle close) near the resistance zone.
A false breakout is possible; confirmation via retest is crucial.
Volatility spikes around this level could indicate institutional interest.

Short-term volatility, how to plan for the next market trendGold is currently continuing its upward momentum. In the short term, we will first focus on whether gold can break through 4266. The intraday market has rebounded to this point many times and encountered resistance and fell back. If it is difficult to break through in the short term, the gold price will continue to fluctuate widely. On the contrary, if it can effectively break through 4266, continue to pay attention to the upper resistance range of 4280-4300. When the first rebound touches this resistance range, consider shorting gold in batches with light positions.
OANDA:XAUUSD

Gold Analysis: Break Above $4,293 Could Trigger a New HighHi guys!
Gold has been moving inside a clear ascending channel, respecting both its upper and lower boundaries. Recently, we saw a double top formation near the upper trendline , which triggered a corrective move down to the $4,190–$4,200 support zone, an area that has already shown strong buying interest.
After the rebound from this support, the price is now aiming toward the $4,293 resistance.
👉 If the price breaks and holds above $4,293 , it’s likely to continue the bullish momentum and head toward a new higher high inside the channel.
Overall, the structure remains bullish as long as the price stays above $4,190 , with the next key resistance at $4,293 being the level to watch for a potential continuation of the uptrend.
Gold’s bullish bias remains supported by the ongoing geopolitical tensions, uncertainty over global interest rate paths, and softening U.S. dollar. Investors are also increasingly turning to gold as a safe-haven asset, especially amid concerns about economic slowdown and central bank gold purchases remaining strong.
Disclaimer: As part of ThinkMarkets’ Influencer Program, I am sponsored to share and publish their charts in my analysis.

#XAUUSD Trend Deciding LevelsWill the #bulls take charge to take #xauusd #gold to #4500
Or the Bears will take control from last selling Levels.
Buy and Sell targets in Chart.
Follow #riskmanagement Do your own analysis before initiating any trades !

Gold Trade Set Up Oct 20 2025Price has pushed up during London and swept BSL and is now testing a resistance area and 75 fib. If price stays closes under and make bearish structure on the 15m i will look for sells down towards SSL but if price closes above resistance and continues to make bullish structure on the 15m the target will be PDH

Price Rebounds Above 4,300 After Finding Support Near 4,200After a sharp pullback last Friday and a continued decline in the early session, the price is now finding clear support around the 4,200 level. Having rebroken above 4,300, it is likely to extend its upward movement
Buy@4250 - 4260
TP 4280 - 4290 - 4300 - 4320

BUY GOLD - XAUUSD- Amazing low risk high reward trade!Based on our deep analysis we can see that XAU/USD (gold) will head to the upside. Great time to BUY - it has broken all major resistance levels and has nowhere else to go except upwards. It is also struggling to break past powerful support levels. Buy gold!

XAUUSD extennded Setup [already up 390 pips]XAUUSD holding the Rangebound from 4230-4270. As we mentioned in our morning Setup we took buy from 4225 and 390 pips floating in profits.
What are my conditions For Today's NY session?
Currently if we look for another buy trade we have to wait for closing of m30-H1 candle above 4270 and on retest we can took buy .
Targets: 4305 - 4328-4345.
Additional Tip:
Keep in mind H4 closed below 4230 then stay away from Buy

XAUUSD analysis – 1H OB SetupThe overall market structure remains bullish, forming consistent higher highs and higher lows.
Currently, price is showing signs of a controlled pullback after a strong impulsive leg, and the most probable scenario is a retest of the 1H Order Block around 4110–4130.
That zone holds unmitigated buy orders and sits right below local equal lows — a perfect liquidity pocket before continuation.
We’ll wait for price to sweep that area and confirm a new bullish leg through a lower timeframe confirmation (BOS + FVG + OB alignment) before entering longs.
If the zone reacts cleanly, the next target will be the recent highs (around 4270–4300).
Only a clean break below 4100 would invalidate the bullish scenario for now.
📊 ProfitaminFX | Gold, BTC & EUR/USD
📚 Daily setups & educational trades

XAU/USD 20 October 2025 Intraday AnalysisH4 Analysis:
-> Swing: Bullish.
-> Internal: Bullish.
Price has printed as per previous intraday expectation by printing a bearish CHoCH which indicates, but not confirms, bullish pullback phase initiation.
Price is currently trading within an established internal range, however, I will continue to monitor price with regards to depth of pullback.
Intraday expectation:
Price to continue bearish, react at either discount of 50% internal EQ, or H4 supply zone before targeting weak internal high priced at 4,380. 990.
Note:
The Federal Reserve’s sustained dovish stance, coupled with ongoing geopolitical uncertainties, is likely to prolong heightened volatility in the gold market. Given this elevated risk environment, traders should exercise caution and recalibrate risk management strategies to navigate potential price fluctuations effectively.
Additionally, gold pricing remains sensitive to broader macroeconomic developments, including policy decisions under President Trump. Shifts in geopolitical strategy and economic directives could further amplify uncertainty, contributing to market repricing dynamics.
H4 Chart:
M15 Analysis:
-> Swing: Bullish.
-> Internal: Bearish.
I have been mentioning in my alternative scenario for almost 1-month that all higher timeframes are requiring a pullback, and we are seeing a narrowing of internal structure, price could target strong internal low. This is how price printed.
Price has printed a bearish iBOS after a very long duration and subsequently a bullish CHoCH to indicate, but not confirm bullish pullback phase initiation.
The bearish iBOS has also confirmed the swing-high.
Intraday expectation:
Price to continue bullish, react at either premium of 50%, or M15 demand zone, before targeting weak internal low priced at 4,185.910.
Note:
Gold remains highly volatile amid the Federal Reserve's continued dovish stance, persistent and escalating geopolitical uncertainties. Traders should implement robust risk management strategies and remain vigilant, as price swings may become more pronounced in this elevated volatility environment.
Additionally, President Trump’s tariff announcements, particularly against China, are expected to further amplify market turbulence, potentially triggering sharp price fluctuations and whipsaws.
M15 Chart:

4,200 or 4,285? Gold’s Next Move Decides It All📊 Market Overview
Gold remains under pressure at the start of the week, trading below last week’s record highs, after a sharp correction from the 4,380s down to the 4,240 zone.
Investor sentiment is cautious as the market navigates a mix of uncertain U.S. economic data, a still-closed U.S. government, and renewed geopolitical tensions across multiple regions — all of which are fueling both fear and indecision in the market.
During early Asian hours, gold showed a mild recovery but continues to move sideways in a tight consolidation range, reflecting indecisive liquidity buildup before the next major move.
🧠 Technical Structure (MMFLOW View)
Gold is consolidating between short-term support near 4,206–4,204 and resistance around 4,285–4,287.
Liquidity has started to cluster above and below the current range, suggesting that a breakout is imminent.
The 4,166 – 4,140 region remains a major Smart Money re-entry zone, aligned with the CP BUY ZONE + OBS demand block.
On the upside, 4,313 – 4,342 stands as a key supply zone where large sellers previously stepped in.
Until price breaks out decisively, traders should expect choppy intraday conditions with limited follow-through.
🔑 Key Levels to Watch
🟢 BUY ZONE (Liquidity Re-entry Zone)
Zone: 4,206 – 4,204
SL: 4,200
TP: 4,210 – 4,215 – 4,220 – 4,230 – 4,240 – 4,250 – ???
🔴 SELL ZONE (Liquidity Reaction Zone)
Zone: 4,285 – 4,287
SL: 4,292
TP: 4,280 – 4,275 – 4,270 – 4,260 – 4,250 – ???
⚙️ MMFLOW Scenarios
1️⃣ Bullish Scenario:
If gold sustains above the 4,200 – 4,210 support area, a short-term rebound toward 4,270 – 4,285 can be expected.
Breaking above 4,287 would open room toward 4,313 – 4,342 (OBS Sell Zone), where Smart Money may begin distributing again.
2️⃣ Bearish Scenario:
A clean break below 4,200 could trigger a deeper retracement toward 4,166 – 4,140 (CP BUY ZONE).
This would still represent a healthy correction within the broader bullish macro structure.
⚡ MMFLOW Insights
Market remains neutral-to-bullish, but current movement reflects accumulation within a compression range.
Sideway structure indicates the market is loading liquidity for the next impulsive leg.
Patience is key — traders should wait for clean breakout confirmations before scaling positions.
⚠️ Trading Notes
✅ Use tight Stop Losses — gold’s volatility remains unpredictable during macro uncertainty.
✅ Avoid over-leveraging while price stays inside the sideway channel.
✅ Focus on reaction zones (CP, OBS, and liquidity sweeps) for precise entries.
🧭 Quick Summary
Gold trades sideways below record highs.
Key support: 4,206 – 4,204, key resistance: 4,285 – 4,287.
Short-term bias: Range-bound with bullish undertone.
Best approach: Buy dips at liquidity zones; wait for breakout confirmation before trend trades.

GOLD:Ranging between 4200-4280,awaiting guidance from news flows📈Gold exhibited a trend of surging higher and then pulling back today. In the early session, stimulated by news of localized conflicts in the Middle East, risk-aversion sentiment picked up, driving gold prices higher. After the opening, prices surged rapidly to 4,273.99. However, signs of de-escalation emerged afterward, cooling risk-aversion sentiment.
Meanwhile, factors such as early signs of a decline in U.S. auto loan rates and fading expectations of a Fed rate cut led some funds to shift from gold to U.S. dollar assets, resulting in a drop in gold prices.
📝From a technical perspective, the key resistance level above is around 4280. If gold can hold firmly above this level, it may form a short-term bottom structure and further test the 4362 level. A break above the previous high of 4379 would open the door to further upside. The support level below is near 4200; if this support fails to hold, gold prices may fall further to 4150 or even lower.
📝From a fundamental perspective, there are many uncertain factors in the market. While there are hints of news such as a Russia-Ukraine ceasefire and China-U.S. trade negotiations, the outcomes remain uncertain. If the negotiations do not go smoothly, it may once again benefit gold. Additionally, the probability of a U.S. government shutdown has increased, which provides some support for gold prices.
♦Overall, the Gold is likely to fluctuate within the 4200–4280 range in the short term, waiting for further guidance from fundamental news.
Buy 4220 - 4225 TP 4235 - 4245 - 4255 SL 4210
Sell 4270 - 4275 TP 4265 - 4255 - 4245 SL 4280
Daily-updated accurate signals are at your disposal. If you run into any problems while trading, these signals serve as a reliable reference—don’t hesitate to use them! I truly hope they bring you significant assistance

ElDoradoFx PREMIUM – GOLD ANALYSIS (20/10/2025, LONDON SESSION)Gold is currently trading around 4,228 after failing to sustain above 4,260 in the previous session. The pair has entered a corrective phase, forming a near-term lower high structure on intraday charts. Despite the pullback, the broader bullish trend remains intact, but momentum has temporarily shifted bearish. The upcoming London session will determine whether buyers step in from key retracement zones or if a deeper retracement develops.
⸻
📊 2. Technical Breakdown
✅ Daily (D1)
• Overall trend remains bullish with a corrective dip.
• Last candle shows a bearish wick from the 4,260 rejection zone.
• RSI cooling from overbought territory → indicating controlled correction.
✅ Bias: Bullish long-term, corrective near-term.
✅ 1H Chart (H1)
• Price broke minor intraday support and is currently consolidating near 4,228.
• Trading below 50 EMA, indicating reduced short-term momentum.
• Minor lower highs forming → sellers in control short-term until a bullish reclaim occurs.
📉 Bias: Neutral to bearish below 4,241, bullish above 4,241.
✅ 15M–5M
• Price structure shows intraday descending sequence.
• Small bullish attempts seen near 4,220–4,230, but no confirmed reversal yet.
• Momentum (MACD) still bearish but stabilizing.
📌 Bias: Waiting for either rejection or continuation signal around key zones.
⸻
📐 3. Fibonacci Analysis
Swing Low: 4,197
Swing High: 4,260
Level Price Confluence
38.2% 4,241 Minor intraday resistance & EMA zone
50% 4,229 Current consolidation price
61.8% 4,220 Trendline + previous demand
78.6% 4,209 Liquidity sweep zone
✅ Golden Zone: 4,229 – 4,220 → key reaction area for bullish continuation.
⸻
🎯 4. High-Probability Trade Scenarios
✅ A) Bullish Continuation (Primary Bias if Golden Zone holds)
✔ Entry Trigger: Bullish confirmation inside 4,229–4,220
🎯 TP1 → 4,241 | TP2 → 4,250 | TP3 → 4,260
🛑 SL: Below 4,209
⸻
✅ B) Momentum Buy (Break & Retest)
✔ Trigger: Break & retest above 4,241 (Fib + EMA reclaim)
🎯 TP1 → 4,250 | TP2 → 4,260 | TP3 → 4,279
🛑 SL: Below 4,229
⸻
⚠️ C) Bearish Continuation (Countertrend)
✔ Trigger: Break & retest below 4,220
🎯 TP1 → 4,209 | TP2 → 4,197 | TP3 → 4,180
🛑 SL: Above 4,236
⸻
📰 5. Fundamental Watch
Time Event Impact
All day Middle East sentiment risk Supports gold if tensions rise
London open DXY reaction Strong USD = pressure on gold
Later US session PMI data expected Can shift intraday direction
DXY currently weak near 104.50 → supports possible rebound in gold if structure holds.
⸻
📌 6. Key Technical Levels
Resistance Support
4,241 4,229
4,250 4,220
4,260 4,209
4,279 4,197
📍Trendline support aligns strongest around 4,220.
⸻
📣 7. Analyst Summary
Gold is in a corrective pullback phase inside a long-term uptrend. The Golden Zone (4,229–4,220) is the key battleground between bulls and bears. If price reacts positively and H1 structure shifts bullish above 4,241, continuation toward 4,260 is likely. However, failure to hold above 4,220 could extend the retracement toward 4,197.
⸻
🎯 8. Final Bias Summary
Condition Outlook
✅ Holds 4,229–4,220 Expect bullish continuation
📈 Breaks & retests above 4,241 Momentum reversal confirmed
❌ Breaks below 4,220 Bears take control toward 4,197
⚠️ Break above 4,260 Bull run continuation resumes
📌 Awaiting London confirmation from Golden Zone for bullish re-entry.

20/10/68 : XAUUSD ( Europe / London Session )Using it from Europe Session until 7.00PM , I'll new analysis and update at 8.00PM
Resistance
4287-4292
4276-4281
4271
Support
4260
4250-4255
4239-4245

4,000 Pips Up, 2,000 Down – Gold’s Wild Ride Continues!Last week has been a wild ride for Gold traders, with the price rallying aprox 4,000 pips (around 10%), only to sell off 2,000 pips on Friday in what many expected to be a well-deserved correction.
The big question now is: was that correction enough, or is Gold preparing for another leg down before continuing higher?
In my view, this was just the first leg of the correction, and I expect another wave of selling to come this week.
Currently, Gold is recovering from Friday’s sharp drop, and this rebound could potentially push prices back above 4,300.
If that happens, I’ll be watching closely for signs of weakness to position myself short.
Overall, I believe a new test of the 4,200 area is likely before any sustainable recovery can take place.

ElDoradoFx PREMIUM – GOLD ANALYSIS (20/10/2025, ASIA SESSION)Gold (XAUUSD) closed the previous US session with a rebound from the lower H1 liquidity sweep around 4,186 and is currently pushing back toward the intraday structure resistance near 4,252–4,263. The broader uptrend remains intact but momentum has weakened, suggesting the market is deciding between bullish continuation or deeper retracement. The daily timeframe printed a bearish rejection wick from the previous high at 4,379, showing potential exhaustion but not yet a confirmed reversal.
⸻
🧭 2. Technical Breakdown
✅ D1 (Daily)
• Strong bullish structure remains intact.
• Last candle shows rejection from 4,379 high with moderate selling pressure.
• RSI cooling from extreme (77 → mid 70s), still bullish but losing momentum.
✅ Bias: Bullish unless 4,186 is broken.
✅ H1 (1-Hour)
• Price rebounded strongly after sweeping 4,186.
• Currently consolidating under 4,263 intraday resistance.
• MACD shows early bullish cross but lacks strong histogram expansion (watch momentum).
✅ Bias: Neutral to bullish above 4,216.
✅ 15M–5M (Intra-session)
• Short-term bullish structure forming higher lows.
• Clear break/retest setup forming around 4,252–4,263.
• If bulls fail here, next liquidity target is lower at 4,216–4,200.
✅ Bias: Reactive — breakout or rejection zone incoming.
⸻
📐 3. Fibonacci Analysis (Last swing move)
Swing Low: 4,186
Swing High: 4,252
🎯 Golden Zone (61.8–50%) = 4,216 – 4,225
✅ This aligns with EMA50 H1 zone & previous liquidity rejection → highly reactive zone.
⸻
🎯 4. High-Probability Trade Scenarios
✅ A) Bullish Continuation (Main Setup)
📍 Break & Retest Buy Above: 4,263
🔁 Retest Zone: 4,252–4,256
🎯 TP1 4,279 | TP2 4,300 | TP3 4,320
🛑 SL Below: 4,240
📉 B) Pullback Buy (Golden Zone)
📍 Wait for pullback into 4,216–4,225 (Fib + EMA + demand zone)
🎯 TP1 4,252 | TP2 4,263 | TP3 4,279
🛑 SL Below: 4,200
⚠️ C) Bearish Intraday Sell (Countertrend / only if confirmed)
📍 Break & Close Below: 4,216
🔁 Retest Zone: 4,216–4,225
🎯 TP1 4,200 | TP2 4,186 | TP3 4,171
🛑 SL Above: 4,235
⸻
📰 5. Fundamental Watch (Asia Session)
Factor Impact
DXY sideways Neutral
Yields cooling Supports gold
No major Asian news Technical flow will dominate
Market awaiting US session catalysts Potential low volatility early
⸻
📍 6. Key Technical Levels
Level Type
4,379 Major High
4,263 Intraday Resistance
4,252 Current intraday cap
4,225 Fib support
4,216 Fib confluence
4,200 Key psychological support
4,186 Last liquidity sweep low
⸻
📘 7. Analyst Summary
Gold is stabilizing after a retracement from 4,379 and currently retesting mid-range liquidity. The bias remains bullish, but continuation requires a clean break above 4,263. A healthy corrective entry lies at 4,216–4,225 if price dips first. A strong bearish case only activates if price breaks and sustains beneath 4,216.
⸻
✅ 8. Final Bias Summary
Bias Why
✅ Bullish above 4,225 Aligned with Fib + trend structure
⚠️ Neutral between 4,225–4,263 Waiting for breakout or pullback
❌ Bearish only below 4,216 Would trigger deeper retracement
📌 Game Plan → Buy Break At 4,263 or Wait For Golden Zone 4,216–4,225.
📌 Only sell below 4,216 with confirmation.
----------------------
🥇 ElDoradoFx PREMIUM 2.0 📱
📆 WEEKLY PERFORMANCE: 13/10/2025 → 17/10/2025
---
✅ MONDAY 13/10/2025
🔻 SELL +30 pips
🟢 BUY +210 pips
🟢 BUY +360 pips
---
✅ TUESDAY 14/10/2025
🟢 BUY (Swing) +2,970 pips
🟢 BUY +50 pips
🟢 BUY +210 pips
🔻 SELL +20 pips
🔻 SELL LIMIT +160 pips
🟢 BUY +20 pips
❌ BUY –40 pips (SL)
🟢 BUY LIMIT +40 pips
🔻 SELL +110 pips
🔻 SELL +60 pips
---
✅ WEDNESDAY 15/10/2025
🔻 SELL +60 pips
🟢 BUY +60 pips
❌ SELL –40 pips (SL)
🟢 BUY +60 pips
🟢 BUY +50 pips
🟢 BUY (Swing) +1,970 pips
🔻 SELL +20 pips
🔻 SELL +110 pips
---
✅ THURSDAY 16/10/2025
🟢 BUY +210 pips
🟢 BUY +75 pips
🟢 BUY +230 pips
🟢 BUY LIMIT +210 pips
🔻 SELL LIMIT +210 pips
---
✅ FRIDAY 17/10/2025
🔻 SELL +20 pips
🟢 BUY +20 pips
🟢 BUY +210 pips
🟢 BUY LIMIT +20 pips
🔻 SELL LIMIT +110 pips
🟢 BUY +50 pips
❌ BUY –30 pips (SL)
🟢 BUY +200 pips
🟢 BUY +100 pips
🟢 BUY +400 pips
---
🤑 BTC/USD WEEKEND TRADES
🟢 BUY +2,400 pips
🔻 SELL +400 pips
---
📊 WEEKLY TOTALS
🏆 GOLD NET PIPS +8,565 pips
💰 BTC/USD NET PIPS: ✅ +2,800 pips
🚀 TOTAL GAIN +11,365 pips
📈 TOTAL SIGNALS: 38
✅ WINS: 35
❌ SLs: 3
🎯 WIN RATE: ✅ 92%
---
🔥 Massive GOLD swing wins + strong intraday consistency + BTC power = another high-performance week!
If you stayed disciplined and followed our strategy — you banked big 📈💎
👏 Congratulations if you profited! ✅✅✅🚀🚀🚀

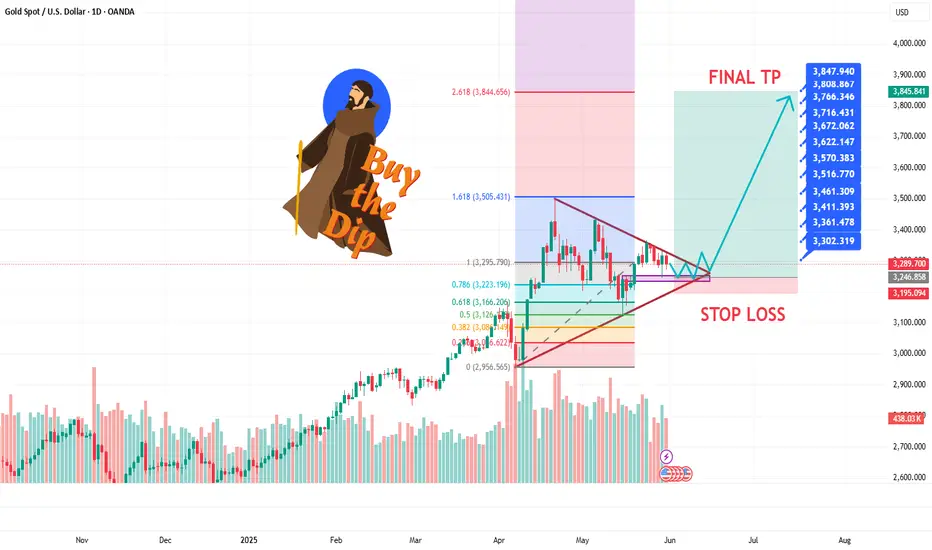
GOLD AND WAR NEXT TO 4K$Hello traders
as i can see gold is trading in a Decending Triangle zone and it had tested Fibo 0.61 ratio in month of may dip as we can see gold close monthly candle above 3280 zone which is a clear sign that big players and banks are still prefer Safe haven we can see US econmey in a bad recession zone unemployment and higher inflation is a big problrm for $ and on all these things Mr. Trump Tariffs is a game changer in commodities markets if we see Geopolitical issues around the world it esculating more war in diffrent regions of the world.. Now Israiel & US have a new biggest problem Iran which is showing us a attack on Iran can be happen incoming days as we can see 6 meetings was unsucessful in Oman for a Deal to Stop Iran's Nucler Enrichment Program which is not good... other then fundamental Charts are crystal clear and showing us a clear view for a New ATH on Gold our Risk reward ratio is prefect for us have a proper research before taking any trade its just an trade idea share your thoughts with us it will help many other traders Comments are open we love your comments and support the channel so it can diliver to many other new traders Stay Tuned for new updates ..