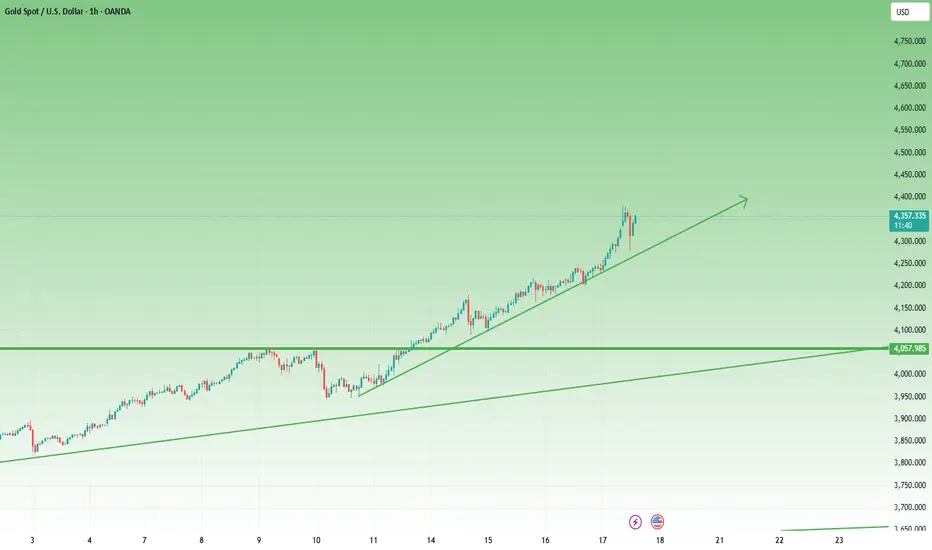
Gold: Outlook for Next Week📈The recent strong bullish momentum in gold finally saw a technical correction on Friday. After Friday’s pullback, the previous robust upward trend has softened slightly. Gold came under pressure at the intraday high around 4379 and pulled back to a low near 4186, representing a nearly 200 downward move. This perfectly illustrates that the stronger the bullish momentum, the larger the pullback range,bulls and bears complement each other.
I have also repeatedly warned everyone against chasing long positions at high levels, as such trades carry significant risks. In practice, I also timely reminded everyone to take profits and exit positions, emphasizing that risk awareness must be a top priority.
💎Outlook for Next Week
When the market opens next week, we will first focus on the resistance around the 4280-4295 range. If this level fails to be broken, gold will likely enter a short-term technical correction phase, and the current bullish cycle will be put on hold temporarily.
we should currently focus on the short-term resistance around the 4280-4295 range, with key attention on the resistance near the 4315-4325 level. On the downside, monitor the support around the 4185-4195 range.
If the bulls fail to achieve a sustained breakthrough above these resistance levels, gold will likely enter a period of oscillating correction in the subsequent sessions.
For trading operations, prioritize seizing opportunities within the aforementioned range. Adopt a "watch more, trade less" approach for prices in the middle of the range,avoid chasing trades recklessly and wait patiently for entry points at key levels.
Xauusdupdates

Gold Performance Recap for the week📝This week, the price of Gold first rose and then fell. The specific trend is as follows:
Monday: Gold broke through the 4059 mark in the Asian trading session, setting a new historical record
Tuesday- Wednesday: The price continued to rise.
Thursday: Gold reached a maximum of 4298.64.
Friday: First, the price surged after the opening, reaching a high of 4379.44, followed by a sharp decline, touching a low of 4186.17. As of now, the price of Gold is 4247.02, continuing to fall compared to the previous day's closing price.
💎The driving factors are as follows:
💡Upward factors in the early stage
1-Impact of Federal Reserve's loose policy expectations: The Federal Reserve launched a new round of interest - rate - cutting cycle in September. The market anticipates that there may be two consecutive interest - rate cuts in October and December. The expected decline in both nominal and real interest rates has increased the attractiveness of holding non - interest - bearing assets such as gold.
2-Surge in geopolitical risks and safe - haven demand: Factors such as the escalation of the China-US trade war and the US's containment of China's chip sector have intensified market panic, and funds have accelerated their inflow into gold as a safe haven.
3-Drive from global central banks’ gold purchase demand: According to data from the World Gold Council, global central banks’ gold reserves increased by 166 tons in the second quarter of 2025. The People’s Bank of China has increased its gold holdings for 11 consecutive months, which has strengthened market confidence in gold.
💡Downward factors in the later stage:
1-Technical level: The 4280 - 4330 area is a key monthly - level resistance zone. On Friday, Gold broke through the important support level of 4280, triggering a large number of stop-loss orders for long positions. Program based trading triggered SL selling, forming a vicious cycle of "breakdown - SL - further decline".
2-Change in risk appetite: On Friday, US President Trump made moderate remarks on trade issues. Market safe-haven sentiment cooled rapidly, leading to a sharp sell-off of gold.

GOLD Support Ahead!
HI,Traders !
#GOLD keeps falling but
A strong horizontal support
Level is ahead at 4173.32
From where we will be
Expecting a rebound
And a local bullish move up !
Comment and subscribe to help us grow !

GOLD BEARISH CORRECTION TOWARDS SUPPORT ZONEChart Overview:
Timeframe: 15-minute
Price Range: 4,170 – 4,360 USD (visual scale)
Current Price: 4,240 USD
Trend Channel: Uptrend channel (yellow) with a recent breakdown from the midline.
🧠 Technical Analysis:
1. Previous Move:
Gold experienced a strong bullish run within an ascending channel, reaching the resistance zone near 4,360.
The momentum formed a rounded top pattern, signaling potential exhaustion of buyers.
2. Pattern Development:
A head-and-shoulders–like formation is visible at the top of the structure.
Price broke below the neckline and tested lower support near 4,215 before rebounding slightly.
3. Current Structure:
Price is retesting the broken support (now resistance) area near 4,260.
The black curve projection shows a potential lower high forming — a bearish continuation setup.

XAUUSD EXTENDS BULLISJH MOMENTUM TOWARDS $4350 & $4450 TARGET.Technical Overview
Current Price: $4,292.85
Support Zone: $4,000 – $4,050
Resistance Zone: $4,450 – $4,500
Trend: Bullish (ascending channel)
🔹 Chart Analysis
The price is moving steadily inside the upward channel, respecting both upper resistance and lower support trendlines.
A short-term retracement may occur near the $4,350 zone (first target), aligning with mid-channel resistance before continuing toward the final target around $4,432–$4,450.
The market shows strong bullish candles, confirming buying pressure with limited corrective dips.
The support base near $4,150 remains strong — as long as this zone holds, the bullish trend is expected to continue.
🔹 Price Targets
First Target: $4,350
Final Target: $4,432 – $4,450
Stop-Loss (if trading): Below $4,200 (trendline support)

When Everyone’s Buying, I’m Watching for the TopAs we’ve grown used to by now, Gold sets a new ATH almost every day — and by the time we, in Europe, wake up, it’s already 300–400 pips higher.
Yet despite the strong bullish momentum, speculative trading remains extremely difficult. Sudden drops of hundreds of pips can easily hit your stop loss if your entry timing isn’t perfect.
From my perspective — even though I don’t have an open position — the idea remains the same: a correction is inevitable.
Since Friday’s low, the price has rallied around 3,000 pips — a fabulous move, but like any late-stage rally, it’s becoming excessive and irrational (even more than it already was).
Of course, it can always go higher, but the more it exaggerates, the faster it tends to normalize.
As I mentioned before, my approach remains focused on identifying potential tops — and while that’s the riskiest thing a trader can do, it has worked quite well during the sharp downward spikes of the last two weeks.
Technically, the move from Friday’s low is forming a rising wedge, with resistance around 4270, which is where I’ll be looking to sell.
The target zone is roughly 1,000 pips lower.
One encouraging factor — even more so than before — is the noticeable narrowing of the spread between futures and spot, now at just 0.2–0.25%, compared to the usual ~1% (and sometimes higher) during strong bullish phases.

Gold: Today's predictions and operations have been verified👏Today, our predictions and operations for gold have been verified by the market. We accurately predicted key price levels and risks, and avoided potential losses from the decline in advance:
✔1-Trend Direction Prediction: We clearly stated that "if gold breaks below $4,280 today, it will trigger a further decline". The subsequent market trend was consistent with this judgment—after touching the key support level, gold fluctuated downward as expected.
✔2-Risk Factor Prediction: We took into account the market characteristic of "traders closing positions early to exit on Fridays" in advance, and predicted that the superposition of multiple factors would make the downward trend uncontrollable. The subsequent market sentiment and fluctuation rhythm confirmed this risk.
✔3-Effectiveness of Operational Decisions: We reminded everyone early to "take profits in advance around $4,350 and stop trading", which successfully helped avoid the potential margin call losses caused by the subsequent uncontrolled trend. This decision was fully in line with the market trend.
🎉Today, we have successfully concluded this week’s trading and work. Next week, we will continue to provide you with more accurate market interpretations and operation references from a professional analytical perspective. Finally, we wish you all a relaxing and pleasant weekend in advance!

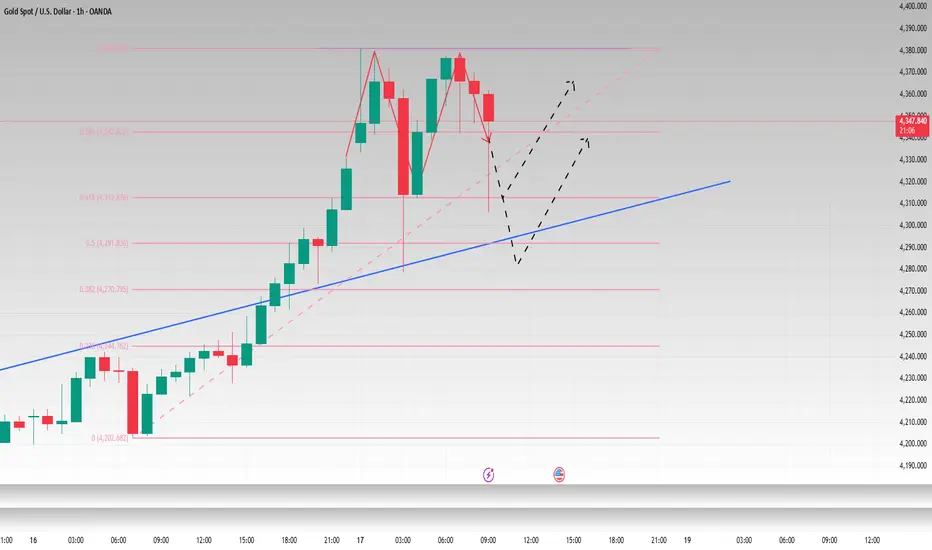
Trap Alert: Gold’s Pullback Could Fuel the Next Bounce!Gold continues to retreat in the short term, currently testing the strength of support at 4300. From the current technical perspective, although gold has repeatedly come under pressure at the 4370-4380 area, forming a multiple top structure in the short term, limiting upside potential in the short term, as gold continues to decline, the current resistance area has shifted down to 4235-4245.
Although gold is retreating under pressure, the overall bullish trend remains strong until it breaks below this key area. The current support structure after the top-bottom conversion lies in the 4290-4280 area. If gold cannot fall below this area during the pullback, then gold still has the potential to rebound to the 4230-4240 area. Therefore, even if we see gold prices continue to retreat, we should not rush to short gold during this pullback.
Instead, consider short-term trading:
We can continue to try to go long on gold with the 4290-4280 area as support. Of course, for short-term trading, the rebound target can be aimed at the 4320-4330 area!

GOLD Awaiting Sell Reaction at Peak & Buy Pullback Support🔍 Market Context
After a series of strong Break of Structure (BoS) , gold has reached a new ATH at 4,385 USD – marking a sustainable uptrend over the past 3 sessions.
However, this peak area is currently acting as a significant psychological and technical barrier . Buying momentum is temporarily slowing as the price reacts to the Liquidity Zone around 4,351 – 4,385 USD .
The market is in a phase of liquidity rebalancing .
The major trend remains upward, but the current price area may see a short-term correction before further wave expansion.
💎 Technical Analysis
ATH GOLD: 4,385 USD
Sell Liquidity Zone: 4,430 – 4,435 USD → high liquidity resistance zone, potential for short-term sell reactions.
Liquidity Zone $$$: 4,284 – 4,282 USD → nearby support zone, confluence with trendline.
Order Block | Fibonacci Zone: 4,226 – 4,230 USD → deep discount zone confluencing with Fibo 0.618, high reversal potential.
Overall Structure: remains bullish , but showing short-term signs of weakness as the price fails to hold above 4,360.
📈 Trading Scenarios
1️⃣ SELL Setup – Rejection at peak area 4,385 – 4,433 USD
Entry: 4,430 - 4,435
SL: 4,440
TP: 4,425 → 4,420 →4,415→4,410→4405
✅ Condition: Appearance of rejection or strong bearish engulfing candles at high Liquidity zone.
➡️ This is a liquidity reaction setup – sell when the price sweeps the peak and clear sell signals from major players appear.
2️⃣ BUY Setup #1 – Pullback at 4,284 – 4,282 USD
Entry: 4,284 – 4,282
SL: 4,272
TP: 4,290 → 4,300 → 4,310/Open
✅ Condition: Strong H1 candle reaction at support or minor reversal structure.
➡️ Buy with the main trend, taking advantage of a slight pullback around the support Liquidity zone.
3️⃣ BUY Setup #2 – OB Deep Zone 4,226 – 4,230 USD
Entry: 4,226 – 4,230
SL: 4,190
TP: 4,235 → 4,240 → 4,250/Open
✅ Condition: Appearance of bullish BoS or confirming bullish engulfing candle.
➡️ This is a deep discount zone, suitable for swing orders following the main trend.
⚠️ Risk Management
Avoid FOMO buying at high zones (4,360+).
Prioritize observing price behavior at 4,284 and 4,226 before entering orders.
Sell orders at 4,385–4,430 are only triggered if there is a clear confirmation signal.
Maintain moderate volume, avoid averaging down without confirmation.
💬 Conclusion
Gold is accumulating after reaching the peak of 4,385 USD , this is a crucial phase to determine the correction before the new upward wave.
The most effective strategy now is sell reaction at the high peak area 4,385 – 4,430 and buy with the trend at 4,284 – 4,226 USD when confirmation appears.
👉 Reasonable Strategy:
Sell Reaction: 4,385 – 4,430 → TP 4,284 – 4,226
Buy Pullback: 4,284 – 4,282
Buy OB Deep: 4,226 – 4,230

Gold: Oscillated - Plummeted - ReboundedFrom an intraday trend perspective, gold surged to near 4379 – 4380 in the early hours of the morning , the morning session saw gold oscillate between 4350 and 4370. It then experienced a sharp drop, falling to around 4280 at one point, before rebounding again.
Overall, after hitting a new all-time high, gold traded in a high-level range during the day due to technical correction needs and complex market sentiment.
For the short term, focus should be on the support zone around 4280 – 4300. If it breaks below 4280, further downside may follow. On the upside, the key resistance level to watch is 4380; a strong break above this level is expected to push gold to 4395 – 4410 during the day.
Buy 4320 - 4330
TP 4350 - 4360 - 4370
SL 4300
Daily-updated accurate signals are at your disposal. If you run into any problems while trading, these signals serve as a reliable reference—don’t hesitate to use them! I truly hope they bring you significant assistance

It is not a reversal callback correction to continue to buyGold gapped up at the opening, touched 4379 and then plunged nearly $100 before rebounding quickly. The fluctuations in the Asian session alone are so drastic. In addition, today is Friday and there is a risk of market closure, so intraday trading needs to be more cautious.
From the news perspective, the expectation of a Fed rate cut provides liquidity support, Sino-US trade tensions and geopolitical risks stimulate safe-haven demand, and the weakening of the US dollar and economic uncertainty amplify the appeal of gold. Many investors continue to increase their holdings of safe-haven assets in a complex macroeconomic context, providing solid and strong support for the rise of gold.
Although short-term prices fluctuate frequently, they have not fallen below the daily MA5 and MA10 moving averages. Therefore, it should not be regarded as a trend reversal, but a market shakeout. Therefore, we maintain a trading strategy that is mainly bullish and supplemented by short selling.
From a fundamental perspective, multiple rebound attempts failed to break through, making the upper 4380-4400 range a short-term resistance range. The short-term trend has the tendency to form an M top, so I will give several long trading opportunities during the day.
First of all, we should pay attention to the first support formed by 4315-4305 below, which is also the 61.8% retracement position of gold. If it repeatedly circles this position in the short term without breaking, we can try to go long on gold. For the second chance, I would give the support level of 4290-4280 below, which is near the trend suppression and the 50% dividing line, as well as the 4H MA10 moving average. I think we can try to go long on gold again within this range. The last chance I would give is around 4200, the starting point of this round of rise. Even if gold retaliates and falls, we can still maintain good trading opportunities.
During the day, we can go long on gold in batches according to the strength of gold's retracement.
OANDA:XAUUSD
Gold Trade Set Up Oct 17 2025Price has tested a strong support for the third time and is respecting it so i am still bullish from this area to target BSL and ATH levels

#XAUUSD: Small Time-Frame Big Trade! Comment Your Views! Price is at the 'premium buying level' at this point we could expect it to continue the bullish momentum towards 4300$ or $4350. Please use accurate risk management while trading gold.
Good luck

ElDoradoFx PREMIUM – GOLD ANALYSIS (17/10/2025, US SESSION)Prepared by: ElDoradoFx Premium 2.0 Analyst Team
⸻
🧭 Market Overview
Gold has entered a corrective phase after failing to break and sustain above 4,379, the current weekly high. During the London session, price fell sharply to 4,305–4,313, testing the ascending trendline support and the Fibonacci Golden Zone from the latest bullish swing.
The daily chart remains bullish in structure, but intraday momentum has shifted bearish short-term, suggesting a potential retest deeper into support before a continuation to the upside.
⸻
📊 Technical Breakdown
1️⃣ Daily Chart (D1)
• Structure: Uptrend intact — higher highs & higher lows.
• RSI: 85.0 → Overbought, signaling possible cooling phase.
• Support Zone: 4,290–4,273 (near 38.2% retracement).
• Bias: Medium-term bullish; short-term correction.
2️⃣ 1-Hour Chart (H1)
• Price broke minor structure at 4,336 and tapped the lower channel.
• Currently consolidating around 4,313, forming potential base support.
• 50EMA flattening; momentum slowing.
• Bias: Neutral to bearish short-term until 4,336 is reclaimed.
3️⃣ 15M–5M Chart
• MACD bearish, histogram red — short-term selling pressure.
• RSI rebounding from oversold (33) — early signs of intraday support reaction.
• Liquidity below 4,300 remains uncollected — could attract a final sweep before reversal.
⸻
📐 FIBONACCI ANALYSIS (Last Swing: 4,273 → 4,379)
Level Price Confluence
38.2% 4,336 EMA50 / previous structure
50.0% 4,326 Key mid-range
61.8% 4,318 Trendline & intraday liquidity
📊 Fibonacci Golden Zone → 4,318–4,336
This remains the key reaction zone for re-entry confirmation or next leg down if broken.
⸻
🎯 HIGH-PROBABILITY TRADE SCENARIOS
✅ BUY SETUP (Primary Bias – After Confirmation)
• Break & Retest: Above 4,336, confirming buyers reclaim control.
• Retest Zone: 4,330–4,336
• Targets:
• TP1 → 4,350
• TP2 → 4,363
• TP3 → 4,379
• Stop-Loss: Below 4,318
(Re-entry within Golden Zone only if we see bullish engulfing / strong volume candle.)
⸻
⚠️ SELL SETUP (Active Short-Term Bias)
• Break & Retest: Below 4,305, confirming downside continuation.
• Retest Zone: 4,305–4,313
• Targets:
• TP1 → 4,290
• TP2 → 4,273
• TP3 → 4,250
• Stop-Loss: Above 4,336
(This would confirm Golden Zone break and shift momentum bearish toward 4,273.)
⸻
🚀 BREAKOUT BUY (Aggressive)
• Trigger: Break & retest above 4,379 (previous high).
• Retest Zone: 4,372–4,379
• Targets: 4,395 → 4,410 → 4,428
• Stop-Loss: Below 4,355
⸻
🕐 FUNDAMENTAL WATCH
• DXY: Hovering around 104.90 — slight rebound causing gold weakness.
• Bond Yields: Stable; no risk-off catalyst for new gold strength yet.
• Upcoming US Data: Michigan Consumer Sentiment — could add volatility later.
• Institutional Flow: Still net-long on gold, suggesting corrections are accumulation phases.
⸻
⚙️ KEY TECHNICAL LEVELS
Type Levels
Resistance 4,336 / 4,363 / 4,379
Support 4,318 / 4,305 / 4,273
Trendline Support 4,305 (critical for maintaining bullish structure)
⸻
🧾 Analyst Summary
Gold remains bullish overall, but short-term momentum has shifted bearish following repeated rejections from 4,379.
Current retracement into 4,318–4,305 is a critical decision zone — if this holds, expect recovery toward 4,350–4,379.
However, a clean break below 4,305 confirms a deeper pullback toward 4,273–4,250 before the next major wave higher.
⸻
📈 Bias: Bullish above 4,318 – Watch for re-entry confirmation.
📉 Alternative Bias: Bearish below 4,305 – Short toward 4,273.

GOLD Local Long!
HI,Traders !
#GOLD is going down
To retest the horizontal
Support of 4314.84from
Where we will be expecting
A local bullish rebound
And a move up !
Comment and subscribe to help us grow !

Gold’s Final Surge Before the Fall: The Herd Joins at the TopGold has rallied over 27% exactly as projected in the previous analysis
Now, the structure shows clear signs of exhaustion — price is approaching the end of wave 5, historically the stage where euphoria peaks and reversals are born.
Across the world, the crowd is piling into gold in a classic late-cycle buying frenzy. This kind of herd behavior — “everyone rushing to buy at once” — has always marked the final chapter of impulsive moves before major trend reversals.
The chart highlights potential trigger zones for the coming reversal:
Upper red dashed lines: triggers for aggressive traders
Lower red dashed lines: triggers for more conservative entries
Once those levels start breaking down, expect momentum to flip hard — and fast — signaling the beginning of a sharp corrective phase for gold.

GOLD (XAU/USD) BULLISH CONTINUATION SETUP AFTER RETESTChart Overview
Timeframe: 1H (Hourly)
Current Price: Around $4,338
Trend: Strong bullish trend within a rising channel
Structure: Price broke slightly above the channel top and is now retesting the resistance level as potential new support
🔍 Detailed Analysis
1. Trend Structure
Gold has been moving in a strong upward channel, showing consistent higher highs and higher lows.
The breakout above the resistance channel suggests bullish continuation, but a short-term pullback or retest is expected before another leg up.
2. Key Levels
Resistance Level: Around $4,350 – $4,370, now acting as support.
Entry Zone: Around $4,313 – $4,338 (highlighted region).
Stop Loss: Below $4,274 – $4,268 zone to protect against false breakouts.
Target Point: Around $4,509 – $4,513, which aligns with the projected move from the breakout zone.
💹 Trade Plan (Bullish Setup)
Entry: Wait for price to test and hold above $4,313 (confirmation candle or bullish rejection).
Stop Loss: $4,274 – $4,268 (below recent swing low).
Take Profit: $4,509 – $4,513.
Risk/Reward Ratio: Roughly 1:4, which is excellent for a continuation trade.
⚠️ Market Sentiment Notes
If gold fails to hold above $4,313, the move could turn into a deeper correction toward $4,250 – $4,200.
Watch for strong bullish candles near the entry zone for confirmation.
The setup remains bullish-biased, but patience for a clean entry is key.
✅ Summary:
Bias: Bullish
Setup Type: Pullback continuation
Buy Zone: $4,313 – $4,338
Target: $4,509 – $4,513
Stop: $4,268

XAUUSD To Hot to Handle ( could be last setup on Bullish)XAUUSD is still on bullish Bias and holding the consolidation zone from 4330-4370 .
Today market is creepy We have to be very careful.
What are my conditions For Today's session?
1st- Currently market is moving at previous liquidity Gap at 4330-4325 area and I took multiple buys at 4320 and My stoploss are at my Breakeven.
2nd- if Market remains low and H1 candle closes below 4325 then we'll have Retracement towards 4290- 4270.
Additional Tip:
-BUY the Dips with stoploss my Ultimate next Perfect buy will be 4230-4240 Zone .

Relentless Rally:Gold Won’t Rest Until 4500!?The 4300 series chapter has begun as expected, with gold continuing its strong upward trend, currently reaching a high near 4381. However, it is clear that after encountering resistance in the 4370-4380 area three times, gold has shown clear signs of a pullback. This could lead to the formation of a triple top structure in the short term, suppressing gold prices in the short term.
However, relatively speaking, as gold continues to rise, testing the 4280 area during the pullback before rebounding again, technical support has shifted to the 4320-4310 area. Furthermore, the validation of the pullback and the current strong upward trend will strengthen the support in this area to a certain extent, thus supporting gold's rebound.
Therefore, for the current short-term trade:
1. First, try to continue shorting gold with resistance at 4370-4380, targeting a pullback to the 4350-4340 area.
2. Once gold retraces to the 4320-4310 area, consider going long on gold, targeting the 4340-4350 area.

ElDoradoFx PREMIUM – GOLD ANALYSIS (17/10/2025, LONDON SESSION)Prepared by: ElDoradoFx Premium Analyst Team
⸻
🧭 Market Overview
Gold remains in a strong bullish cycle, printing higher highs and higher lows across all major timeframes. However, after multiple rejections near $4,379–$4,380, the market is showing temporary exhaustion, hinting at a possible short-term retracement before continuation.
RSI readings above 85 on the daily chart suggest the metal is overbought, yet momentum structure remains intact.
⸻
📊 Technical Breakdown
1️⃣ Daily Chart (D1)
• Structure: Clear bullish trend continuation.
• RSI: 86.0, signaling potential short-term correction.
• Key Support: 4,316 – 4,273 (previous resistance now turned support).
• Bias: Bullish but extended — watch for retracement into 38.2%–61.8% Fib zone.
2️⃣ 1H Chart (H1)
• Price rejected resistance at 4,379, forming a lower high with weakening MACD histogram.
• 50EMA and 200EMA both sloping upward — overall momentum remains long-term bullish.
• Support Zone: 4,336–4,318 (Fibonacci confluence).
• Bias: Short-term corrective retracement expected before new buying momentum resumes.
3️⃣ 15M–5M Charts
• Consolidation within a tight intraday channel.
• Liquidity above 4,379 remains uncollected — likely target after correction.
• MACD turning flat, confirming short-term pause.
⸻
📐 Fibonacci Analysis (Last Swing: 4,273 → 4,379)
Level Price Confluence
38.2% 4,336 Near EMA50 & intraday support
50.0% 4,326 Mid-channel support
61.8% 4,318 Trendline intersection / re-entry zone
📊 Fibonacci Golden Zone: 4,318–4,336
→ Optimal area to look for bullish confirmation patterns before re-entry.
⸻
🎯 High-Probability Trade Scenarios
✅ BUY SCENARIO (Primary Bias)
• Break & Retest: Above 4,364, confirming short-term bullish continuation.
• Retest Zone: 4,350–4,355
• Targets:
• TP1 → 4,379
• TP2 → 4,395
• TP3 → 4,410
• Stop-Loss: Below 4,338
⚠️ SELL SCENARIO (Countertrend Opportunity)
• Break & Retest: Below 4,336, signaling potential correction phase.
• Retest Zone: 4,336–4,345
• Targets:
• TP1 → 4,318
• TP2 → 4,300
• TP3 → 4,273
• Stop-Loss: Above 4,355
🚀 AGGRESSIVE BREAKOUT BUY
• Trigger: Clean breakout above 4,379 and candle closure.
• Retest Zone: 4,372–4,379
• Targets: 4,395 → 4,410 → 4,428
• Stop-Loss: Below 4,355
⸻
📰 Fundamental Outlook
• US Data: Light calendar until NY session; traders watching inflation expectations.
• DXY: Below 104.80, maintaining downward bias, supportive for gold.
• Yields: Neutral; no fresh upside momentum observed.
• Global Sentiment: Slightly risk-off, benefiting gold as a hedge.
⸻
⚙️ Key Technical Levels
Type Levels
Resistance 4,379 / 4,395 / 4,410
Support 4,336 / 4,318 / 4,273
Pivot Zone 4,350–4,355 (London liquidity area)
⸻
🧾 Analyst Summary
Gold remains structurally bullish while holding above 4,336, though an intraday pullback into the Fibonacci Golden Zone (4,318–4,336) would offer better long entry opportunities.
A confirmed break above 4,379 can open a clean path toward 4,410–4,428.
If 4,336 fails to hold, expect a healthy retracement toward 4,300–4,273 before the next bullish impulse.
⸻
📈 Bias: Bullish above 4,336 — Corrective phase expected before continuation.
📉 Alternative Bias: Bearish short-term below 4,336 (retracement only).

Gold Retests All-Time Highs – Bulls Still in Full Control📊 Market Overview
Gold experienced a sharp intraday drop during the Asian session, testing the 4,280 – 4,279 USD zone before quickly recovering. Despite short-term volatility, it continues to close the week in green for the ninth consecutive time — confirming the strength of the ongoing bullish cycle.
The broader fundamentals remain supportive:
💥 Persistent geopolitical tensions keep safe-haven demand high.
⚖️ US–China trade uncertainty and the risk of a prolonged US government shutdown weaken risk appetite.
💵 Fed rate-cut expectations and USD softness continue to favor gold upside.
In short — Smart Money remains positioned long, and every dip still looks like a liquidity grab for re-accumulation.
🧠 Technical Structure (MMFLOW View)
On the M30 timeframe, gold continues to respect an ascending channel, currently forming a liquidity trap and breakout setup around 4,280 – 4,330.
Price action suggests gold may be completing a short-term corrective wave (B) before resuming the larger bullish impulse.
The structure remains technically bullish, with all pullbacks showing strong rejections from demand zones.
🔑 Key Levels to Watch
🟢 BUY ZONE (Primary Setup)
Zone: 4,230 – 4,228
SL: 4,220
TP: 4,240 – 4,250 – 4,260 – 4,270 – ???
🔵 CP ZONE BUY (Secondary Support)
Zone: 4,284 – 4,285
SL: 4,275
TP: 4,300 – 4,315 – 4,330 – 4,340 – ???
🔴 SCALP SELL (Liquidity Reaction Zone)
Zone: 4,438 – 4,440
SL: 4,448
TP: 4,420 – 4,410 – 4,390 – ???
⚙️ MMFLOW Scenarios
1️⃣ Primary Bullish Scenario:
If gold holds above 4,280 – 4,284, expect continuation toward 4,380 – 4,438 (Liquidity Sell Zone).
The 4,284 level is the key control point where Smart Money may look to re-enter long positions.
2️⃣ Alternative Correction Scenario:
A clean break below 4,280 could drive price toward 4,249 – 4,243 (CP Buy Zone) before another bullish push higher.
This structure still aligns with a Healthy Correction Pattern within a broader uptrend.
⚡ MMFLOW Insights
Gold remains in a mid-term expansion phase, with both macro and technical alignment favoring continued upside.
The 4,280 – 4,330 range acts as a Smart Money accumulation zone, preparing for a liquidity sweep higher.
Medium-term upside target: 4,438 – 4,445 USD/oz (Liquidity Sell Zone).
⚠️ Trading Notes
✅ Always use a protective Stop Loss — volatility can spike during liquidity hunts.
✅ Avoid chasing entries at highs; wait for reaction around BUY ZONES.
✅ Focus on liquidity confluence zones (Fibo + CP Zone + Order Block) for the highest-probability setups.
🧭 Quick Summary
Gold remains resilient despite early-session volatility.
Watch BUY ZONES at 4,230 – 4,228 and 4,284 – 4,285 for possible long re-entries.
Short-term target: 4,380 – 4,438 USD/oz.
Bias: Bullish – Buy the dips, not the breakouts.

17/10/68 : XAUUSD ( Europe / London Session )Using it from Europe Session until 7.00PM , I'll new analysis and update at 8.00PM
Resistance
4396-4401
4386-4391
4381
Support
4370
4360-4365
4349-4355

Gold – Madness in MotionGold rose this week — so far (and I really want to stress so far ) — by around 10%. That’s massive by any standard.
On Monday, I tried to catch a dip and missed it. Since Tuesday, I’ve been on the sell side — completely wrong on direction , yet somehow still managed to finish positive overall.
Yesterday my stop got hit, but after what happened overnight, it turned out to be just a scratch. With this kind of volatility, a recovery of 250pips can happen in ten minutes.
Looking at the chart — it’s bullish, no question. Should it be bought? Hmmmm...
Looking at the volatility… for me, it’s become untradeable.
Can it keep going higher? Of course.
How high? Nobody knows.
At this point, any prediction is just throwing numbers in the air.
Trading corrections, as I’ve tried to do, is a guessing game. I’ve had some luck so far, but after yesterday's stop loss, I’m stepping aside.
My take: stay out. Let others make money if they can.
A 1,000-pip rise and an equal reversal — all while I was asleep (and trust me, I sleep very little) — is too crazy. Stops can be wiped for bulls just as easily as for bears.
At some point, it will settle down and define its levels.
Until then — it’s not for me anymore.