XAU/USD Bullish Continuation Setup Toward 4,223 After Liquidity 1. Market Structure
The chart highlights a COCH (Change of Character) followed by a BOS (Break of Structure), signaling a shift from bearish to bullish structure.
Several smaller coch points confirm internal bullish structure building.
2. Liquidity & POI Zones
There is a clear liquidity sweep near the PDL (Previous Day Low), where price dipped into a demand zone to collect orders.
An Extreme POI (Point of Interest) sits below current price — this acted as the strong reaction zone for the bullish move.
PDH (Previous Day High) is marked as an early short-term target/liquidity area.
3. Expected Move
The projection (zig-zag line) indicates bullish continuation after a pullback into the POI zone.
The target is marked around 4,223.629, matching the red horizontal resistance line.
The EMA (9) serves as dynamic support, showing price respecting the bullish trend.
4. Probability Outlook
As long as price stays above the trendline and POI, the bias remains bullish.
A break below the POI would invalidate the setup and open the lower liquidity region again.
Xauusdupdates

XAUUSD Analysis todayHello traders, this is a complete multiple timeframe analysis of this pair. We see could find significant trading opportunities as per analysis upon price action confirmation we may take this trade. Smash the like button if you find value in this analysis and drop a comment if you have any questions or let me know which pair to cover in my next analysis.

XAUUSD BUYI expect Gold to push to the upside from Price action shown on the chart. Gold breakout and expecting pullback and rally toward above Fair value gap and Supply zone above.

XAUUSD: Gold Wave HarmonyXAUUSD: Gold Wave Harmony
According to its wave structure, gold is completing a correction phase and preparing to form a new impulse. The chart shows a transition from sideways movement to a more dynamic wave, which could set the direction for the near term.
Main scenario: after the correction ends, a downward impulse sequence is expected to develop. Alternative scenario: if the market consolidates above recent highs, it could continue to rise, delaying the start of a new downward wave.
Idea for traders: watch for confirmation of the structure on lower timeframes and enter only after clear reversal signals appear.
Risk management: use clear stop levels and adjust the plan as new impulses emerge.
Friends, more wave analysis is available in our profile.
Subscribe to stay up to date with wave analysis!

GOLD EXPLOSION: READY TO CONQUER NEW HEIGHTS?I. HOT NEWS 💥
Gold is experiencing its 4th consecutive monthly increase, reaching $4,192.78/oz (closing on 11/28) thanks to significant changes from the Fed.
Interest Rate Reversal: Recent statements from the Fed Governor have increased the probability of a rate cut in December 2025 to 89% (up from 50% last week).
Gold Connection: A low-interest-rate environment is a paradise for Gold, propelling it to become a safe-haven asset. The fundamental momentum is EXTREMELY STRONG.
II. TECHNICAL ANALYSIS 📊
The price is approaching a critical supply zone. The current strategy is Buy on Dip with higher targets.
Short-term Resistance Target (PDI):
Price Range: $4,210 – $4,235
Strategy: Short-term resistance, requires a decisive Breakout to continue the upward momentum.
Ultimate Target (FVG):
Price Range: $4,260 – $4,330
Strategy: The next potential profit-taking target for Smart Money. Main Long target.
Strong Demand Zone (OB - Order Block):
Price Range: $4,046 – $4,064
Strategy: Strategic support (Demand Zone). A safe buying area if the price corrects deeply.
III. CONCLUSION & RISKS 🎯
Market Sentiment: Strongly BULLISH thanks to momentum from the Fed.
Focus: Monitor price action around $4,235. If surpassed, $4,330 is not far off.
Warning: Always manage risk (SL) tightly. Do not trade without Price Action confirmation!
#XAUUSD #GOLD #FOREX #FedDovish #RateCuts #SMC #OrderBlock #FVG #BullishTrend #TradingView

Will gold prices rise again in the new week?1️⃣ Trendline
Long-term descending trendline (upper black line)
Price has strongly broken above the long-standing descending trendline.
→ This signals a transition from a bearish phase to a medium-term bullish trend.
Short-term ascending trendline (small channel)
Price is moving inside a short-term ascending channel, consistently forming higher lows.
The recent breakout came with strong momentum → bullish strength is currently dominant.
2️⃣ Support – Resistance
Key Support Levels
4,111 – 4,108:
A confluence zone of the ascending channel’s bottom, EMA, and the 0.618 Fibonacci level → strong support if price pulls back.
4,145 – 4,150:
This is the breakout zone and will act as a retest support if price revisits it.
Key Resistance Levels
4,238 – 4,245 (Fibo 1.618 + previous structure high)
→ First major resistance zone. Price may consolidate or shake before breaking through.
4,375 – 4,380 (Fibo 2.618 + major upper zone, ATH area)
→ Large upside target if price breaks and holds above 4,245.
3️⃣ Fibonacci
The current upward swing is targeting the 1.618 Fibonacci extension at 4,238 – 4,245.
If this zone is broken and price closes above:
→ Next extension target is 2.618 Fibonacci near 4,375 – 4,380.
4️⃣ Trend Outlook
Trend: Short-term bullish → shifting to medium-term bullish after breaking the major descending trendline.
Key level to hold:
Above 4,145–4,150 = bullish continuation.
Upside targets:
4,238 – 4,245
4,372 – 4,380 (if bullish momentum continues)
Trading Plan
BUY GOLD: 4111 – 4108
Stop Loss: 4098
Take Profit: 200 – 400 – 700 pips
SELL GOLD: 4278 – 4281
Stop Loss: 4291
Take Profit: 200 – 400 – 700 pips

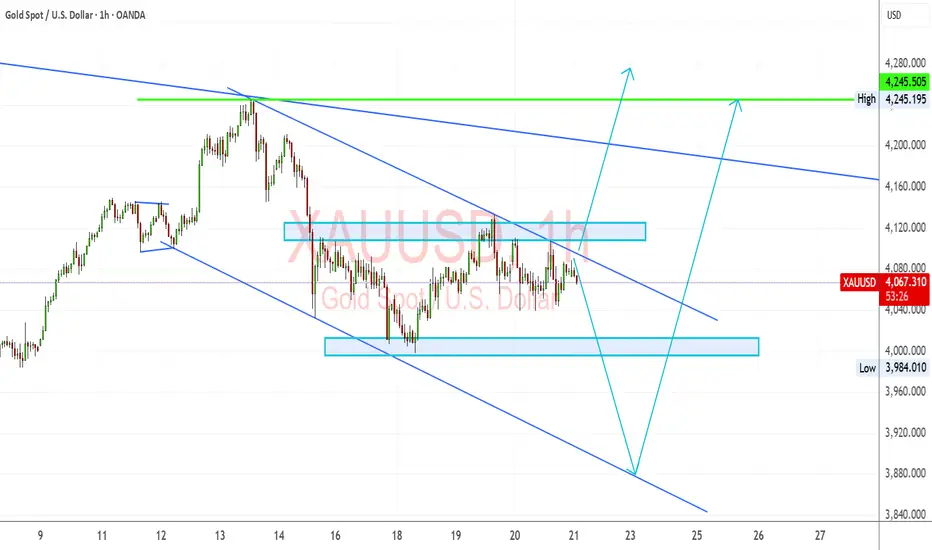
Gold Pullback or Breakout? Sitting at the Edge of a Bigger MoveGold Pullback or Breakout? XAUUSD Sitting at the Edge of a Bigger Move
Gold is coiling in a narrowing channel, and this kind of structure usually ends with a sharp directional break. The chart shows buyers trying to defend the mid-zone, while the broader trend still leans corrective. With macro fundamentals shifting fast and volatility picking up around U.S. data, gold is getting primed for a move that won’t stay quiet for long.
Current Bias
Short-term neutral leaning bullish.
Medium-term bullish if buyers defend the lower channel and reclaim the upper trendline.
Key Fundamental Drivers
• US inflation and labour data are softening (per recent BLS and ADP reports), reducing expectations of aggressive Fed tightening. This generally supports gold.
• US yields have eased from recent highs, reducing opportunity cost of holding gold.
• Geopolitical tensions (Middle East, Ukraine, South China Sea) are keeping a haven bid under gold.
• Strong central-bank buying continues to act as a long-term floor for gold prices.
• USD movement remains the dominant short-term driver.
Macro Context
• Interest rate expectations: Markets are pricing a slower Fed path, especially after soft labour prints and cautious speeches from Cook and other Fed officials. A stable-to-mildly-dovish Fed environment supports gold.
• Global growth trends: Europe remains in a slowdown according to Sentix, while Asia shows modest improvement. Weak global growth tends to boost gold.
• Commodity flows: No supply shocks, but ETF outflows are stabilizing—another supportive sign.
• Geopolitics: Israel–Lebanon escalation risk remains in play. Several global risk headlines recently helped gold find intraday support.
Primary Risk to the Trend
A strong USD rally—especially if driven by unexpected U.S. data strength or hawkish Fed comments—would pressure gold back into deeper corrective territory.
Most Critical Upcoming News/Event
• US FOMC speakers (multiple appearances)
• US CPI revisions and PPI data
• US unemployment claims and PMIs
These will decide whether yields move higher again or give gold room to rally.
Leader/Lagger Dynamics
Gold is usually a lagger to:
• USD direction
• US yields
• Fed expectations
But becomes a leader during periods of heavy geopolitical risk, when it pulls safe-haven assets like CHF and JPY with it.
Right now, XAUUSD is following USD and yields more closely than risk sentiment.
Key Levels
Support Levels:
• 4,000 – 3,985 zone (major demand area)
• 3,960 (channel low / liquidity sweep potential)
Resistance Levels:
• 4,115 – 4,135 (mid-range supply)
• 4,245 (major resistance + previous high)
Stop Loss (SL):
• 3,960 (below channel structure)
Take Profit (TP):
• TP1: 4,115
• TP2: 4,245
Summary: Bias and Watchpoints
Gold is building energy inside a narrowing channel, and the next macro catalyst will likely determine the breakout direction. My bias is neutral-to-bullish as long as price holds above the 4,000 zone and avoids a breakdown toward 3,960. The key drivers are weakening U.S. data, softer Fed expectations, and a stable-to-higher geopolitical risk backdrop. The biggest risk is a USD rebound powered by hotter-than-expected U.S. numbers. The most important event ahead is the cluster of U.S. inflation and labour releases, which will directly influence yields and therefore gold. Stops sit cleanly below 3,960, and the natural upside magnet remains 4,115 first, then 4,245 if momentum builds.
Weekly Gold Trend SummaryThis week, gold witnessed a remarkable transition from bottom consolidation to strong upward momentum, forming an overall oscillatory uptrend. After intense long-short battles earlier in the week, bullish forces gradually gained dominance, driving prices from around the $4,000 psychological level to above $4,200 with substantial gains. The weekly movement can be segmented as follows:
1. Early-Week Consolidation Under Pressure (November 24)
Gold extended its mild correction at the start of the week, opening at $4,065.63 during the Asian session with minor intraday declines. A sudden volatility spike occurred in late Asian trading, sending prices plunging $22 to $4,055.48 (a 0.48% drop). Pressured by a strong U.S. dollar and fading expectations of a Fed rate cut in December, gold’s safe-haven appeal remained subdued as capital flowed into dollar-denominated assets. Prices traded under pressure within the $4,000 – $4,100 range; however, buying interest emerged near the annual moving average, halting the downward trajectory.
2. Mid-Week Intensified Long-Short Dynamics (November 25 – 26)
November 25: Gold traded in a narrow range, opening at $4,129.87 (a 0.33% decline from the previous close) with a high of $4,144.04 and a low of $4,129.09. The session remained confined within a triangular consolidation pattern, with balanced bullish and bearish momentum.
November 26: Sentiment shifted to oscillatory bullishness. Following a close at $4,130.59 the prior day, gold surged to an intraday high of $4,169.20, posting a 0.82% daily gain. Escalating geopolitical tensions and rising Fed rate cut bets provided fundamental support, while technically, the MACD golden cross persisted with mild expansion of bullish momentum bars, signaling the start of bullish momentum acceleration.
3. Late-Week Strong Rally to New Highs (November 29 – 30)
Gold entered a robust upward phase in the latter part of the week:
November 29: Prices soared sharply to close at $4,218.55, gaining $61.82 (1.49%) intraday with a peak of $4,226.66.
As of 09:00 GMT on November 30: Gold hovered around $4,219 , marking significant cumulative gains from the early-week $4,060 range. Having successfully broken through previous resistance zones, the strong uptrend remained intact.
Overall Assessment
After initial pressure from a strong U.S. dollar, gold broke out of its consolidation range supported by favorable factors including Fed rate cut expectations and geopolitical risks. As bearish momentum waned, bullish forces took full control, driving a sharp weekly rally from the $4,000 support level to above the $4,200 milestone.

GOLD Resistance Ahead!
HI,Traders !
#GOLD keeps growing
But will soon hit a horizontal
Resistance of 4229.11
So after the retest we will
Be expecting a local
Bearish correction !
Comment and subscribe to help us grow !

GOLD Bullish Bias!
HI,Traders !
#GOLD is making a bullish
Rebound from the support
Cluster of rising and horizontal
Support levels so as Gold is
Trading in an uptrend we are bullish
Biased and we will be expecting
A further bullish move up !
Comment and subscribe to help us grow !

Bank holiday what will gold price be on 28 november 2025?1️⃣ Trendline
Ascending Trendline (red channel)
Price is moving inside a short-term ascending channel, forming higher highs and higher lows.
Recently touched the upper boundary → a technical pullback toward the lower boundary is likely.
Descending Trendline (red dotted)
This is a dynamic resistance from the higher timeframe.
Price has just broken above it; a retest is normal → creating a strong confluence area.
2️⃣ Key Support & Resistance
Resistance
4,240 – 4,245 (Fibo 1.618 + major supply zone)
→ This is the upside target if price continues to hold within the ascending channel.
Support 1 (nearest)
4,165 – 4,170 (trendline + MA + previous consolidation zone)
→ This zone is crucial for maintaining the bullish structure.
Support 2 (stronger)
4,095 – 4,112 (Fibo 0.5 – 0.618 + broad demand zone)
→ If Support 1 breaks, price may retrace deeply into this area.
3️⃣ Fibonacci Levels
Fibo 1.0 at 4,162 → currently the main retest point.
Fibo 0.618 at 4,111 → strong confluence with the major demand zone.
Fibo 1.618 at 4,245–4,255 → matches the top resistance → primary bullish target if the trendline holds.
4️⃣ Scenarios
Bullish Scenario (preferred)
If price holds above 4,165 – 4,170
→ it continues following the ascending channel → target 4,240 – 4,245.
Bearish Scenario
Break of the trendline + candle close below 4,165
→ confirms a correction phase → price likely moves down to 4,109 – 4,105.
Trade Ideas
BUY GOLD:
4165 – 4162
Stoploss: 4152
Take Profit: 100 – 300 – 500 pips
SELL GOLD:
4240 – 4243
Stoploss: 4250
Take Profit: 100 – 300 – 500 pips

XAUUSD : H3 Quick Update , 4200$ Time To Back Fall Gold ??Lets Start Our Journey Of Trading Lets Learn And Grow Together Oky Guys Stay Tuned And Stay With Us
In This Anaylsis We Are Waiting For A Confirmation To Sell Xauusd Down Trend Lets Goo Gold And The Second Setup Is We Are Waiting For Bullish Setup From CISD or ORDER BLOCK to Buy Gold Target Will Same Where We Are Selling Stay Strong Be Patient
Thanks 🙏 Can Comment Your Opinion And Kindly Share This Post As Possible Boost And Follow My Account ✅

Gold Set Up Secured 300 PipsPerfect play, with price BOS on the 1h, come down tap into 1h demand, engulf on the 1h and 15m to target BSL

Thanksgiving volatility is limited, precise strategy is key.#XAUUSD OANDA:XAUUSD TVC:GOLD
🙏Today is Thanksgiving, and the market will close early. Gold trading is likely to be quiet, and with insufficient liquidity, it is expected to continue to fluctuate within a narrow range.
📊However, as I said yesterday, core safe-haven demands such as the Fed's interest rate cut expectations and geopolitical factors continue to provide some support for gold prices, and the upward structure has not been broken. The holiday effect is simply limiting significant volatility. Pullbacks are all for building momentum for a subsequent bullish rally.
📈The short-term daily MA5 is moving upward, and the 4-hour moving average and Bollinger middle line are also around 4135, which together with 4125 below form short-term support. On the first pullback to the 4135-4125 area, you can consider a small long position. The key support level to watch remains unchanged at around 4115-4100, near the daily MA10. As long as this level holds, the market's bullish trend will remain intact.
🌈Regarding resistance, continue to focus on the 4170-4180 range, a breakout would lead to an attack on the 4195-4205 range.
✅In summary, our strategy remains unchanged: in the absence of data or news-related factors today, we will primarily focus on buying on dips and waiting for the market to provide opportunities to buy at lower prices.

XAUUSD: Pullbacks to support levels present entry opportunitiesThere’s no need to panic over gold’s pullback—the retracement is healthy and provides a better opportunity to re-enter long positions.
From the daily chart, gold remains firmly in a bullish structure this week. The rally during the Asian session followed by a corrective pullback is a normal consolidation move and does not change the overall bullish trend. It’s important to recognize that this is a retracement, not a reversal.
On the 1-hour chart, the key support zone is $4,142–$4,150, a level that has been repeatedly validated in previous sessions. Therefore, as long as gold’s pullback holds above this zone, I believe the bullish outlook remains intact.
Trading Plan:
Buy at: $4,142–$4,150
Take Profit 1: $4,170
Take Profit 2: $4,200
Stop-loss: Based on individual risk tolerance

gold await breakout#XAUUSD base on H4 past candle and price movement, we expect price to retest 4187 for bearish reverse.
Sell limit 4187, target 4140, SL 4198.
Above the rectangle 4199-4200 holds bullish breakout to buy. Below the down rectangle on H1 closure will continue bearish also.

Gold Trade Set Up Nov 28 2025Price created a new HH on the 1h in Asia session then reversed in London to test 1h demand and bounced off it. Overall i am still bullish. internally price swept low range liquidity so i will want to see 5m-15m engulfing candle to continue higher to BSL

GOLD: Rally followed by a pullbackGold is showing a trend of rallying in the Asian session followed by short-term pressure today. While strongly supported by expectations of a Fed rate cut, it also faces high-level pressure from the weekly and monthly closing. The intraday trend is likely to be a "rally followed by a pullback".
After contesting near the middle band and trend line yesterday, gold chose to break upward. Despite the inertial upward momentum in the Asian session, the MACD indicator on this timeframe has shown a downward divergence, signaling a potential pullback risk. We need to focus on the European and American session trends closely,if the rally fails to sustain after moving higher, a "rally to highs then close lower" pattern is likely to form.
Intraday Short-term Resistance: Around 4195. If gold successfully breaks above this resistance level, it may face pressure in the 4210 - 4230 range.
Short-term Support Levels: Keep an eye on the 4150 - 4160 zone. A breakdown below this level could trigger a further decline to the key support at 4140.
Sell 4185 - 4190
SL 4195
TP 4160 - 4150 - 4140
Buy 4160 - 4165
SL 4155
TP 4180 - 4185 - 4190

XAUUSD Outlook🟦 Market Structure (H4 & D1)
Price continues to respect the ascending structure after a clean CHoCH → BoS → Breakout Retest on H4, indicating that bullish momentum remains intact.
On D1, the market appears to be completing an ABC corrective formation, with wave (3) established and wave (5) potentially extending towards 4,320 – 4,380.
🟦 Liquidity & Key Zones
H4 is approaching a liquidity pocket at 4,155–4,165, which is likely to trigger a short-term pullback before any continuation higher.
On D1, price is moving into a mild imbalance / residual supply region, yet there is no firm rejection so far – suggesting that the broader bullish trend remains favoured.
🟦 Expected Scenario
The higher-probability scenario: a brief retracement into the liquidity zone, followed by absorption and the formation of a higher low → continuation towards 4,245, and potentially 4,380 as wave (5) develops.
Only a decisive break beneath 4,110 would weaken the current bullish structure and invalidate this outlook.

“BOS Confirmed — Demand Retest for Next Bullish Leg🟡 GOLD (XAU/USD) – Bullish Continuation Setup from High Probability Demand Zone 🆙
🔍 Chart Breakdown & Key Insights
Price created a Break of Structure (BOS) to the upside → confirming bullish momentum ✔️
Retested the Demand Line + Support Zone → buyers defending strongly 💪
High Probability POI (previous accumulation zone) remains valid with liquidity swept below → smart money accumulation evidence 💰
Current pullback = healthy retracement into demand before potential continuation
🎯 Targets (With stickers)
🎯 Target Zone Price Region Sticker
TP1 → Retest recent high 4,165 – 4,175 🎯
TP2 → Liquidity above highs / extended target 4,180 – 4,195 🚀💸
TP1 hit possibility is HIGH due to bullish structure 📈
TP2 depends on strength of breakout ⬆️
📌 Trade Idea (High Probability Setup)
🟩 Buy Entry Zone:
➤ 4,120 – 4,130 (pullback entry at support)
🟢 Take-Profit:
➤ TP1: 4,170 – TP2: 4,190
📊 Risk-Reward Ratio: 1:2.5 – 1:3+ ✔️
🧭 Market Structure Sentiment
Factor Outlook
Trend Bullish 📈
Liquidity Upside still available 💧
Smart Money behavior Accumulation & continuation expected 💼
⚠️ Just watch if price breaks below the demand line → would weaken this bullish plan.

XAU/USD Price Outlook – Trade Setup📊 Technical Structure
OANDA:XAUUSD Gold (XAU/USD) remains supported after rebounding from the 4,154–4,160 support zone, keeping the short-term bullish structure intact. Price has broken above the 4,170–4,175 barrier and is now consolidating just below the 4,190–4,196 resistance zone, with buyers looking to extend gains as long as support holds.
The chart shows a bullish continuation pattern:
Support zone: 4,154 – 4,160
Resistance zone / target area: 4,190 – 4,196
As long as gold stays above 4,154, dips into support are likely to attract buyers, with upside potential toward 4,190–4,196. A decisive 4H close below 4,154 would invalidate the bullish setup and expose the 4,130 region.
🎯 Trade Setup
Idea: Buy dips into support, targeting a move toward the 4,190–4,196 resistance zone.
Entry: 4,160 – 4,154
Stop Loss: 4,149
Take Profit 1: 4,190
Take Profit 2: 4,196
Risk–Reward Ratio: ≈ 1 : 2.76
Bias remains constructively bullish while price holds above 4,154–4,160 on a closing basis.
A break below 4,154 would signal weakening momentum.
🌐 Macro Background
According to FXStreet, gold holds firm near a two-week high as rising expectations for a December Fed rate cut continue to support bullish sentiment. Comments from multiple Fed officials confirmed that further easing is a “live option,” helping gold absorb both a modest USD rebound and the broader risk-on tone.
Key drivers:
Fed rate cut expectations reinforced by dovish remarks from Williams, Waller, and Miran.
Kevin Hassett emerging as the frontrunner for Fed Chair, expected to support aggressive rate cuts.
Mixed US data failed to alter the easing outlook, keeping USD capped.
Russia–Ukraine developments keep geopolitical uncertainty in play, maintaining gold’s safe-haven appeal.
Despite improved risk appetite, gold’s bullish bias remains intact due to persistent USD softness and expectations of lower US rates. The fundamental backdrop continues to favor upside moves.
🔑 Key Technical Levels
Resistance zone: 4,190 – 4,196
Support zone: 4,154 – 4,160
📌 Trade Summary
Gold remains in a bullish continuation structure above the 4,154–4,160 support band. As long as this zone holds, the setup favours buying dips and targeting 4,190–4,196 where previous supply pressure may reappear. Fed rate cut expectations and geopolitical tensions underpin the bullish narrative, while risk sentiment limits immediate downside.
⚠️ Disclaimer
This analysis is for reference only and does not constitute trading advice. Trading involves significant risk, and proper risk management is essential.

XAUUSD Roadmap: Multi-Scenario Outlook Into Early DecemberThe chart shows Gold (XAUUSD) on the 4H timeframe approaching a major confluence area:
Price is pressing against a descending trendline resistance (red diagonal).
It is hovering around 4,187–4,190, a short-term supply zone.
Multiple support levels sit below:
4,143–4,131 = important demand / retest zone
4,043 = deeper demand
4,008 = major structural support
You also have an ascending channel, so price is being squeezed between rising support and trendline resistance.
This structure makes a breakout or rejection highly likely in the coming sessions.
🟩 PLAN A – Bullish Breakout & Continuation (Green Path)
Conditions:
Price breaks and closes above the descending trendline.
Bullish candles show momentum continuation.
Expected Movement:
Break above ~4,190–4,200
Retest of the broken trendline
Rally toward the next resistances:
4,209
4,231
4,268 (major target)
Why this plan makes sense:
Structure shows rising lows → bullish pressure increasing.
Breakout above compression often leads to strong follow-through.
Momentum already looks positive given the strong recent push.
Bullish invalidation:
If price falls back below 4,143, Plan A weakens considerably.
🟥 PLAN B – Short-Term Pullback, Then Uptrend Resumes (Pink Path)
Conditions:
Price initially rejects the descending trendline.
Pulls back into the nearby demand zone.
Expected Movement:
Reject around 4,187–4,200
Retrace into 4,143–4,130 demand
Buyers step in
Uptrend resumes, heading again for 4,200 and possibly the 4,231 area
Why this plan makes sense:
Markets often retest key levels before breaking out.
The 4,143–4,130 zone is strong structure + previous liquidity.
When Plan B fails:
A break below 4,130 leads into Plan C.
🟨 PLAN C – Bearish Breakdown Toward Major Support (Orange Path)
Conditions:
Price fails to hold the 4,143–4,130 demand zone.
Bearish momentum increases.
Expected Movement:
Breakdown under 4,130
Acceleration toward deeper liquidity pockets:
4,043
4,008 (major structural support)
Possible bullish reaction at or below these zones
Why this plan makes sense:
Breaking a key demand zone usually triggers a liquidity sweep.
Large downside wicks previously exist near 4,008, showing interest there.
Bearish invalidation:
A reclaim of 4,143 shifts back to neutral/bullish structure.

Gold price analysis November 27XAUUSD – Sellers appear but the uptrend is still intact
Gold is under profit-taking pressure around the 4172 area, causing the increase to temporarily slow down. However, the bullish structure has not been broken yet as the support Trendline below is still respected by the market. In the context of today being Thanksgiving Day in the US, liquidity may decrease and strong fluctuations are unlikely to appear.
The strategy still prioritizes BUY following the main trend, but needs to be patient and wait for the right safe entry point.
📌 Reference trading plan
BUY around: 4153
BUY when there is a price rejection signal at the support zone 4112 – 4090
BUY DCA when there is a clear break of the resistance 4172
🎯 Target: 4250
⚠️ Risk note: The uptrend will be invalidated if the price closes below the Trendline 4090 – then the strategy needs to be reviewed.
