Waiting for Premium Pullback Buy the Bullish Continuation1. Market Context & Structure (H1)
• After a prolonged consolidation phase, Gold has delivered a clear bullish BOS, breaking above the previous highs around 4,24x–4,25x.
• The current impulse originated from the EQL → OB 4,209 zone, confirming active buying flow and a shift into a short-term uptrend.
• Price is now trading above the Premium Zone at 4,265; any pullback into this area is considered a technical retracement within the bullish trend.
2. Key Technical Zones
• Main OB – Demand: around 4,209 → Origin of the current bullish leg; a strong BUY zone if price holds.
• Premium Pullback Buy Zone: 4,265 – 4,270 → First discount after BOS; priority area to look for BUY setups.
• Target 1 – Reaction Zone: 4,322 – 4,323 → Fibo 0.5–0.618 confluence; potential profit-taking / short-term sell reaction.
• Target 2 – Extension Zone: 4,366 – 4,367 (Fibo 1.272) → Bullish extension target and potential liquidity sweep zone.
3. Trading Scenarios
Main Scenario – Trend BUY at Premium Zone
• Wait for pullback to 4,265 – 4,270.
• Look for confirmation: long lower wicks, bullish engulfing, or bullish ChoCH on M15–H1.
• Execute BUY with trend continuation.
TP1: 4,322
TP2: 4,366
• Partial TP at TP1, move SL to BE, hold remainder to TP2.
• Invalidation: H1 close below 4,258 → pause BUY scenario.
Scenario 2 – Deep BUY at OB 4,209
• If price breaks Premium decisively and drops to OB 4,209, do not catch a falling knife.
• Wait for strong bullish reaction and reversal structure (new HL, bullish ChoCH).
TP: 4,265 → 4,322
4. Risk Management Notes
• Avoid FOMO BUY at highs after strong bullish candles.
• SELL setups are only short-term reactions, not the main bias.
• Bias remains BUY on dips as long as H1 holds above 4,209.
Xauusdupdates

XAU/USD 12 December 2025 Intraday AnalysisH4 Analysis:
-> Swing: Bullish.
-> Internal: Bullish.
Analysis and bias remains the same as analysis dated 20 October 2025.
Price has printed as per previous intraday expectation by printing a bearish CHoCH which indicates, but not confirms, bullish pullback phase initiation.
Price is currently trading within an established internal range, however, I will continue to monitor price with regards to depth of pullback.
Intraday expectation:
Price to continue bearish, react at either discount of 50% internal EQ, or H4 supply zone before targeting weak internal high priced at 4,380.990.
Note:
The Federal Reserve’s sustained dovish stance, coupled with ongoing geopolitical uncertainties, is likely to prolong heightened volatility in the gold market. Given this elevated risk environment, traders should exercise caution and recalibrate risk management strategies to navigate potential price fluctuations effectively.
Additionally, gold pricing remains sensitive to broader macroeconomic developments, including policy decisions under President Trump. Shifts in geopolitical strategy and economic directives could further amplify uncertainty, contributing to market repricing dynamics.
H4 Chart:
M15 Analysis:
-> Swing: Bullish.
-> Internal: Bullish.
Price has printed as per analysis dated 02 December 2025 where I mentioned price to trade down to either discount of 50% internal EQ, or M15 demand zone before targeting weak internal high, priced at 4,264.700. This is how price printed.
Price has now tapped into a previous H4 demand zone and is continuing it's bullish trajectory, therefore, I am unable to confirm fractal high.
Current CHoCH positioning is denoted with a blue horizontal dotted line.
Intraday expectation:
Allow price to continue with its bullish trajectory as there has been no pause to confirm fractal high.
Note:
Gold remains highly volatile amid the Federal Reserve's continued dovish stance, persistent and escalating geopolitical uncertainties. Traders should implement robust risk management strategies and remain vigilant, as price swings may become more pronounced in this elevated volatility environment.
Additionally, President Trump’s tariff announcements, particularly against China, are expected to further amplify market turbulence, potentially triggering sharp price fluctuations and whipsaws.
M15 Chart:

Gold: Bullish Gold Holds High GroundThe gold maintained an overall strong upward trend today. After surging in the early trading session, it consolidated at a high level, with prices consistently trading above the recent key resistance levels, reflecting a pronounced bullish bias. Its price action is strongly underpinned by favorable fundamental factors, while technical indicators also signal a clear uptrend.
The price extended its rally in the morning and did not experience a sharp pullback afterward. However, hampered by resistance around the 4290 level in the short term, there was no unilateral skyrocketing movement.
Key Levels:
Resistance Zones: Immediate short-term resistance is concentrated in the 4290–4300 range. A decisive breakout above this zone would pave the way for a further advance toward the next key resistance at 4320–4330.
Support Zones: Support levels have been gradually shifting upward. The 4250 mark, once a resistance level, has now evolved into a key support zone. The core support range stands at 4220–4230, with an additional robust support at the psychological integer level of 4200,a price point that previously triggered a swift rebound, underpinned by ample buying interest.
Trading Strategy:
Buy 4250–4255
SL 4245
TP 4280 - 4290 - 4300
Sell 4295–4300
SL 4305
TP 4280 - 4270 - 4260

XAUUSD Anaysis todayHello traders, this is a complete multiple timeframe analysis of this pair. We see could find significant trading opportunities as per analysis upon price action confirmation we may take this trade. Smash the like button if you find value in this analysis and drop a comment if you have any questions or let me know which pair to cover in my next analysis.

OVERVIEW MARKET XAUUSD #3 I 12/12📌 Market Context
Gold continues to maintain strong bullish momentum after a solid push from lower support levels. Price has now reached a short-term high and is trading near a high-liquidity zone, an area where the market typically shows consolidation or hesitation.
The overall trend remains bullish, supported by the rising trendline.
Key Volume Profile zones are still located much lower, indicating that price is currently trading in a premium zone — not ideal for initiating new buy positions at this level.
Buyers remain in control, but the current highs may trigger a corrective reaction before the next move develops.
📌 Price Scenarios
🔵 Scenario 1: Break Above the High → Bullish Continuation
If price completely breaks the current high with a strong H1 candle:
Nearest upside targets:
4,295
4,305
This scenario follows the trend, but the R:R will not be attractive for buyers entering at these elevated levels.
🔴 Scenario 2: Pullback into Volume Zones → Ideal Buy Opportunities
This is the main and safest scenario: If price fails to break the high and begins to retrace, potential buy zones include:
VAH zone: 4,221
POC zone: 4,200 – 4,206
VAL zone: 4,182 – 4,189
These Volume Profile zones previously generated strong bullish momentum, making them highly likely to produce a reaction or bounce.
🟡 Scenario 3: Trendline Break → Bullish Weakness
If price breaks below the rising trendline: The short-term trend turns weak.
Downside targets:
4,205
4,188
Potentially deeper to 4,170 if strong selling pressure occurs. This scenario only activates when buyers lose control.
📌 Summary
- Price is currently at the highs, making it unsuitable for new buy entries.
- Wait for a pullback into Volume Profile zones to secure better entries and improved R:R.
- The main trend remains bullish, so prioritize buying at support zones — avoid selling unless there is a very clear signal.
- Watch price behavior around VAH – POC – VAL for the safest entry confirmation.

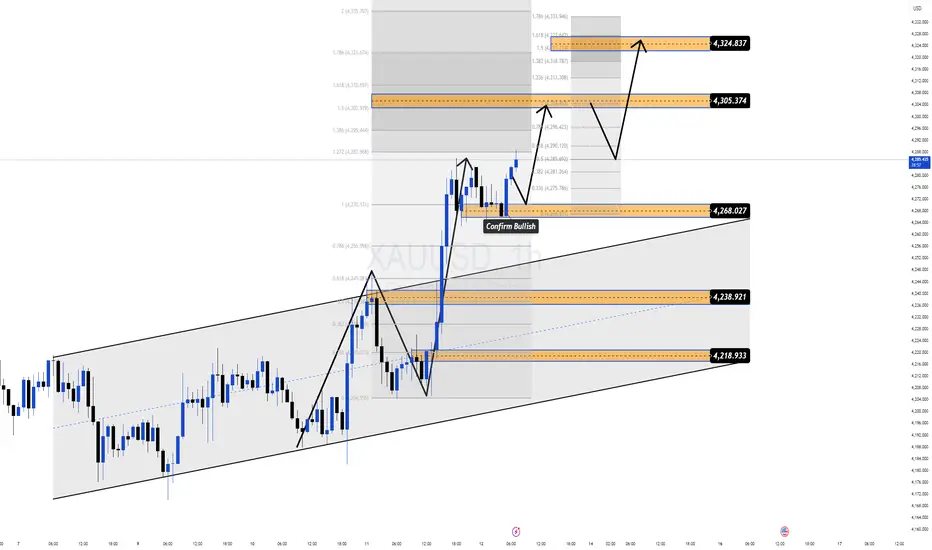
Bullish Confirmation - Buy the PullbackGold has delivered a clear bullish structure break and is currently holding firmly inside an ascending trend channel. The recent impulsive move confirms strong participation from smart money, while the current price action reflects a healthy pullback–continuation phase, not a reversal.
From a fundamental perspective, dovish Fed expectations and a lower-rate outlook continue to support Gold. This keeps downside moves corrective in nature and favors trend-following BUY setups.
📊 Market Structure & MMF Flow (H1)
• Bullish structure is confirmed with Higher Highs and Higher Lows.
• Price is retracing toward demand zones to rebalance liquidity before the next expansion.
• No bearish structure break has appeared so far.
💎 Key Levels – MMF Style
• Primary Buy Zone: 4,268
• Deep Buy Zone: 4,238 – 4,219
• Upside Targets: TP1 4,305 → TP2 4,324
🎯 Trading Scenarios
Primary Scenario – Trend BUY
Alternative Scenario – Continuation above 4,305
🧭 MMF Intraday Bias
Bullish above 4,238
Invalidation below 4,219
Gold Analysis: Fed Cut Ignites Rally Toward $4,300 TargetFXOPEN:XAUUSD GOLD ANALYSIS Bulls Target $4,300 as Fed Cut Sparks Fresh Momentum (Dec 12, 2025)
Welcome back to Trade with DECRYPTERS
🌍 MARKET OVERVIEW
Gold climbed to $4,224 on December 11, hitting a one month high after the Fed’s 25bps cut weakened the dollar and boosted safe-haven demand. Lower real yields and expectations of further easing in 2026 kept bullish momentum strong, supported by heavy central-bank buying led by China.
Geopolitical tensions, including the U.S. seizure of a Venezuelan tanker, added extra upside fuel. Silver also broke records above $64/oz, reflecting broad strength across precious metals. Analysts now eye $4,300–$4,400 into year-end, with volatility likely around upcoming NFP data.
📊 KEY FUNDAMENTALS
• Current Price: $4,268/oz (slightly lower intraday, -0.3%)
• Valuation Context: ~137% above 20-year avg.; ATH at $4,381 (Oct 2025)
• Global Reserves: ~36,000 tonnes; U.S. holds 8,133 tonnes (23% of total)
• Supply (Q3 2025): 1,313 tonnes — mine output 825t (+1.5% YoY) + recycled 344t (+6% YoY)
• Demand (Q3 2025): 1,313 tonnes (+3% YoY) driven by central-bank buying (220t Q3; 634t YTD) & strong investment flows
• YTD Performance: +61%, outperforming S&P 500 by 2.4×
• Outlook: Structural bullishness intact; 12-month forecasts near $4,465/oz
🌐 GEOPOLITICS
1️⃣ Russia Ukraine War
• Persistent conflict, sanctions, and NATO tensions keep volatility elevated
• Safe-haven demand remains strong
2️⃣ U.S. China Trade Tensions
• Trump’s 100% tariffs reignite the trade war, weakening USD
• BRICS pushback & China’s gold accumulation accelerate de-dollarization
3️⃣ Middle East Instability
• Gaza escalation & Iran-backed proxy attacks heighten global risk
• Temporary dips but repeated surges above $4,000
4️⃣ De Dollarization & BRICS Strategy
• Central banks accelerate gold buying to hedge USD weaponization
• 95% of global central bankers plan further gold purchases in 2026
5️⃣ Global Debt & Systemic Risks
• $324T global debt and U.S. $2T deficits fuel inflation fears
• Gold gains long-term support as trust in fiat declines
🔄 RISK-ON / RISK-OFF ANALYSIS
Gold’s +61% YTD surge reflects classic RORO flows, supported by stable yields & a weaker dollar. With the 10-year at 4.16%, opportunity costs stay low. Only a rise toward 4.5% could pressure prices back toward $4,000.
The DXY at 98.38 enhances gold affordability, where each 1% drop historically adds 0.5–1% to gold, amplified by 500+ tonnes of central bank buying.
Despite a low VIX (15.41) and strong equities (+30% YTD), gold continues to rally an unusual divergence driven by tariffs, inflation risk, and persistent geopolitical tensions. A VIX spike above 20 typically accelerates gold, while deep risk-on conditions may cause a 10 to 12% pullback.
📰 KEY INSIGHTS FROM CREDIBLE SOURCES
• Goldman Sachs reaffirmed a $4,900 target citing massive central-bank demand
• Gold & silver jumped ~1% on Fed dovishness & liquidity expansion (TGA -$78B)
• Fed plans to buy short end Treasuries → weaker USD → stronger gold
• Trump’s “run it hot” growth narrative boosts expectations of lower real yields
✅ CONCLUSION
Gold remains strongly bullish as macro conditions, Fed easing, and central bank accumulation create a solid structural floor above $4,150. Pullbacks are temporary, while geopolitical tensions and tariff-driven USD weakness support moves toward $4,300 - $4,400.
Subdued real yields keep opportunity costs low, and even in risk-on markets, gold's resilience highlights deep institutional demand. Momentum favors upside continuation into year-end unless yields spike aggressively.
🙌 SUPPORT THE ANALYSIS
If this breakdown added value to your trading:
👍 Drop a like
💬 Comment your levels
📈 Share your charts with the community
Let’s grow together.
Best Regards,
M. MOIZ KHATTAK | Founder - TRADE WITH DECRYPTERS

XAUUSD H1 Volume Profile and Key Price AreasXAUUSD H1 – Volume Profile and Key Price Areas
Gold remains in a strong uptrend, with the primary strategy focused on buying pullbacks
PRIORITY SCENARIO – MAIN STRATEGY
Buy-the-dip approach aligned with the dominant trend using Volume Profile levels
Expected buy zone: around 4253 based on VAH
Short-term range to monitor: 4263 – 4285
Price expectation: rebound from VAH toward the upper range before further expansion
Position management:
If price holds above the 4263 area and shows clear bullish reaction, maintaining long exposure remains favorable.
If price is strongly rejected near 4285, risk should be reduced as this zone represents an important short-term resistance.
ALTERNATIVE SCENARIO – SECONDARY SETUP
Short-term countertrend opportunity at an extended resistance level
Sell zone for the alternative scenario: around 4310 at the Fibonacci extension
This setup is only considered if clear rejection signals appear at the level
KEY REASONS
The bullish structure on the H1 timeframe remains intact
Volume Profile highlights the VAH near 4253 as a high-probability reaction zone
The 4310 area represents an extended resistance suitable for profit-taking or short-term pullback reactions
MACRO CONTEXT
The Federal Reserve continues its rate-cutting cycle and maintains a dovish stance, putting pressure on the US dollar and supporting gold prices.
Geopolitical tensions and concerns about US economic slowdown further reinforce safe-haven demand.
Markets are now focused on the upcoming Nonfarm Payrolls report, where weaker data could drive further upside, while stronger data may trigger a short-term correction.
RISK MANAGEMENT AND MONITORING
Avoid chasing price while gold trades within the 4263 – 4285 range.
The bullish scenario becomes invalid if price breaks clearly below the support area beneath the VAH.
Expect increased volatility around major economic data releases and manage exposure accordingly.

Gold Price Prediction📊 Technical Structure
FOREXCOM:XAUUSD Gold retreated from the multi-week high at $4,285–4,286, pulling back toward the $4,270–4,275 area as buyers took profit near the upper resistance. Despite the short-term dip, the overall structure remains bullish, with price still holding above the major support and trading within a rising framework.
Price may retrace toward the $4,254–4,250 support zone, which aligns with the short-term trendline. A potential “W-shaped” rebound from this zone could send XAU/USD back toward the $4,280–4,284 resistance zone. As long as gold holds above $4,250, the bullish structure remains intact. A break below $4,245 would invalidate the setup and expose deeper downside.
🎯 Trade Setup (Bullish Bias)
Idea: Buy on a pullback into support, targeting a retest of resistance.
Entry: 4,254 – 4,250
Stop Loss: 4,245
Take Profit 1: 4,280
Take Profit 2: 4,284
R:R Ratio: ~1 : 3.26
If price does not retrace into the support zone, an alternative is to buy only after a strong rebound above 4,266–4,268.
🌐 Macro Background
Gold is seeing mild pullback mainly due to risk-on sentiment as equity markets extend gains, reducing safe-haven demand. However, the downside remains limited because:
The Federal Reserve delivered another dovish rate cut.
Lower interest rates weaken the USD and reduce the opportunity cost of holding gold, providing medium-term support.
Powell highlighted uncertainty in the labour market, reinforcing expectations that more policy easing may come next year.
Geopolitical tensions persist, with Russia-Ukraine peace talks stalled, keeping safe-haven demand from collapsing completely.
Overall, risk appetite is pressuring gold short-term, but the broader fundamental backdrop remains supportive for bulls.
🔑 Key Technical Levels
Resistance Zone: 4,280 – 4,284
Support Zone: 4,254 – 4,250
Invalidation Level (bullish setup fails): 4,245
📌 Trade Summary
Gold is correcting from multi-week highs but remains within a bullish structure. A pullback into 4,254–4,250 is a favourable zone to seek long opportunities, aiming for 4,280–4,284. The bullish bias remains valid unless price breaks below 4,245.
⚠️ Disclaimer
This analysis is for reference only and does not constitute trading advice. Trading involves significant risk, and proper risk management is essential.

Market Accumulating Liquidity, Two Clear Scenarios for TodayGold continues to move within a bullish structure, but short-term order flow shows distribution inside the OBS Sell Zone 4,236. Price is currently trapped in the middle of the range, suggesting the market may need a liquidity sweep before choosing its next direction.
Fundamentally, expectations of a dovish Fed still support gold on deeper pullbacks — but intraday, the two MMF flow setups are extremely clear.
📊 Technical Outlook (MMF Flow – H1)
🔸 OBS SELL ZONE: 4,236
• Strong reaction on first touch → supply confirmed
• Downtrend line converges here → high probability of liquidity traps
🔸 OBS BUY ZONE: 4,197
• First key demand zone below
• Aligned with channel support → likely bullish reaction
🔸 Sell-side Liquidity: 4,181
• If price sweeps this area → ideal reversal point
🔸 Premium SELL Reaction Zone: 4,284
• If gold expands upward → priority area for distribution / short-term correction
🎯 Two Main MMF Scenarios
Scenario 1 – SELL reaction → BUY trend continuation
• Price retests 4,236
• Bearish reaction → pushes price toward 4,197 – 4,181
• Reversal signal appears
• Targets: 4,236 → 4,284
➡️ This is the cleanest play following today’s liquidity flow.
Scenario 2 – Direct bullish expansion
• Price breaks and closes above 4,236
• Retests this zone
• Expands toward 4,284
➡️ Requires strong bullish momentum — no confirmation, no trade.
🧭 MMF Intraday Bias
• Bullish as long as price holds above 4,197
• Neutral → Bearish only if price closes below 4,181 (failed liquidity sweep)
The market is preparing for a breakout — let liquidity do its job before choosing direction.

XAUUSD – Post FOMC | ChumTrades Daily PlanXAUUSD – Post FOMC | ChumTrades Daily Plan
Market Context
• Strong rejection at 4245 → buyer momentum weakening.
• Prefer selling at premium zones, buying at lower demand zones.
• Expect gold to continue ranging within 4245 ⇆ 4180.
🔻 SELL Zones
1) Main SELL Zone: 4238–4245
Entry: 4238–4245
SL: 4255
TP1: 4225
TP2: 4204
TP3: 4180
2) SELL SCALP: 4230–4233
TP: 4218–4210
SL: 4237
🟢 BUY Zones
1) BUY SCALP: 4188–4190–4192
TP: 4210 → 4218 → 4230 → 4240
SL: 4278
2) Main BUY Zone: 4163
SL: 100 pips
TP: 100 / 200 / 300 pips
RR: 1 : 3
🎯 Bias
• Below 4245 → market favors sideway–down movement.
• Only a breakout above 4265 signals a potential bullish shift.
If you find this plan helpful, please leave a like and follow ChumTrades for daily plans & realtime updates!
Feel free to drop your own market view in the comments so we can discuss together.

ChumTrades XAUUSD M15 intraday outlook Market Context
Price is currently ranging in a very tight consolidation.
Momentum is weak → market favors intraday range trading rather than chasing breakouts.
Short-term structure remains intact; focus on price reaction at key levels.
Daily Strategy
Main approach: trade the range, trade the reaction.
Buy at predefined support / Fibonacci zones, sell at clear resistance.
If a breakout occurs, wait for a retest before following the move.
Avoid entries in the middle of the range.
Key Buy Zones
4246 – 4244 (Fibo 0.5)
4236 – 4233 (Fibo 0.618)
4210 – 4208 (deep support reaction)
❌ Bullish structure invalidation:
M15 close below 4200
Key Sell Zones
4300 – 4305 (psychological resistance)
4310 (Fibonacci extension – reaction sell)
Special Notes (Friday)
No major economic news today, but it is Friday – end of week.
Price action may become choppy and unpredictable, especially during the US session (a pattern seen in recent weeks).
Risk management is key:
Focus on short-term trades
Take profits early
Avoid holding positions over the weekend.
Good luck bro!

12.11 Gold (Euro-US Session) - Bearish Trading PlanHello traders,
Core Logic: Fed's hawkish rate cut suppresses gold; bearish sentiment dominates.
I. Bearish Drivers
Key factors for gold weakness:
• Dovish Hopes Crushed: Fed signals only 1 more 2025 cut, dashing easing cycle expectations.
• Policy Uncertainty: Powell's "patient" tone + 3 dissents (most since 2019) boost caution.
• Profit-Taking: "Buy rumor, sell fact" triggered Asian session pullback, extending bearishness.
II. Key Levels
Type Level Rationale
Short Entry 4215-4220 1H EMA13 + rebound resistance
Key Resistance 4227 Asian session pre-dive peak
TP1 4172 Short-term core support
TP2 4153 Medium-term support
TP3 4143 Recent range low support
Stop-Loss 4242 Above intraday high
III. Trading Strategies
1. Primary: Short on Rebound
Enter short at 4218-4220 (4215-4220 range with bearish candles: engulfing/long upper wicks).
• TP Plan: 4172 (cut 40%) → 4153 (cut 40%) → 4143 (close 20%)
• SL: 4242
2. Secondary: Short on Breakdown
Enter short at 4198-4200 if gold breaks 4200 (with 30%+ volume surge).
• TP: Same as primary (4172→4153→4143)
• SL: 4215
IV. Core Risk Rules
• Max position per trade: ≤5%; no averaging down
• Trigger SL → exit immediately; no SL adjustments
• If gold closes above 4242 for 15 mins: close all shorts, no new trades
• Avoid positions during US data/Fed speeches
V. Key Notes
1. Follow Fed-driven trend; use tech levels for entry/exit.
2. Close positions early if price spikes through TPs.
3. Valid for Dec 11 Euro-US session; adjust for market structure changes.
Good Luck!
LESS IS MORE!

XAU/USD Elliott Wave Analysis: Potential Bearish Reversal OANDA:XAUUSD PEPPERSTONE:XAUUSD ICMARKETS:XAUUSD
The chart suggests that Gold Spot/U.S. Dollar (XAU/USD) has completed a major correction pattern and is now on the verge of a significant downward move.
Major Correction (A) ➡️ (B):
The price action from the major peak appears to be forming a complex correction, with the current phase completing the major (B) wave.
The sharp drop to the low around November 1st is labeled as a major (A) wave.
The subsequent rally is labeled as the major (B) wave, which is currently subdividing.
Subdivision of Wave (B): The corrective rally (B) is showing signs of completion as a smaller ABC pattern:
o Wave A (of B): A strong 5-wave impulse (labeled 1-2-3-4-5) completed in mid-November.
o Wave B (of B): A correction followed this high.
o Wave C (of B): The current rally is the final leg, Wave C (of B), aiming for the final target.
• Critical Reversal Target for (B) Wave: The chart anticipates the completion of the final Wave C (of B) at a specific price point, coinciding with a key Fibonacci level and trendline resistance:
61.80% Fibonacci Retracement at $4,313.88
This $4,313 zone is the high-probability reversal point before the major downside move begins.
📈 Technical Levels and Trendlines
Major Resistance (The Reversal Zone):
Upper Red Trendline: This descending trendline connects the initial peak with the top of the internal Wave (B), serving as strong dynamic resistance.
Key Price Target: The $4,313.88 level is the projected apex of the rally.
Understood. Here is the full analysis and titles for your post, presented in English, as requested.
📉 XAU/USD Elliott Wave Analysis: Potential Bearish Reversal from $4,313
🌊 Wave Count Interpretation (Elliott Wave)
The chart suggests that Gold Spot/U.S. Dollar (XAU/USD) has completed a major correction pattern and is now on the verge of a significant downward move.
Major Correction (A) ➡️ (B): The price action from the major peak appears to be forming a complex correction, with the current phase completing the major (B) wave.
The sharp drop to the low around November 1st is labeled as a major (A) wave.
The subsequent rally is labeled as the major (B) wave, which is currently subdividing.
Subdivision of Wave (B): The corrective rally (B) is showing signs of completion as a smaller ABC pattern:
Wave A (of B): A strong 5-wave impulse (labeled 1-2-3-4-5) completed in mid-November.
Wave B (of B): A correction followed this high.
Wave C (of B): The current rally is the final leg, Wave C (of B), aiming for the final target.
Critical Reversal Target for (B) Wave: The chart anticipates the completion of the final Wave C (of B) at a specific price point, coinciding with a key Fibonacci level and trendline resistance:
61.80% Fibonacci Retracement at $4,313.88
This $4,313 zone is the high-probability reversal point before the major downside move begins.
📈 Technical Levels and Trendlines
Major Resistance (The Reversal Zone):
Upper Red Trendline: This descending trendline connects the initial peak with the top of the internal Wave (B), serving as strong dynamic resistance.
Key Price Target: The $4,313.88 level is the projected apex of the rally.
Major Support (The Target Zone):
Lower Green Trendline: This ascending trendline connects the key lows and represents the potential final target for the upcoming decline.
Target Price Zone: The final target for the major (C) wave is indicated near the $3,826.25 level.
🎯 Trading Strategy Implication
Imminent Move: The price is completing the final internal wave towards the $4,313.88 reversal zone.
Short Entry: The ideal short-entry zone is near the $4,313.88 level, with a tight stop-loss placed just above the upper red trendline to manage risk.
Profit Target: The anticipated sharp decline, labeled as the massive (C) wave, targets the lower green trendline around $3,826.25, offering a substantial risk/reward opportunity.
Disclaimer:
This analysis is for educational purposes only and is based on Elliott Wave Theory and technical indicators. It is not financial advice. Trading foreign exchange, cryptocurrencies, and commodity futures involves significant risk of loss and is not suitable for all investors. Past performance is not indicative of future results.
Always do your own research

Gold - This is the bullrun top!⚰️Gold ( OANDA:XAUUSD ) is slowly reversing now:
🔎Analysis summary:
Starting back in the end of 2015, Gold established another major bullish cycle. Ever since the rounding bottom breakout, Gold has been rallying higher and higher. But at this exact moment, Gold retests major resistance and is slowly starting to create a reversal.
📝Levels to watch:
$4,000
SwingTraderPhil
SwingTrading.Simplified. | Investing.Simplified. | #LONGTERMVISION

XAU/USD Clean Breakout From Consolidation ZoneGold has officially broken out of the long-held consolidation range between 4,200 – 4,240, confirming bullish strength after taking out the internal liquidity resting at ≈4,262. The aggressive impulse that drove price above the blue zone shows a clear shift in order-flow, suggesting buyers are now in firm control.
The breakout also validates the broader bullish narrative: price respected the H4 demand zone around 4,160 – 4,175, accumulated orders within the intraday range, and then expanded upward once liquidity was cleared. As long as price holds above the former consolidation zone, the market structure remains bullish.
With liquidity now taken and momentum clearly favoring the upside, gold is positioned to continue reaching for the next higher zone around 4,310 – 4,330, where major resting orders and a higher-timeframe supply region sit.

Gold: Test 4280 nowGold prices pierced the short-term resistance at 4260 and then charged directly toward the 4280 high in line with our ideas earlier, but encountered strong resistance at 4280 and retreated thereafter. It is critical to monitor the breakout potential of the 4280 level now, and impulsive chasing of upward moves is not recommended.

XAUUSD-Breakout to the upsideAfter breaking through 4250, gold has now risen above 4270. Watch the 4280 resistance level; a successful break above this level could lead to 4300-4320.
Pay attention to the resistance above. The market is currently very risky; be wary of a sharp drop. However, the bullish trend remains strong. We can use the 4250-4260 support level as a buying opportunity on pullbacks.
For more market analysis, please see my link.

Can Gold Sustain Momentum Above 4250 for the Next Leg Up?🔥 XAU/USD BREAKOUT ALERT! 🚀
Gold vs. U.S. Dollar – Metals Market Opportunity (Day/Swing Trade)
Blueprint for the bullish breakout setup with pending order strategy!
🟡 Asset:
XAU/USD – “GOLD vs U.S. DOLLAR”
Metals Market Opportunity Blueprint (Day / Swing Trade)
🔶 TRADE PLAN – Bullish Breakout Pending Order ✨
Gold is building momentum and preparing for a key breakout structure.
The bullish continuation plan remains valid only after price breaks and holds above 4250, confirming fresh demand flow.
📌 Entry:
You can enter at any price level after the confirmed breakout @ 4250,
or use stack-layering entries based on your preferred “Thief layering technique”.
🔻 STOP LOSS (Risk Advisory Inside)
SL Zone: Around 4170 (Thief SL)
📝 Note:
Dear Ladies & Gentlemen (Thief OG’s) — adjust your SL according to your own strategy and risk comfort.
This is not a mandatory level; you can protect your capital in your own style.
🎯 TARGET – Resistances, Police Barricade Zone & Profit Escape Route
Market structure shows a strong resistance cluster + potential trap area ahead.
📌 Primary Target: 4340
This zone aligns with:
Strong police barricade resistance
Overbought pressure zones
Liquidity trap pockets where price may reverse
📝 Note:
Dear Ladies & Gentlemen (Thief OG’s), you are NOT required to use my TP.
Make your money and take it at your own pace and your own risk.
🌍 RELATED PAIRS TO WATCH (Correlated & Inversely Correlated Markets)
Monitoring correlated markets helps confirm breakout strength, money flow, and sentiment.
🟦 1. TVC:DXY (U.S. Dollar Index)
Inverse correlation with XAU/USD.
If DXY weakens, GOLD often surges faster.
If DXY strengthens, GOLD upside may slow down.
🟩 2. SP:SPX / PEPPERSTONE:NAS100 (US Indices)
Risk sentiment gauge.
If indices drop → flight-to-safety boosts GOLD.
If indices rally strongly → GOLD may stall or pull back.
🟪 3. TVC:SILVER / XAGUSD
Commodity correlation.
Silver breakout usually supports GOLD momentum confirmation.
Watch for synchronized metal market buying.
🟥 4. TVC:US10Y (10-Year Treasury Yield)
Bond yields affect GOLD heavily.
Falling yields → lower opportunity cost → GOLD bullish.
Rising yields → limited GOLD upside.
🟧 5. TOCOM:DBAIE / OIL
Macro inflation correlation.
Rising oil = inflation risk = GOLD safe-haven bids.
Sharp oil drops = deflation fear = GOLD might contract.
🧭 KEY POINT SUMMARY
Breakout confirmation only after 4250
SL flexibility encouraged based on trader strategy
Take-profit zone at 4340 aligns with trap & resistance
Cross-asset correlation strengthens directional conviction

XAUUSD Analysis todayHello traders, this is a complete multiple timeframe analysis of this pair. We see could find significant trading opportunities as per analysis upon price action confirmation we may take this trade. Smash the like button if you find value in this analysis and drop a comment if you have any questions or let me know which pair to cover in my next analysis.

Gold Intraday Market Recap & Trading StrategyThe gold trended with a bullish bias in high-range consolidation following a dip and rebound today. After the Federal Reserve's rate cut announcement in the early hours, prices surged sharply before paring some gains, yet they steadfastly held above the key 4200 level throughout the session. During the Asian trading session, London gold hit an intraday high of 4247.50, then pulled back to an intraday low of 4204.04.
Having previously broken out of the 4170–4220 consolidation range, prices once rallied to 4239 right after the rate cut, maintaining a strong posture in high-level trading without being disrupted by the short-term pullback. The bullish momentum is jointly underpinned by fundamental tailwinds from the rate cut and stabilizing technical signals.
Key Levels:
Resistance Zones: The immediate key resistance lies in the 4250–4260 range. A decisive breakout above this zone would likely pave the way for a further advance toward 4280–4300.
Support Zones: The 4200 mark acts as a robust intraday support. Further downside support is anchored in the 4175–4180 range, a level that has proven its resilience through multiple tests in previous sessions.
Trading Strategy:
Buy 4200 - 4210
SL 4190
TP 4240 - 4250 - 4260
Sell 4260 - 4270
SL 4280
TP 4230 - 4220 - 4210

Gold Trade Set Up Dec 11 2025Price made a HH yesterday and came back down in Asia session failing to reach demand and leaving internal SSL that got swept to now approach London high, which i will watch to see if price can sweep to then make internal 5m bearish engulfing candle to target Asia lows and demand before continuing its bullish trend

Gold Price Action Support Resistance AND Breakout ProjectionOverall Structure
The chart shows a rising channel (parallel blue lines). Price is currently trading inside the channel, near the middle.
There is also:
A major resistance zone at ~4245–4246 (red line).
A support zone around 4168–4191 (red shaded zone).
A proposed bullish projection (green arrow) if price bounces from support.
---
🔍 Key Technical Elements
1. Rising Channel
The upward-sloping blue lines indicate:
Higher lows forming (support trendline)
Higher highs forming (resistance trendline)
This typically suggests short-term bullish momentum, unless the lower trendline breaks.
2. Support Zone (4168–4191)
The red shaded area shows a demand zone:
Buyers previously stepped in here multiple times.
Long wicks indicate strong buying pressure on dips.
The handwritten red line indicates a possible pullback into this zone before continuing higher.
3. Resistance Zone (~4245)
The chart labels it as "TARGET POINT":
Last major swing high.
Horizontal resistance.
Top of the rising channel.
This is the next major obstacle for bulls.
4. Price Behavior Right Now
Current price: 4217.98
Price is moving sideways after a pullback.
Still above the midline of the channel.
No clear breakout yet.
This indicates indecision before the next move.
---
📈 Possible Scenarios (Educational Only)
✔ Bullish Scenario (matches chart drawing)
Price dips into the 4168–4191 demand zone.
Finds support.
Moves upward toward 4245 resistance.
This aligns with:
Rising channel structure
Demand zone interest
Momentum bias
❌ Bearish Scenario
Price fails to bounce from 4168–4191
Breaks below the lower channel line
A deeper correction could follow
This would invalidate the upside projection.
---
📘 Summary
The chart suggests a bullish continuation pattern as long as the price stays above the 4168 zone.
The marked “target point” is the resistance around 4245.
