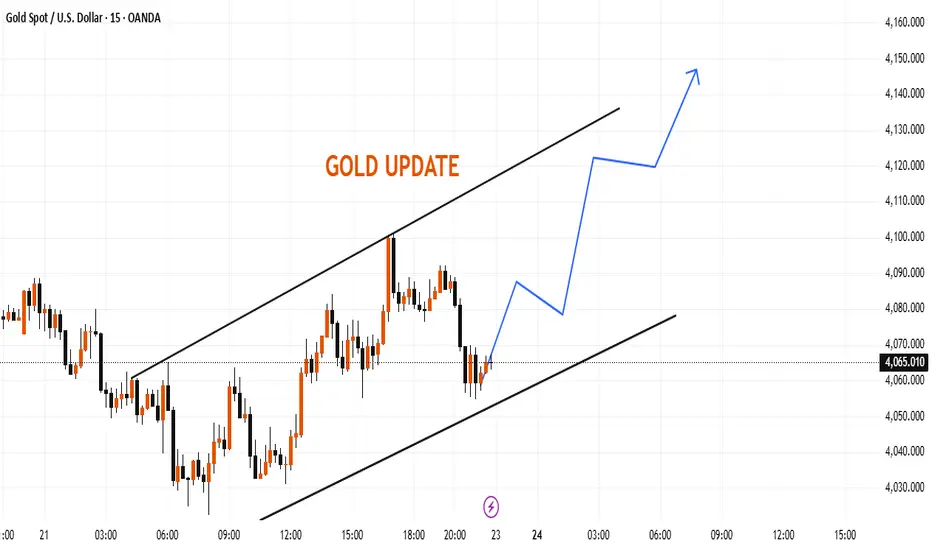
XAUUSD (Gold) Is heading UPWARDS! - time to buyA few days back XAUUSD (Gold) was in a short term downtrend but finally broke out of it. The price broke through the downward channel to the upside, the price also held onto strong support (the white trendline which acted as a support level). The price tested the white trendline several times but kept bouncing back each time it hit the support zone. The price then broke through all recent resistance zones and will very likely hit the next resistance zone which is marked as the "Take profit" area. BUY GOLD NOW!
Xauusdupdates

Gold Trade Set Up Nov 25 2025Gold remains bullish on the 4h making HH/HL and has already swept SSL in London session followed by a 1h engulfing candle so i will be looking for internal bullish structure on the 5m-15m to take buys to higher BSL levels

GOLD: Consolidation Won’t Change the Bullish TrendGold is showing a consolidative upward trend today. The intraday price first dipped to a low, then surged upward before pulling back, with bulls and bears engaging in fierce tussles around key levels.
Meanwhile, influenced by the confluence of factors such as interest rate cut expectations and geopolitical risks, it is expected to fluctuate within the range of 4,120 - 4,160 in the short term, and the underlying logic for its medium-to-long-term upward movement remains intact.
In the near term, close attention should be paid to the breakout of the 4,150 resistance level. If the price can stabilize firmly above this level, it may unlock new upside momentum to challenge the 4,200 mark.
On the contrary, if it continues to face resistance, the price may pull back to test the support around 4,100, or even the 4,040 - 4,060 support zone.
Watch out for U.S. economic data tonight! Better-than-expected figures could dampen rate-cut hopes, boost the dollar, and pressure gold,consider trimming positions or taking profits early. If data is weak, gold may break resistance: add positions in line with the trend but don’t chase highs.
Buy 4120 - 4125
SL 4115
TP 4145 - 4155 - 4165
Sell 4155 - 4160
SL 4170
TP 4130 - 4120 - 4110

Structure Turns Bullish, Yet Volatility Warns of Traps1. Recap of Yesterday’s Outlook
In yesterday’s analysis, I said very clearly:
➡️ “As long as 4100 resistance is intact, the structure remains bearish.”
And indeed, I followed that bias — I sold the rally around 4075, the trade moved 150 pips in my favor, but without follow-through.
I closed it with an insignificant 30-pip profit, a good decision considering that holding it would’ve led straight into a stop-loss hit.
Price action justified the caution.
2. Has the Structure Shifted?
The key question today:
➡️ Has the market turned bullish?
So far, yes — technically, the structure has shifted.
Why?
- The 4100 resistance was broken strongly, with conviction.
- The breakout wasn’t just a wick; it held.
- Momentum flipped short-term direction
Under normal conditions, this would imply:
➡️ Upside continuation toward 4200.
And the logic is simple:
- What was resistance becomes support.
- So the 4100–4080 zone is now the bullish line in the sand.
3. But This Is Gold These Days… Volatile & Erratic
The problem is not the technicals — the problem is behavior.
Gold recently has been:
- Hysterical in volatility,
- Featuring massive fakeouts,
- Delivering 700–1500 pip swings within hours,
This makes the breakout valid, but not necessarily trustworthy without confirmation.
And here’s the key:
➡️ If Gold drops back under 4080, the structure instantly turns bearish again.
This is why blindly buying the breakout is dangerous.
Patience and confirmation matter more than ever.
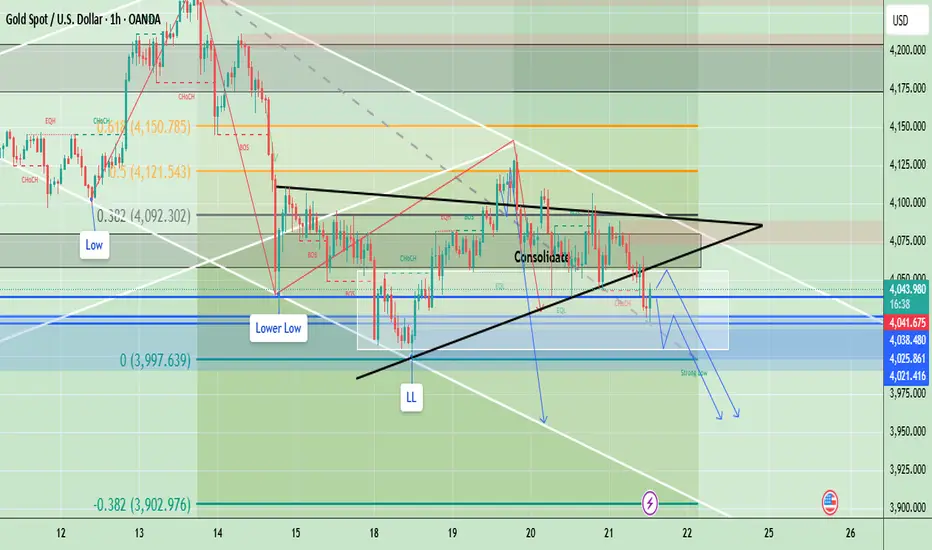
4. Technical Outlook – Levels That Matter
Bullish structure (for now):
- 4100–4080 is support
- Above this zone → bullish
- Target → 4200
Bearish trigger:
- Break back below 4080 → failed breakout
- Structure returns bearish
- Possible revisit of 4000, then 3900
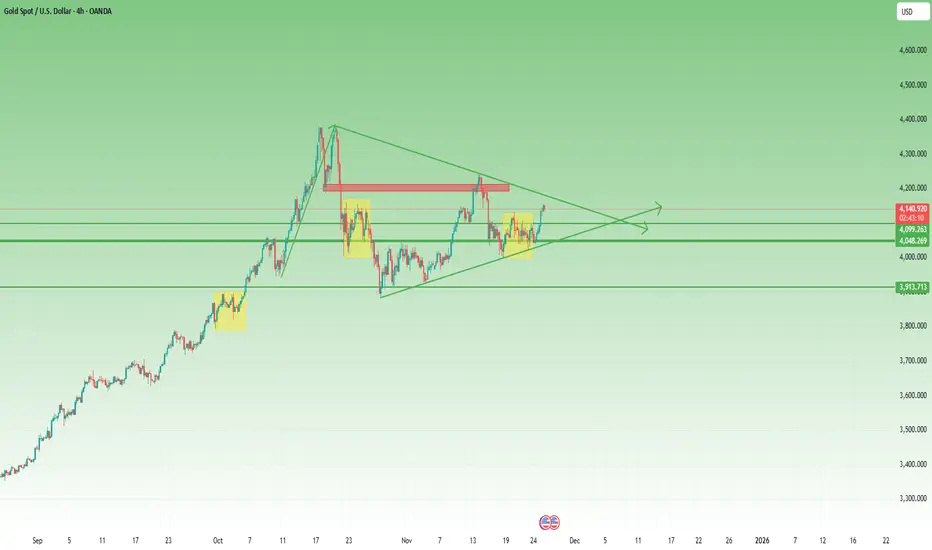
Bigger picture:
Gold is still contained in a large triangle formation since the all-time high.
Breakouts inside a triangle are often traps until the triangle itself resolves.
That’s why flexibility is essential.
5. Trading Plan – Short-Term, Flexible, and Level-Based
Because Gold is in a triangle and volatility is intense:
- Trade short-term, not swing positions.
- Look to buy dips into 4100–4080, but only with clear reversal signs.
- Don’t hold bias stubbornly — adapt candle by candle.
Clear plan:
Bullish scenario:
- Buy dips around 4100- 4110 only if reversal signs appear
- Target 4200
Bearish scenario:
- If price falls back below 4080, forget the breakout —
bearish again
- Potential drop toward 4000, then lower
This is one of those moments where discipline beats prediction.
6. Conclusion – Bullish, but With an Asterisk
In summary:
- The breakout above 4100 is real → bullish bias active
- Target: 4200
- BUT the structure remains fragile due to recent volatility
- Below 4080 = bearish again
- Triangle structure adds uncertainty
- Short-term trading and flexibility are essential these days
The trend says bullish, the behavior says be careful.
Gold Rebounds: 4100 Test Fails, Awaits RetryGold is in a rebound trend, attempting to break through 4100. The first breakout attempt failed, with prices pulling back to around 4090—awaiting fresh bullish momentum for another breakout
Buy 4080 - 4085
TP 4100 - 4110 -4120
Accurate signals updated daily. They serve as a reliable guide for trading issues – feel free to refer to them. Hope they help!

Gold Breaks Out of Consolidation, A New Bullish Cycle Incoming?Gold has shown a significant recovery, breaking out of the multi-day sideways range between 4,00x–4,10x. Instead of collapsing below 4000, strong buying pressure stepped in — pushing price back above 4100, signaling that the market may be choosing an early bullish breakout ahead of expectations for a potential FED rate-cut cycle.
📊 Technical Outlook (H1/H2)
1. Structure
Gold has officially broken out of the symmetrical triangle formation.
Price is now printing higher highs – higher lows, confirming short-term bullish structure.
2. Key Levels
BUY Zone 1: 4,095 – 4,100 (Fibo 0.236 + intraday demand)
BUY Zone 2: 4,118 – 4,122 (Fibo 0.382 + breakout retest zone)
Target Zone: 4,187 – 4,195 (Fibo 1.618 extension)
3. Expected Price Action
After rejecting the 0.786 Fibo, a corrective pullback is expected.
A retest of 4,118 or deep pullback to 4,095 is highly probable before the next bullish leg.
As long as price holds above 4,095, bullish bias remains intact.
🎯 Trading Plan — MMF Style
Primary Scenario – BUY the Retracement
BUY 1: 4,118 – 4,122
SL: 4,107
TP: 4,150 → 4,168 → 4,195
BUY 2 (safer): 4,095 – 4,100
SL: 4,082
TP: 4,150 → 4,170 → 4,195
If price clears 4,165, extended targets toward 4,19x–4,21x become possible.
Secondary Scenario – SELL only on strong rejection
Selling is not preferred in the current structure.
Only consider shorting if price forms a false breakout around 4,19x and confirms a bearish BOS on H1.
🧠 MMFLOW VIEW
Gold is showing early signals of shifting out of its medium-term downtrend and transitioning into a new bullish phase. With both technical breakout confirmation and fundamental support (rate-cut expectations) aligning, the path of least resistance is to the upside.
“In a rising market, missing the trend is far more costly than entering slightly early.”

Gold Bearish Structure Continues – Sell Levels UpdatedGold remains bearish after rejecting from the upper consolidation boundary and continuing its pattern of lower highs and lower lows. Price has now broken below the triangle-consolidation zone and is retesting the lower boundary around 4038-45 which aligns with previous liquidity. As long as price stays below the triangle resistance and fails to reclaim 4080 momentum favors further downside. The next bearish targets lie below the Strong Low zone aiming toward deeper liquidity and Fibonacci extensions.
✅ Bias: Sell below 4080
- Sell Zone: 4045 - 4055 (Retest of broken consolidation + minor supply)
- Stop Loss: 4082 (Above triangle resistance + structure break)
- Take Profit: 4025 - 4008 - 3988
- Invalidate: 4082 (Above triangle resistance + structure break)
Note
Please risk management in trading is a Key so use your money accordingly. If you like the idea then please like and boost. Thank you and Good Luck!
XAU/USD: Gold Uptrend - Buy at 4,090 & 4,044 USD📊 Market Structure
Gold is maintaining an upward structure after creating a series of bullish BoS from the Demand zone. Currently, the price is technically pulling back to discount zones, where the BUY side has more advantages.
Above, the 4,206 USD zone is confirmed as OB Bearish , acting as strong resistance and a potential reversal point for the SELL side.
Below, the discount zones including Fibo–Buy 4,090 and OB Bullish 4,044–4,047 USD are reasonable places to wait for BUY to continue following the main trend.
💎 Key Technical Zones
• Fibo–Buy Zone: 4,085 – 4,095 → priority BUY zone
• FVG Reaction Zone: around 4,095 – 4,105 → signal present → BUY immediately
• OB Bullish: 4,044 – 4,047 → deep, safe BUY zone
• OB Bearish: 4,206 → strong SELL zone
• Partial resistance for SELL scalp: 4,169 – 4,186 – 4,206 – 4,237
🎯 Trading Plan – BUY (Main Priority)
1️⃣ Main BUY – Fibo–Buy 4,090
• Entry: 4,085 – 4,095
• SL: below 4,060
• TP1: 4,169
• TP2: 4,186
• TP3: 4,206 / 4,237
→ This is the most beautiful discount zone according to structure + fibo + trendline.
2️⃣ BUY on Reaction – FVG
If the price only touches FVG 4,095–4,105 and then shows a strong rejection candle:
• BUY immediately when there is a signal
• Target remains: 4,169 → 4,186 → 4,206 → 4,237
3️⃣ Defensive BUY – OB Bullish 4,044
• Entry: 4,044 – 4,047
• SL: 4,020
• TP1: 4,095
• TP2: 4,169
• TP3: 4,206
→ This is the “last bottom” zone before the uptrend is threatened.
🎯 Trading Plan – SELL SCALP (Not the Main Trend)
Zones where SELL can react when a reversal candle appears:
• 4,169 USD
• 4,186 USD
• 4,206 USD (OB Bearish)
• 4,237 USD (Supply)
Entry SELL: when there is a clear rejection (H1 long wick / engulfing)
SL: above the zone 10–15 USD
TP: back to 4,186 → 4,169 → 4,128
→ These are counter-trend scalp orders, only for flexible traders.
🧠 Vincent’s View
The main trend is still up, adjustments down to FVG – Fibo – OB Bullish are all beautiful BUY opportunities.
The BUY side dominates as long as 4,044 is not broken – SELL is only secondary, BUY remains the main play.
“Buy at discount, sell at reaction — that’s how the market moves.”
⏰ Timeframe: 1H
✍️ Analysis by: Captain Vincent

Gold Price Outlook – Trade Plan (XAU/USD)📊 Technical Structure
OANDA:XAUUSD Gold (XAU/USD) has extended its rebound and is now trading above $4,140, firmly recovering from last week’s weakness. Price has successfully reclaimed the broken descending trendline and is stabilizing above the $4,124–$4,135 support zone, turning the short-term structure into a bullish continuation pattern.
Key observations:
Support is located at $4,124–$4,135, where trendline retest + horizontal demand converge.
Resistance sits at $4,171–$4,182, the key zone from November highs.
As long as the price holds above $4,124, buyers remain in control and dips are likely to attract bids.
A pullback toward the support zone is expected to bring buyers back into the market, aiming for a retest of the $4,170–$4,180 zone.
🎯 Trade Plan
Bias: Buy-the-dip near support, targeting continuation toward resistance.
Entry: $4,124 – $4,135
Stop Loss: $4,120 (below support & structure invalidation level)
Take Profit 1: $4,171
Take Profit 2: $4,182
Risk-Reward Ratio: ~1 : 2.82
Short-term bias:
Above $4,120 → Bullish continuation valid
Below $4,120 → Bullish structure invalid, stand aside
🌐 Macro Background
Gold extends its rally to a 1.5-week high, supported by rising expectations of a Federal Reserve rate cut in December. FXStreet notes:
New York Fed President John Williams signalled rates could fall in the near term.
Fed Governor Christopher Waller said the labour market is weak enough to justify another 25 bps cut in December.
CME FedWatch now shows ~80% probability of a December cut, suppressing USD strength and supporting Gold.
Meanwhile, geopolitical tensions continue to fuel safe-haven demand:
Russia launched new strikes on residential and energy facilities in Kyiv.
The US is modifying its Ukraine peace plan, which may be unacceptable to Russia.
Gaza ceasefire allegedly violated multiple times, sustaining market uncertainty.
While equities remain broadly positive (limiting upside momentum), the macro environment still favours buying dips on Gold.
🔑 Key Technical Levels
Resistance Zone: $4,171 – $4,182
Support Zone: $4,124 – $4,135
Pivot Zone: $4,150
Bullish Invalidation: $4,118 – $4,120
📌 Trade Summary
Gold maintains a bullish short-term structure, supported by Fed rate-cut expectations and heightened geopolitical risk. The preferred strategy is buying dips into $4,124–$4,135, targeting a retest of $4,171–$4,182.
As long as price stays above $4,120, bulls maintain an advantage.
⚠️ Disclaimer
This analysis is for reference only and does not constitute trading advice. Trading involves significant risk, and proper risk management is essential.

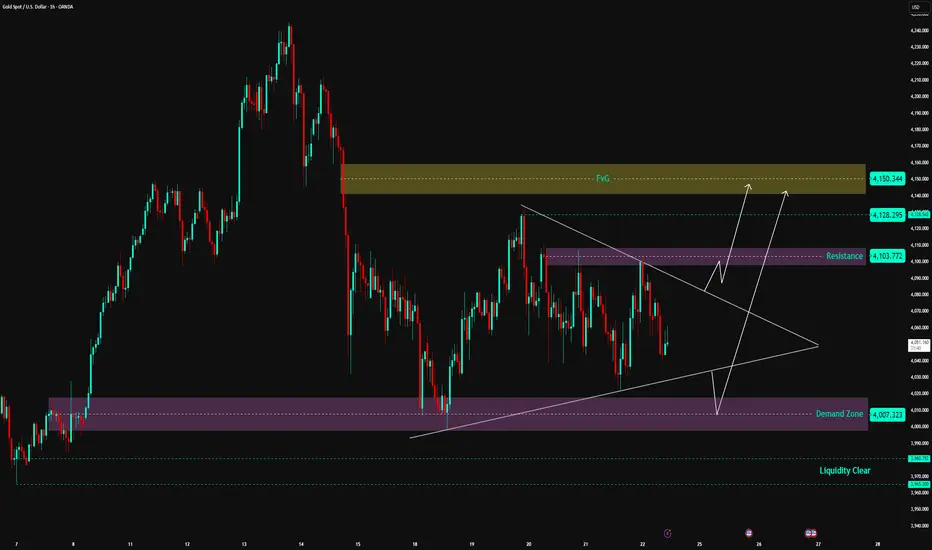
XAUUSD | Gold Set to Explode from Triangle Pattern—Act Now!📊 Market Structure
Gold is entering a tight accumulation phase within a Symmetrical Triangle pattern – indicating compression before a strong breakout.
On the downside, the price is still supported by the Demand Zone 4,007 – 4,020 USD , which is the main support area for the medium-term uptrend structure.
On the upside, the Resistance Zone 4,103 – 4,110 USD continuously exerts pressure, causing price rejection.
Currently, gold is trading right in the middle of the compression triangle → the market is preparing to choose a direction.
Looking at the wave structure, the trend slightly leans towards a break up to sweep liquidity in the high area.
💎 Key Technical Zones
• ⭐ FVG Supply Zone: 4,128 – 4,150 USD → expected strong reaction area if price breaks up
• 🟣 Resistance Zone: 4,103 – 4,110 USD → decisive area for direction
• 🟪 Demand Zone: 4,007 – 4,020 USD → strong base maintaining structure
• 🟦 Liquidity Clear: 3,980 USD → risk area if price collapses the triangle
🎯 Trading Plan – Two Possible Scenarios
1️⃣ BUY – Wait for Breakout from Triangle (priority scenario)
If the price breaks the resistance zone 4,103 – 4,110 with a strong H1 closing candle:
• Entry: 4,112 – 4,115
• SL: 4,095
• TP1: 4,128
• TP2: 4,145
• TP3: 4,150 (reach FVG)
→ This is a trend-following setup, with a high probability of sweeping liquidity above after the break.
2️⃣ BUY – Retest Demand Zone 4,007 – 4,020
If the price continues to follow the triangle pattern and falls to the trendline + demand zone:
• Entry: 4,010 – 4,017
• SL: 3,990
• TP1: 4,103
• TP2: 4,128
• TP3: 4,150
→ This is a very strong confluence area between Demand Zone + Trendline + pattern base.
❌ SELL? When is it valid?
Currently, selling is not prioritized, as the price is still above the Demand Zone and the larger structure still favors an uptrend.
Selling is only valid if the price:
• Breaks strongly below 4,007 USD
→ At this point, the market turns bearish, with a distant target of 3,980 USD.
🧠 Vincent’s View
Gold is under strong compression. When the triangle pattern is broken, the move will be extremely fast and decisive.
The current trend leans towards breaking up and heading straight into the FVG area 4,128 – 4,150 USD.
Just be patient and wait for the confirmation candle — don’t predict, react to the market.
⚡ “Breakout is born from pressure — patience profits.”
⏰ Timeframe: 1H
📅 Update: 24/11/2025
✍️ Analysis by: Captain Vincent
Gold Asia Session Set Up Nov 24 2025Price has shifted into bullish structure on the 4h and 1h making new HH so i will be taking buys targeting the next BSL level at 4211

ElDoradoFx – GOLD ANALYSIS (24/11/2025, ASIA SESSION)1. MARKET OVERVIEW
Gold pushes into Asia with strong bullish momentum after the US session rally that broke above multiple intraday structures and tagged the $4,140 High.
The market is currently showing:
• A bullish continuation structure, but overextended on short-term TFs.
• Daily trend intact above $4,032, with price building compression for a larger breakout.
• Asia likely to retrace toward discounted zones before continuation.
Bias: Bullish but expecting pullback first.
⸻
2. TECHNICAL BREAKDOWN
🔹 Daily (D1)
• Price respecting the daily support zone $4,032–$4,040.
• RSI mid-range (~52) = room for continuation upward.
• Structure remains bullish; compression could lead to a breakout toward $4,200–$4,308.
🔹 H1
• Strong breakout above EMA200 + trendline confluence.
• Price tapped $4,140 Weak High, now pulling back.
• As long as price holds above $4,120–$4,122, bulls remain in control.
🔹 15M–5M
• Clean bullish BOS chain.
• Indicators show exhaustion after the US rally.
• Expect retracement to FVG / Golden Zone before next leg up.
⸻
3. FIBONACCI ANALYSIS (Golden Zone)
Last swing:
$4,099 → $4,140
• 38.2% → $4,124
• 50.0% → $4,119
• 61.8% → $4,114
🎯 Golden Zone: $4,124 – $4,114
→ Primary discounted buy area for Asia session.
⸻
4. HIGH-PROBABILITY TRADE SCENARIOS
📈 BUY SCENARIOS (Primary Bias)
A) Standard Buy Setup (Pullback)
Buy Zone: $4,124 – $4,114
🎯 Targets:
• TP1 → $4,132
• TP2 → $4,140
• TP3 → $4,148
• TP4 → $4,161
🛑 SL: Below $4,109
⚡ Confirmation: 5M CHoCH + EMA retest.
⸻
📈 BUY BREAKOUT SETUP
Trigger: Break & H1 close above $4,140
Retest: $4,135–$4,137
🎯 Targets:
• $4,148
• $4,161
• $4,176
🛑 SL: Below $4,132
⸻
📉 SELL SCENARIOS (Countertrend only)
A) Sell From Supply Zone
Sell Zone: $4,140 – $4,148
🎯 Targets:
• $4,132
• $4,124
• $4,114
🛑 SL: Above $4,161
⚡ Look for divergence + rejection wick.
⸻
📉 SELL BREAKOUT SETUP
Trigger: Break below $4,114
Retest: $4,118–$4,120
🎯 Targets:
• $4,109
• $4,099
• $4,088
🛑 SL: Above $4,124
⸻
5. FUNDAMENTAL WATCH
• Asia expected to be quiet → lower volume → cleaner pullbacks.
• Market preparing for mid-week US macro events.
• DXY showing weakness, supporting gold’s bullish bias.
• Watch for manipulation around $4,140 (weak highs often swept).
⸻
6. KEY TECHNICAL LEVELS
Resistance: 4,140 / 4,148 / 4,161 / 4,176
Support: 4,124 / 4,119 / 4,114 / 4,109
Golden Zone: 4,124 – 4,114
Breakout Buy Trigger: > 4,140
Breakout Sell Trigger: < 4,114
⸻
7. ANALYST SUMMARY
Gold remains in a bullish continuation structure with higher targets unlocked after the US rally.
Asia session is likely to produce a retracement into discounted zones before any attempt to break the $4,140 high.
As long as $4,114 holds, the bullish narrative remains intact.
⸻
8. FINAL BIAS SUMMARY
📌 Bullish above $4,114
📌 Bearish only if price breaks and closes below $4,114
⸻
🥇 ElDoradoFx PREMIUM 3.0 – PERFORMANCE 24/11/2025 🥇
⚡ Precision Trading. Zero Drawdown.
📉 SELL +40 PIPS
📉 SELL LIMIT +70 PIPS
📈 BUY +210 PIPS
📈 BUY +20 PIPS
🕐 BUY LIMIT – Not Activated
━━━━━━━━━━━━━━━
💎 SWING TRADES – STILL RUNNING
🔵 BUY (from 05/11) → +2,850 PIPS
🟣 BUY (from 05/11) → +1,320 PIPS
📊 Long-term precision continuing to deliver massive momentum.
━━━━━━━━━━━━━━━
💰 TOTAL PIPS GAIN: +340 PIPS
🎯 5 Signals → 5 Wins
🔥 100% Accuracy Today
━━━━━━━━━━━━━━━
Congratulations if you profited!
✅📈🔥 Let’s keep dominating the market this week! 🚀
— ElDoradoFx PREMIUM 3.0 Team 🚀

Gold (XAUUSD) – H1 Market OutlookOn the H1 timeframe, Gold is currently showing consolidation around the 4120 zone, reflecting a pause after recent volatility. This area is acting as a short-term decision point where buyers and sellers are balancing out.
From a structural perspective, the current candles are leaning toward bearish momentum, suggesting that sellers are gradually building pressure. If this momentum continues, the price may revisit key intraday levels such as the 4100 zone as the first area of interest. A sustained move below this region could open the way toward deeper liquidity areas around 4080, and potentially extend into the broader demand zones near 4050–4030, where market participants have previously shown reaction.
For risk management in scenario-based analysis, the 4150 region remains an important invalidation zone, as a clear break above this structure may signal a shift in momentum or trend strength.
This outlook is shared purely for educational and analytical purposes, based on observable chart structure and price behavior. It should not be taken as financial advice or a buy/sell signal. Always confirm direction with your own analysis and risk approach.

How to choose a direction at the end of a triangular formation#XAUUSD TVC:GOLD OANDA:XAUUSD
Although gold is still in a volatile market in the short term, its current trend has entered the end of a converging triangle pattern, and the market is getting closer to choosing a direction.
The market has recently been driven primarily by news, and the current geopolitical tensions, coupled with the stalled Russia-Ukraine peace talks, may trigger a new wave of risk aversion. Therefore, during the European session, we can consider going long on gold when it retraces to the 4040-4030 range.

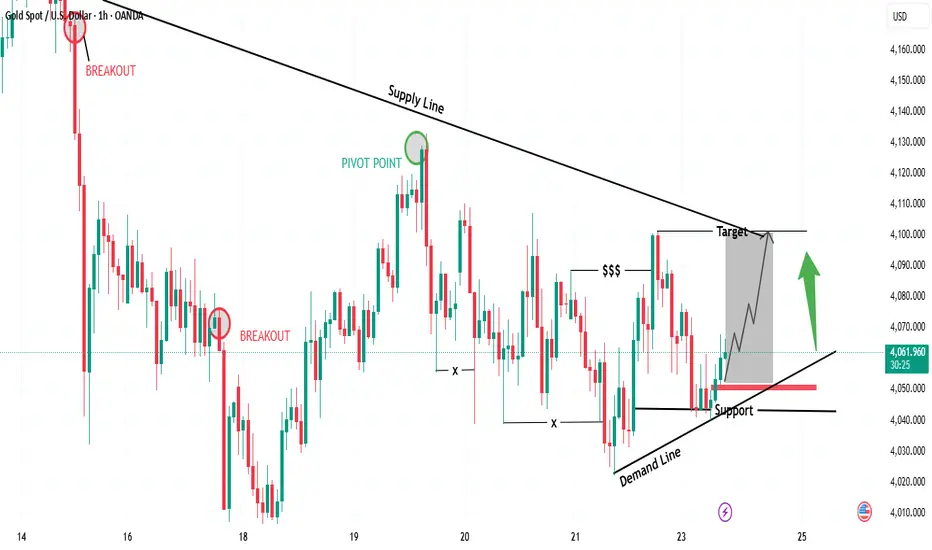
“Gold Rebounding from Demand – Targeting Supply Line Retest🔍 Key Observations
📉 Supply Line (Downtrend Resistance)
Each rally is being capped by the descending supply line
📈 Demand Line (Ascending Support)
Buyers defending higher lows
Strong bullish reaction off support
💰 Liquidity Grab ($$$)
Liquidity was taken below swing lows — bullish signal
Smart money likely securing positions before pushing up
🟢 Bullish Confirmation
If price holds above demand line + support zone
Expect bullish continuation toward supply line retest
🎯 Suitable Target Levels
Target Level (Approx) Status
🥇 First Target 4,095 – 4,105 At supply line retest
🥈 Extended Target 4,120 – 4,130 Breakout continuation
📌 Trade Idea (Bullish Scenario)
Entry Zone: 4,055 – 4,065 🟩
Stop Loss: Below 4,025 ❌
Take Profit 1: 4,100 🎯
Take Profit 2: 4,125 🚀
RR Ratio: 1:2.5 – 1:3 📈
🧭 Market Sentiment
📍 Bias → Short-term Bullish
🛑 But… sellers may reappear at supply line
⚠️ Watch for fakeouts near the target
Gold Trade Set Up Nov 24 2025Price is in a 4h range but internally making HH/HL and swept SSL in Asia and engulfed in London so am expecting price to sweep internal 5m-15m SSL before continuing its bullish push to PDH and higher BSL

Gold prepares for the US trading session1. Trendline Structure
Upper trendline (descending – red)
Connects descending highs → acts as key dynamic resistance.
Price has been tested and rejected several times → medium-term trend remains down.
Possible bullish breakout zone: 4105 – 4110.
Lower trendline (ascending – red)
Connects higher lows → key dynamic support.
Price is approaching a convergence point, indicating an imminent breakout from the contracting triangle.
2. Resistance Zone
Strong resistance: 4090 – 4110
Coincides with the descending trendline and the previous supply zone.
If a breakout occurs and consolidation occurs above 4110 → further growth potential opens up.
3. Support Zone
Support 1: 4000 – 4004
Nearest demand zone.
If broken, the breakout of the lower trendline will be confirmed, leading to a sharp decline.
Support 2: 3955 – 3965
Fibonacci extension 2.618 + key low zone.
Deep downside target.
Trading Plan
BUY GOLD: 4004 – 4002
Stop Loss: 3994
Take Profit: 100–300–500 pips
SELL GOLD: 4104 – 4106
Stop Loss: 4114
Take Profit: 100–300–500 pips

Gold Intraday Channel UpdateGold is currently moving within an ascending channel, with price reacting around the mid-range of the structure. The lower boundary of the channel is acting as a dynamic support zone, while the upper boundary remains the next reaction area to watch.
If price maintains stability above the lower trendline, the structure suggests space toward the upper channel region around the recent intraday highs. The chart highlights how price has been respecting both channel boundaries throughout the session.
This update focuses on the current market structure and key levels visible within the channel.
XAUUSD Technical Snapshot1️⃣ Analysis (3 sentences):
Price is currently consolidating inside a contracting structure, sitting between the support zone at 4000–4003 and the 4100 resistance area. Liquidity is building on both sides, suggesting a potential engineered sweep before a decisive move. My bias: a final dip toward the 4003 support zone to collect liquidity → then a bullish leg targeting 4150–4200 if FOMC volatility aligns.
2️⃣ Key Zones:
Resistance: 4095–4115
Support: 3997–4003
Bias: Liquidity sweep → bullish continuation
3️⃣ Disclaimer:
This is personal analysis only and should not be taken as financial advice. Market conditions can change rapidly—always manage risk carefully.

Gold (XAU/USD): The Final Compression! Order Zone Ready!1H Frame | Gold is squeezed between 4,040 - 4,085 (Symmetrical Triangle).
1. ⚙️ SPECIFIC ORDER ZONES (Actionable Zones)
BUY Zone (Bet on a rise):
Entry: 4,044 - 4,046
Stop Loss (SL): 4,038
Strategy: Strong support zone (TA Confluence), bet on a rise.
SELL Scalp Zone (Short-term):
Entry: 4,071 - 4,073
Stop Loss (SL): 4,077
Strategy: Near resistance, narrow trading.
SELL ZONE (Strong resistance):
Entry: 4,097 - 4,099
Stop Loss (SL): 4,107
Strategy: Strong resistance - Wait for profit-taking/reversal.
⚡ BIG BREAKOUT Scenario
LONG Breakout: Above 4,085 to TP: 4,110 to 4,130.
SHORT Breakout: Below 4,040 to TP: 4,020 to 4,000.
2. 📰 FUNDAMENTALS
Market awaits US Data (Jobs, PCE) and Fed Decision. News will be the catalyst for Breakout.
💡 STRATEGY SUMMARY
Be patient for Breakout. Scalp/Limit orders need tight SL. Act on technical break supported by news.
#Gold #XAUUSD #Forex #TechnicalAnalysis #Gold #TradingSetup #Breakout #SwingTrading

XAUUSD Analysis todayHello traders, this is a complete multiple timeframe analysis of this pair. We see could find significant trading opportunities as per analysis upon price action confirmation we may take this trade. Smash the like button if you find value in this analysis and drop a comment if you have any questions or let me know which pair to cover in my next analysis.

XAU/USD 24 November 2025 Intraday AnalysisH4 Analysis:
-> Swing: Bullish.
-> Internal: Bullish.
Analysis and bias remains the same as analysis dated 20 October 2025.
Price has printed as per previous intraday expectation by printing a bearish CHoCH which indicates, but not confirms, bullish pullback phase initiation.
Price is currently trading within an established internal range, however, I will continue to monitor price with regards to depth of pullback.
Intraday expectation:
Price to continue bearish, react at either discount of 50% internal EQ, or H4 supply zone before targeting weak internal high priced at 4,380.990.
Note:
The Federal Reserve’s sustained dovish stance, coupled with ongoing geopolitical uncertainties, is likely to prolong heightened volatility in the gold market. Given this elevated risk environment, traders should exercise caution and recalibrate risk management strategies to navigate potential price fluctuations effectively.
Additionally, gold pricing remains sensitive to broader macroeconomic developments, including policy decisions under President Trump. Shifts in geopolitical strategy and economic directives could further amplify uncertainty, contributing to market repricing dynamics.
H4 Chart:
M15 Analysis:
-> Swing: Bullish.
-> Internal: Bullish.
As per analysis dated 14 November 2025, price has printed a bearish CHoCH to indicate, but not confirm bearish pullback phase initiation.
Price is currently trading within an established internal range.
Intraday expectation:
Price to trade down to either discount of 50% internal EQ, or M15 demand zone before targeting weak internal high, priced at 4,245.195
Note:
Gold remains highly volatile amid the Federal Reserve's continued dovish stance, persistent and escalating geopolitical uncertainties. Traders should implement robust risk management strategies and remain vigilant, as price swings may become more pronounced in this elevated volatility environment.
Additionally, President Trump’s tariff announcements, particularly against China, are expected to further amplify market turbulence, potentially triggering sharp price fluctuations and whipsaws.
M15 Chart:

BTCUSD: Choppy VolatilityBTCUSD is experiencing volatile swings today, primarily driven by divergent Fed policy stances, alongside technical bull-bear tussles and market capital sentiment.
During the Asian session, Bitcoin briefly surged above 88,000 in the morning before reversing course in the afternoon, sliding below 86,000.
Key Levels:
Support Zones:
Primary support lies at the Bollinger Bands midline region of 85,500 – 86,000.
Secondary support is near the recent swing low around 83,500 – 84,000.
Strong support converges at the psychological and prior low zone of 80,000 – 82,000. A breakdown below the critical 80,000 level could trigger a deeper correction.
Resistance Levels:
Immediate resistance is concentrated at 87,500 – 88,000; a breakout here is necessary to mount a challenge on 89,000.
89,000 stands as a key market-focus resistance level. A decisive breach may pave the way for a test of the 90,000 psychological mark.
Buy 85000 - 85500
SL 84500
TP 86800 - 87200
Sell 87500 - 88000
SL 88500
TP 86000 - 85000
