XAUUSD is on Swing HighXAUUSD H1- M30 Timeframe SETUP
As I mentioned in my previous setup I'm expecting the buy trade from 4200-4195 as retest of BOS .
Aming target at 4220 - 4230 I'm extension
Caution:
H1-H4 candle closes should be above 4200
Xauusdupdates

Gold: A Correctional Pause Before a New RiseGold continues to trade within an upward trend, which remains valid even amid short-term corrections. After reaching local highs, the market shifted into a pullback phase, yet key support levels are holding, confirming the strength of buyers.
The current dynamics suggest that the asset is building a base for a new impulse. Corrective moves remain limited, while interest in gold persists due to expectations of a dovish Federal Reserve policy and increased demand for safe-haven assets. This strengthens the likelihood that, once consolidation ends, gold will resume its upward movement.
It is important to note that short-term fluctuations do not alter the broader picture: higher-degree waves continue to set the bullish direction. Thus, XAUUSD is in an energy accumulation phase, where the market’s next steps will determine the scale of future movement.

How to find an entry point within a trading range#XAUUSD TVC:GOLD OANDA:XAUUSD
Gold rebounded as expected after retracing to around 4170. Those who followed this strategy and executed long trades may consider taking profits and exiting the market. From the daily chart, the short-term gold price is below the MA5 and MA10, indicating a weak market. If it cannot effectively break through the short-term resistance of 4185-4195 and hold above the daily MA5 and MA10, then gold still has room for a pullback. Meanwhile, looking at both the daily and weekly charts, in the absence of major news events, there is strong support at 4150-4140, which may trigger short-term fluctuations. The first pullback to this level could present an opportunity to go long on gold.

XAUUSD is in Rangbound XAUUSD is still in Rangbound from 4180-4220.
If gold holds above the 4175 support level, you can look for buying opportunities during the European session which I took I now at 4180 zone and holding.
Secondly I took another bullish trade from 4201 as retest trade and holding it.
Aim for the 4220 –4230 target range.
If it drops below 4170 and candle closes below gold could shift into a downward trend and will Tap 4145-4135 .

XAUUSD Gold Volume Profile Resistance Trade Plan’m watching Gold (XAUUSD) right now, and we’re starting to see bearish momentum coming in after that recent consolidation phase. 📉🪙 When I apply the volume profile, price has now broken below the Point of Control (POC) — and that level is a major value area where a lot of trading activity has taken place. Once price slips under the POC, it often begins acting as strong resistance. 🧱
If Gold stays below this POC and we get a clean continuation to the downside, I’ll be looking for a potential sell setup. ✔️ However, if price pushes back above the POC and starts holding above that area, then I’ll completely abandon the bearish idea and wait for a new opportunity. ⚠️
Keep it simple — let price action tell the story.
Not financial advice.

XAU/USD hits OB Sell zone; watch for trend confirmation.◆ Market Context
The market is in a phase of forming lower highs after a strong drop from the 4,248 area. The most recent volatility shows the price creating a bearish CHoCH, then confirming a Break of Structure (BOS) — indicating a shift from equilibrium to a bearish bias.
Each recent rally has stopped below previous highs, proving that selling pressure continues to dominate.
◆ SMC & Price Action
• After BOS, the market often returns to test the Order Block (OB) area before continuing the main trend.
• On the chart, the OB Sell is located at 4,215 – 4,217, which is the point of the last push candle before the strong drop.
• This area also coincides with the short-term resistance zone and previous price behavior shows multiple reactions from sellers.
If the price approaches the OB Sell without forming a reversal structure, the likelihood of continuing to decline is high.
Liquidity above:
• 4,230
• 4,241
• 4,248
→ These are areas that may be swept before the price reverses.
◆ Main Trading Scenario
➤ Sell Scenario (priority)
• Waiting zone: 4,215 – 4,217 (OB Sell)
• Condition: appearance of price rejection, reversal pattern, or clear rejection candle
• Targets:
▪ 4,188
▪ 4,172
▪ 4,165 – 4,164 (deep support & bottom liquidity)
• Stop loss: above 4,230
→ This is the most suitable scenario with the current structure.
➤ Extended Scenario (liquidity sweep before decline)
If the price surpasses OB Sell and heads towards liquidity 4,230 – 4,241 – 4,248:
• Observe signs of weakening
• Wait for a reversal pattern
• Look for SELL entry points in the above areas with targets similar to the main scenario
This is common behavior when the market wants to gather liquidity before pushing the trend.
➤ Buy Scenario (opposite – only execute with strong confirmation)
Buy is only suitable when:
• Price breaks the nearest bearish structure
• Closes above 4,230 and holds
• Re-test of the 4,215 – 4,217 area fails
In that case, the buy target will aim for 4,241 and 4,248.
However, this is not yet activated.
◆ Summary
• The short-term trend still leans towards bearish after BOS.
• The 4,215 – 4,217 area is crucial for observing price reactions.
• Selling remains a reasonable strategy until the market breaks 4,230 with a clear signal.
• Downside targets are at 4,172 → 4,165.

XAU/USD 09 December 2025 Intraday AnalysisH4 Analysis:
-> Swing: Bullish.
-> Internal: Bullish.
Analysis and bias remains the same as analysis dated 20 October 2025.
Price has printed as per previous intraday expectation by printing a bearish CHoCH which indicates, but not confirms, bullish pullback phase initiation.
Price is currently trading within an established internal range, however, I will continue to monitor price with regards to depth of pullback.
Intraday expectation:
Price to continue bearish, react at either discount of 50% internal EQ, or H4 supply zone before targeting weak internal high priced at 4,380.990.
Note:
The Federal Reserve’s sustained dovish stance, coupled with ongoing geopolitical uncertainties, is likely to prolong heightened volatility in the gold market. Given this elevated risk environment, traders should exercise caution and recalibrate risk management strategies to navigate potential price fluctuations effectively.
Additionally, gold pricing remains sensitive to broader macroeconomic developments, including policy decisions under President Trump. Shifts in geopolitical strategy and economic directives could further amplify uncertainty, contributing to market repricing dynamics.
H4 Chart:
M15 Analysis:
-> Swing: Bullish.
-> Internal: Bullish.
Analysis and bias remains the same as yesterday's analysis dated 02 December 2025.
Price has printed as per analysis dated 14 November 2025 where I mentioned price to trade down to either discount of 50% internal EQ, or M15 demand zone before targeting weak internal high, priced at 4,245.195.
Price subsequently printed a bearish CHoCH, however, as mentioned yesterday, I would closely monitor price with respect to depth of pullback.
Price did not pull back with any significance, therefore, I will apply discretion and not classify an iBOS. I have marked this with red dotted and dashed lines.
Price has since printed another bearish CHoCH.
We are currently trading within an established internal range, however, as per yesterday, I will continue to monitor price with respect to depth of pullback.
Intraday expectation:
Price to trade down to either discount of 50% internal EQ, or M15 demand zone before targeting weak internal high, priced at 4,264.700.
Note:
Gold remains highly volatile amid the Federal Reserve's continued dovish stance, persistent and escalating geopolitical uncertainties. Traders should implement robust risk management strategies and remain vigilant, as price swings may become more pronounced in this elevated volatility environment.
Additionally, President Trump’s tariff announcements, particularly against China, are expected to further amplify market turbulence, potentially triggering sharp price fluctuations and whipsaws.
M15 Chart:

0812 Before FOMC, gold trading plan on Monday.Hello traders,
1. This Week’s Core Event: Fed December FOMC Meeting (Rate decision announced at 3:00 AM Beijing time on Dec 11)
- The focus isn’t the widely expected 25bp rate cut, but whether the Fed will restart "new bond purchases" (to replenish bank reserves). This will shape global liquidity for the next 6 months and also determine the Bank of Japan’s rate hike decision next month. Watch for statements like "using Treasury bill operations to maintain ample reserves" in the policy statement/Powell’s press conference, as well as the dot plot’s stance on consecutive rate cuts.
2. Short-Term Gold Trend Logic
- Gold will trade in a consolidation range before the FOMC meeting. It needs to reclaim above 4200 to confirm the uptrend; otherwise, a deeper pullback may follow. The expected range pre-meeting is 4160–4220 (current levels).
Gold Trading Plan (EU/US Sessions, Monday)
Fundamental Context
Gold is consolidating between 4160-4220 amid FOMC expectations, awaiting clarity on liquidity direction. Combined with the chart pattern, we’ll focus on long positions supported by the EMA zone in the short term.
Specific Trading Strategy
- Entry Condition:
Go long with a light position if price stabilizes in the 4200-4210 range (EMA support zone on the chart) during EU/US sessions (e.g., bullish candlestick patterns like a hammer or bullish engulfing).
- Stop-Loss:
Set stop-loss at 4190 (below the short-term EMA support and the key 4200 level).
- Take-Profit Targets:
1st target: 4244 (TP1 on the chart); 2nd target: 4266 (TP2 on the chart).
- Position Rules:
Keep single-position size ≤5% before the FOMC meeting (Dec 11 early morning). Partial profit-taking is allowed if TP1 is hit, while holding a small core position for post-meeting direction.
GOOD LUCK!
LESS IS MORE!

Elite | XAU/USD – Institutional Buy Zone Retest + Liquidity Run OANDA:XAUUSD
Gold continues to respect the rising trend support, generating repeated support bounces along the diagonal structure. Price recently swept sell-side liquidity inside the institutional buy zone (4182–4196) and reacted bullishly, showing willingness to target upside imbalance.
Bullish Scenario – Preferred Outlook
If price holds above the entry zone at 4208–4215:
🎯 Target 1 → 4244 – 4248
🎯 Target 2 → 4256 – 4260 liquidity zone
A break above Buy-Side Liquidity opens the way for continuation into the imbalance above.
Bearish Invalidations
Break below 4182 removes bullish strength and may shift price back toward discounted levels.
⚠️ This analysis is for educational purposes only — not financial advice.

XAU/USD: Gold Tests Liquidity Floor, Eyes Reversal BUYGold remains under pressure during the Asian session as a stronger USD and cautious sentiment ahead of key US data keep the market defensive. However, the short-term structure shows weakening downside momentum, suggesting a potential liquidity sweep before a bullish reversal.
📊 MMF Technical Outlook (M30 – H1)
1️⃣ Price is approaching the liquidity zone: 4,176 – 4,170
This area aligns with:
Previous session liquidity sweep
Lower trendline support
Strong BUY reactions in past sessions
👉 High probability for a short-term bottom.
2️⃣ Resistance holds at 4,194 – 4,210
Confluence of supply + descending trendline
Multiple rejections here
👉 Only a strong close above 4,210 confirms bullish continuation.
3️⃣ Current structure favors a “Liquidity Grab → Reversal” pattern
Signals include:
Repeated lower-wick rejections
Weakening downside pressure
Potential W-pattern forming above the trendline
👉 BUY setups become favorable once the liquidity sweep completes.
🎯 MMF Trading Plan – BUY Reversal Priority
▶️ Scenario 1 — BUY at Liquidity Zone
Wait for price to tap and react:
🔹 BUY Zone: 4,176 – 4,170
🔹 SL: below 4,164
🔹 TP1: 4,194
🔹 TP2: 4,210
🔹 TP3: 4,228 (extended target if breakout occurs)
▶️ Scenario 2 — Break & Retest Setup
If price breaks above 4,194:
🔹 Retest BUY: 4,194 – 4,196
🔹 Targets: 4,210 → 4,228
🧭 MMF Daily Bias
Primary Bias: BUY as long as 4,170 holds
Strategy: Accumulate on liquidity dips – avoid chasing mid-range
Invalidation: H1 close below 4,164

XAU/USD H1 Plan: SELL at OB, BUY at Liquidity1. Market Structure (H1)
Gold is in a corrective phase after breaking the previous upward structure. From the nearest peak, the price continuously creates downward BoS waves, confirming that selling pressure is in control in the short term.
Currently, the price is moving within a descending channel and retesting the trendline multiple times but has not been able to breakout. This supports the scenario of the price continuing to complete a deeper decline to gather liquidity before forming a major recovery wave.
2. Important technical zones on the chart
🔹 OB – Sell Zone: 4,190 – 4,197
Confluence of Fibonacci 0.5 – 0.618 of the most recent decline.
This is the H1 supply zone where the price previously broke the downward structure → prioritize observing SELL when the price retraces.
🔹 Liquidity Buy Zone: 4,154 – 4,163
Liquidity cluster located just below the nearest bottom.
This is the area where the market is likely to create a liquidity sweep before reversing upwards.
🔹 Deep Liquidity Zone: 4,115 – 4,12x
Deep liquidity zone, confirmed by multiple old bottoms formed since the beginning of the month.
If the price is pushed down here, this will be a very strong BUY zone for the next major recovery wave.
3. Trading scenarios according to structure – clear & easy to follow
🔸 Scenario 1 – SELL from OB 4,19x (main scenario)
Activation conditions:
Price retraces to OB Sell zone 4,19x
Appearance of reversal signals M15–H1: strong rejection candles, ChoCH down, engulfing
Targets:
TP1: 4,163 (Liquidity)
TP2: 4,154
TP3 extended: 4,12x – 4,115
Note: This OB zone is a beautiful confluence – if the price reacts strongly, there is a high chance the market will complete the decline according to the model.
🔸 Scenario 2 – BUY according to Liquidity Sweep (priority after SELL)
After completing the decline to liquidity zones:
BUY Zone 1: 4,154 – 4,163
Wait for bottom sweep & ChoCH up → BUY according to recovery wave
BUY Zone 2: 4,115 – 4,12x (strongest Buy)
If the price breaks through the Liquidity zone 4,15x
This is the zone where the largest buying force may appear → expect to create a new H1 bottom
Targets for both BUY zones:
TP1: 4,195 (OB Sell retest)
TP2: 4,210
TP3 extended: 4,23x – 4,24x
Further: 4,25x – 4,27x (Fibo 1.272 – 1.618)
4. Important notes & risk management
Do not BUY when the price is standing in the descending channel – wait for sweep & confirmation.
SELL is only valid when the price hits exactly OB 4,19x, avoid FOMO selling in the middle of the zone.
BUY is invalid if H1 breaks deeply below 4,110.
Strong upward scenario only activates when H1 closes above 4,200.

Gold Shows Cracks: Is the 4180 Support About to Give In?Yesterday, Gold stayed between the boundaries of the 4180–4250 range.
Although the session started with a bullish tone, buyers failed twice: first, to push price toward the upper resistance, and later, after touching support, to reclaim the 4200 zone overnight.
This inability to regain control is a clear sign of weakness.
Key Question
Has Gold finished its consolidation?
Why a continuation lower is likely?
- The market has been distributing for more than a week inside this 4180–4250 corridor.
- Failed bullish attempts reveal vanishing demand.
- Support at 4180 has become increasingly vulnerable.
If support breaks with momentum, we could see downside acceleration toward the 4100 zone.
Trading Plan
For now, the bias is bearish as long as the price stays below 4220.
Only:
- A move above 4220 would shift Gold back into a range-trading environment.
- And stabilization above 4250 would bring bulls back into the game.

GOLD ANALYSIS What’s Moving the Market Today? December 09, 2025FX:XAUUSD GOLD ANALYSIS What’s Moving the Market Today? (December 09, 2025)
Welcome back to Trade with DECRYPTERS, where we decode smart-money footprints into clean, actionable buy & sell zones.
Keep it simple. Trust the levels. Follow the plan.
📰 Market Overview
Gold continues to consolidate near the mid-range after reacting from discount levels early in the week. Price is rotating upward inside the 4180–4210 structure while heading toward premium liquidity pockets. Despite slight USD strength, gold remains supported by dovish Fed expectations, geopolitical uncertainty, and persistent central bank accumulation.
The U.S. Dollar Index remains capped below major resistance, helping gold hold its bullish tone. Treasury yields have stabilized, creating a favorable environment for non yielding assets ahead of the December 9–10 FOMC meeting, where volatility is expected.
Smart money continues its rhythm: accumulate at discount → distribute at premium, keeping the broader trend bullish.
🔍 Key Fundamentals Driving Today’s Move
📈 87–90% probability of a December Fed rate cut
→ Lower interest rates strengthen gold’s macro bullish case.
💵 USD softening after weak labor momentum
→ Supports continued upside rotation.
🌍 Geopolitical tensions (US–China + Middle East)
→ Sustains safe-haven demand.
🏦 China extends its gold-buying streak to 13 months
→ Reinforces structural demand narrative.
📊 Bond market volatility cooling
→ Keeps dips shallow and encourages trend continuation.
Gold’s strength remains driven by macro uncertainty + institutional hedging + global de-dollarization.
📰 Insights From Key Sources
“Markets pricing ~88% probability of a 25bp cut in December.”
“Fed officials hint easing will be gradual through 2026.”
Commentary highlights renewed discussions around U.S. debt-driven gold revaluation risks.
BRICS gold-backed settlement talks gaining real traction.
ETF inflows hit their strongest levels in 18 months.
US–China tariff tensions continue boosting safe-haven flows.
Global miners report supply strain and rising exploration costs.
Narrative remains unified: smart money stays net-long, macro stays supportive, dips remain opportunities.
📆 KEY EVENTS TO WATCH
🔸 JOLTS Job Data (Today — 3:00 PM UK)
Weak data → boosts rate-cut expectations → bullish for gold
Strong data → temporary spikes into sell zones → liquidity grabs likely
🔸 Geopolitical Rotations
🌍 Escalation → spikes toward premium zones
🌤️ Calm → controlled dips into discount levels
Trend holds bullish unless deep structure breaks below the buy zone.
🟩 GOLD TECHNICAL LEVELS
Gold continues to rotate efficiently between Smart Money Sell Zones → Discount Buy Zones, perfectly respecting institutional footprints.
Price is currently positioned inside the mid-range, moving between scalp opportunities and major zones.
🟩 📌 SMART MONEY BUY ORDERS: 4149 – 4163
Primary institutional demand zone deep discount liquidity.
Expect:
✔ Strong first-tap reaction
✔ Accumulation wicks & mitigation plays
✔ Higher-low formation for continuation
Break below 4149 → opens drawdown toward 4125 → 4100 liquidity.
🔺 📌 SMART MONEY SELL AREA: 4235 – 4251
Major premium sell zone — high-probability reversal region.
Expect:
✔ Manipulation above prior highs
✔ Liquidity grabs
✔ Swing short setups
Break & hold above 4251 targets:
➡ 4268 → 4284 → 4308
📌 Conclusion
Gold remains firmly bullish as long as the 4149–4163 demand zone holds, with smart money continuing to accumulate every dip. With JOLTS and FOMC approaching, expect controlled volatility before the real move unfolds. Stay focused on the key zones and let structure guide your execution.
🙌 Support the Analysis
If this breakdown added value to your trading:
👍 Drop a like
💬 Comment your levels
📈 Share your charts with the community
Let’s grow together.
Best Regards,
M. MOIZ KHATTAK | Founder — TRADE WITH DECRYPTERS

XAU/USD Price Outlook – Trade Setup📊 Technical Structure
OANDA:XAUUSD XAU/USD continues to fluctuate around the $4,190–$4,200 zone, holding above the key $4,147–$4,165 support area while repeatedly failing to break above the $4,250–$4,268 resistance zone. Recent price action shows a broad consolidation structure, with the metal rejecting the highs but finding persistent buying interest near support.
The overall structure still leans toward an upward bias inside a wider range. As long as Gold holds above $4,147, the downside remains limited and the market may attempt another move toward the upper boundary. A deeper pullback toward the support zone could offer fresh long opportunities before any retest of the resistance band. A confirmed 1H/4H close below $4,147 would invalidate this bullish scenario and indicate a potential shift in momentum.
🎯 Trade Setup
Bias: Buy on dips near the support zone.
Entry: $4,163 – $4,147
Stop Loss: $4,140
Take Profit 1: $4,250
Take Profit 2: $4,268
R:R Ratio: ~1 : 3.62
As long as price stays above the $4,163–$4,147 area, the bullish dip-buy setup remains valid. A clean 1H/4H close below $4,140 invalidates the idea and suggests reassessment.
🌐 Macro Background (Simplified)
Markets widely expect the Federal Reserve to cut rates by 25 bps this Wednesday, with FedWatch probability near 90%. This normally supports Gold because lower rates reduce the opportunity cost of holding a non-yielding asset.
However, traders are increasingly worried about a “hawkish cut” — the Fed cuts once, but signals fewer or slower cuts ahead through its dot-plot and Powell’s press conference. If this happens, the USD could firm up, limiting upside for Gold in the short term.
Before the Fed meeting, the market will watch the ADP four-week average and the JOLTS Job Openings data. Weak numbers would reinforce the case for continued easing and help Gold stabilise; stronger data may briefly pressure Gold lower. Meanwhile, rising geopolitical tension — especially renewed friction between the US and Ukraine — keeps a layer of safe-haven demand in place, helping to cushion Gold on dips.
🔑 Key Technical Levels
Resistance Zone: $4,250 – $4,268
Support Zone: $4,163 – $4,147
Invalidation Level: $4,140 (1H/4H close below)
📌 Trade Summary
XAU/USD remains range-bound ahead of the Fed meeting, holding above key support and below major resistance. The structure favours buying dips near support for a potential move toward $4,250–$4,268. A confirmed break below $4,140 invalidates the bullish outlook and calls for reassessment.
⚠️ Disclaimer
This analysis is for reference only and does not constitute trading advice. Trading involves significant risk, and proper risk management is essential.

XAUUSD delivered Excellent results [300 pips Tp]As highlighted during my TODAY'S session update:
My position & stance:
I waited for Gold to deliver a TAP of 4220 last Friday Rebound, and I identified it at the $4218 resistance test.
I executed set of sell orders at $4212 & $4205 and closed them at the $4188 & 4175 in extension.
I want to take this moment to congratulate all the traders who followed my calls and patiently held their positions. Well done — enjoy the profits, and have a wonderful Day

4250–4180: The Box Controlling GoldDespite a week filled with major fundamental releases, gold spent the entire period trapped inside a 4250–4180 range.
Even Friday’s strong early rally into 4250 failed to hold, with the daily close producing a sharp sell-off that left traders without a clear directional bias.
Today’s Asian session opened with renewed buying interest, lifting price back toward 4220, the midpoint of the range. But without a decisive breakout, the medium-term direction remains unclear.
Technically, both the medium-term and long-term trends are still bullish. However, as long as price remains locked inside this range, taking trades carries elevated risk.
What I want to see next:
Bullish scenario:
A fresh attempt to break above resistance, followed by either a clean breakout or a tight consolidation right below it — a classic pressure-building structure.
Bearish scenario:
A breakdown below 4175–4180, which could open the door for a move back toward 4100 or even lower.
Until we get clarity, I remain on the sidelines.
Gold: Narrow-Range Oscillation TodayGold is trading in a narrow-range oscillation overall with intense bull-bear confrontation. Influenced by a combination of fundamental and technical factors, the market is in a short-term consolidation phase, awaiting a clear directional breakout. Despite extremely stable intraday performance (volatility less than 0.3%), the backdrop features a high-stakes game with open interest surging to 450,000 contracts. Primarily, amid anticipation of the Fed’s policy announcement, market sentiment remains cautious, making a one-sided trend unlikely.
The Bollinger Bands are showing signs of contraction, and the moving average system is converging, this pattern further confirms gold’s current consolidation state.
Key support and resistance levels are clearly defined:
Intraday Short-term Resistance: $4,225 – $4,230, a critical suppression level for short-term price action.
Strong Resistance: $4,250 – $4,260, a zone that has repelled multiple breakout attempts, accumulating significant profit-taking sell orders.
Intraday Short-term Support: $4,190 – $4,200.
Strong Support: Around $4,175 – $4,180 that is a crucial watershed for bull-bear dynamics.
Trading Strategy:
Buy 4195 - 4205
SL 4180
TP 4225 - 4235 - 4245
Sell 4235 - 4225
SL 4245
TP 4210 - 4200 - 4190

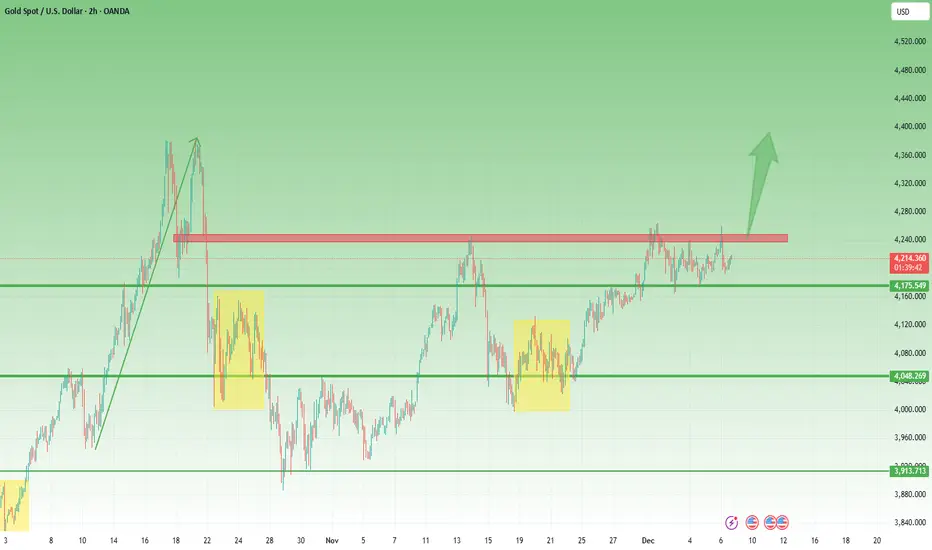
GOLD is bullish - time to buy now...XAUUSD (GOLD) was recently in a short term downtrend for a few weeks but has now shown some clear bullish movements ahead. XAUUSD (Gold) has broken out of a downward trend channel that was acting as strong resistance, The price is very likely to head to the next strong resistance level which is marked as the take profit zone (green line). Time to buy GOLD!

XAUUSD 1H – Bullish Structure | Demand Zone Entry1. Market Structure
Timeframe: 1H (Gold Spot / USD)
Overall structure: Ascending channel
Price has been making higher lows and higher highs, which confirms a bullish intraday trend, not a random range.
✅ Bias stays bullish as long as price respects the channel and demand zone.
---
2. Key Zones on the Chart
🔴 Demand / Support Zone (Red Area)
Approx 4,157 – 4,177
This zone has:
Prior reaction lows
Confluence with channel support
Strong area where buyers previously stepped in
📌 If price returns and holds here, it’s a high-probability buy zone.
🔵 Channel Mid / Fair Value
Price currently hovering near the middle of the channel
This is not ideal for fresh entries
Better trades come from edges, not the middle
---
3. Target & Upside
Target: ~4,260
That aligns with:
Upper channel resistance
Prior highs
Your projected move (green box) suggests a clean R:R, which is good planning.
📈 If momentum strengthens, price can stair-step higher toward this zone without deep pullbacks.
---
4. Invalidation / Risk
Clear invalidation: Hourly close below 4,157
That would:
Break demand
Likely break channel
Shift bias to range or bearish correction
🚫 Without that break, selling is counter-trend and low probability.
---
5. Trade Scenarios (What I’d Actually Do)
✅ Bullish Continuation (Preferred)
Wait for:
Pullback into 4,170–4,180
Bullish candle confirmation (pin bar / engulfing)
Targets:
Partial at 4,220
Final near 4,250–4,260
⚠️ Aggressive Buy
Buy mid-channel only if:
Strong momentum candles
Volume expansion
Otherwise, patience beats FOMO
---
Bottom Line
Trend: Bullish
Best action: Buy pullbacks, not breakouts
Your zone marking: Well done — logical and disciplined
Main risk: Chasing price in the middle of the channel

Gold Trade Set Up Dec 8 2025Price is consolidating after a big push down last friday. I will be looking waiting for price to come up to sweep Asia and London high/BSL, and tap into 1h FVG to then look for internal 5m-15m bearish engulfing candle and CISD to target PDL

XAUUSD Rising Channel Reaction – Key Breakdown Level MarkedGold has been trading inside a rising channel, making a series of higher lows while respecting the channel boundaries. Price recently tested the upper supply region, where strong selling pressure appeared.
A key horizontal level around 4,167 is now acting as an important decision area. A confirmed break below this level could open the path toward deeper downside, while holding above it may lead to a temporary reaction or bounce.
Key Technical Areas:
Upper Rejection / Supply Zone: 4,260 – 4,270
Channel Mid Reaction Zone: 4,200 – 4,220
Key Support Level: 4,167
Extended Downside Zone: 4,120 – 4,140
Technical Outlook:
As long as price remains below the upper supply area, bearish pressure can continue. A clean break and close below 4,167 would shift momentum further downward.

XAUUSD is on correction H1 TIMEFRAME SETUP
Market is moving in extremely rangbound from 4180-4220.
We need to closely monitor the key level at 4218-4225 and I'm expecting the Sell trade beforeupside move.
And my Targets remain 4185 then 4170 .
Keep in mind If price action close above 4220 wait for the next setup

Gold Weekly Analysis – Dec 8Hi guys
🔶 Gold Weekly Analysis – Dec 8 (H4)
📈 Overall bias: Bullish
🔸 Resistance 1: 4237.5
If we see a CHOCH + break of structure, I’ll look for a sell setup.
🔸 Resistance 2: 4317.4
If price breaks above the first zone, this is the next major level to watch.
🔹 Support: 4100.4
If price pulls back to this zone and gives a CHOCH confirmation, it can be a great buy setup.
